Smart Ovens Market Analysis, Size, and Forecast 2024-2028: North America (Canada and Mexico), Europe (France, Germany, and UK), Middle East and Africa (UAE), APAC (Australia, China, India, Japan, and South Korea), South America (Brazil), and Rest of World (ROW)

Smart Ovens Market Analysis, Size, and Forecast 2024-2028:
North America (Canada and Mexico), Europe (France, Germany, and UK), Middle East and Africa (UAE), APAC (Australia, China, India, Japan, and South Korea), South America (Brazil), and Rest of World (ROW)

Published: Jun 2024 176 Pages SKU: IRTNTR74451

Market Overview at a Glance

$519.8 Mn
Market Opportunity
20.65%
CAGR
15.57
YoY growth 2023-2024(%)

Smart Ovens Market Size 2024-2028

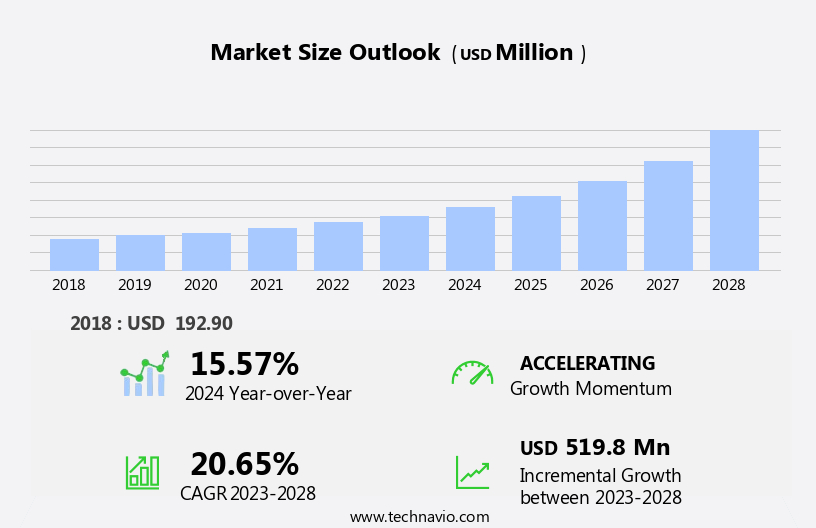
The smart ovens market size is forecast to increase by USD 519.8 million at a CAGR of 20.65% between 2023 and 2028.

  • The market is witnessing significant growth, driven by the changing lifestyles in both developed and developing economies. Consumers are increasingly seeking convenience and efficiency in their daily lives, leading to a high demand for smart ovens that offer features such as voice control, remote access, and energy efficiency. However, the market also faces challenges, particularly in the area of safety issues in mobile applications. As more consumers use mobile devices to control their smart ovens, ensuring secure and reliable connectivity becomes a critical concern. Companies in the market must prioritize addressing these safety concerns through robust cybersecurity measures and user-friendly interfaces to meet consumer demands and maintain market competitiveness.
  • Additionally, the market is expected to benefit from ongoing advancements in IoT and AI technologies, enabling more sophisticated cooking functions and personalized user experiences. Companies seeking to capitalize on these opportunities should focus on developing innovative features and collaborating with key industry players to stay ahead of the competition.

What will be the Size of the Smart Ovens Market during the forecast period?

Smart Ovens Market Size

 Request Free Sample

  • The market continues to evolve, integrating advanced technology into traditional kitchen appliances to cater to tech-savvy consumers and their evolving meal decisions. Smart ovens offer temperature control, wi-fi connectivity, and smart technology, enabling consumers to monitor and control cooking processes remotely. These devices are not limited to ovens, as blenders, coffee maker machines, and microwaves also incorporate similar features. Manufacturing hubs prioritize nutrition and health, with connected home appliances seamlessly integrated into functional kitchen spaces. Busy lifestyles and online shopping have fueled the demand for smart home technology, allowing consumers to preheat ovens and access recipe libraries from their smartphones or other devices.
  • Consumer electronics moguls have responded with device connectivity, allowing for personalized product recommendations and hand free control. Nutritional information, calorie tracking, and dietary preferences are essential considerations for health-conscious consumers. Smart ovens offer pre-programmed cooking modes, additional cooking capabilities, and energy efficiency. Safety features, such as sensor technology and remote monitoring, provide peace of mind.

How is this Smart Ovens Industry segmented?

The smart ovens industry research report provides comprehensive data (region-wise segment analysis), with forecasts and estimates in "USD million" for the period 2024-2028, as well as historical data from 2018-2022 for the following segments.

  • Distribution Channel
    • Offline
    • Online
  • Product
    • Smart microwave oven
    • Small wall oven
  • Connectivity
    • Wi-Fi
    • Bluetooth
  • End-User
    • Residential
    • Commercial
  • Geography
    • North America
      • US
      • Canada
      • Mexico
    • Europe
      • France
      • Germany
      • UK
    • Middle East and Africa
      • UAE
    • APAC
      • Australia
      • China
      • India
      • Japan
      • South Korea
    • South America
      • Brazil
    • Rest of World (ROW)

By Distribution Channel Insights

The offline segment is estimated to witness significant growth during the forecast period.

In the dynamic kitchen appliance market, tech-savvy consumers seek high-quality, energy-efficient, and convenient solutions for their functional kitchen spaces. Smart ovens, equipped with Wi-Fi connectivity, voice controls, and pre-programmed cooking modes, have gained significant traction. These appliances offer calorie tracking, personalized product recommendations, and built-in companion apps for remote monitoring and meal decisions. Safety features, such as temperature control and sensor technology, are essential considerations. However, data privacy and hacking concerns persist, necessitating robust security measures. Connected home appliances, including smart ovens, are part of the growing trend towards health and wellness, with dietary preferences and nutritional information becoming increasingly important.

companies are responding to these trends by offering additional cooking capabilities, offline channels, and delivery options. Haier Group, a leading consumer electronics mogul, has established strategic alliances with retailers like GOME Retail and Suning in China to boost sales through offline channels. Haier Smart Home Co. Ltd. Also maintains relationships with regional distributors through clubs like V58 and V140. Smart ovens cater to various cooking tasks and dietary restrictions, offering premium, visually appealing designs and hand-free control. Energy efficiency, convenience, and affordability are key factors driving demand for these appliances. As the market evolves, we can expect further innovations in smart technology, recipe libraries, and connected home devices.

In this bustling market, traditional ovens face competition from smart appliances and smartphone apps, offering healthy eating options and manual supervision through electric kettles and multiple function settings. The counter-top segment, including air fryers and coffee maker machines, is particularly popular among busy lifestyles. Despite the convenience of online shopping, physical stores remain an essential part of the sales landscape, with store hours and kitchen design playing crucial roles in consumer decision-making.

Smart Ovens Market Size

Request Free Sample

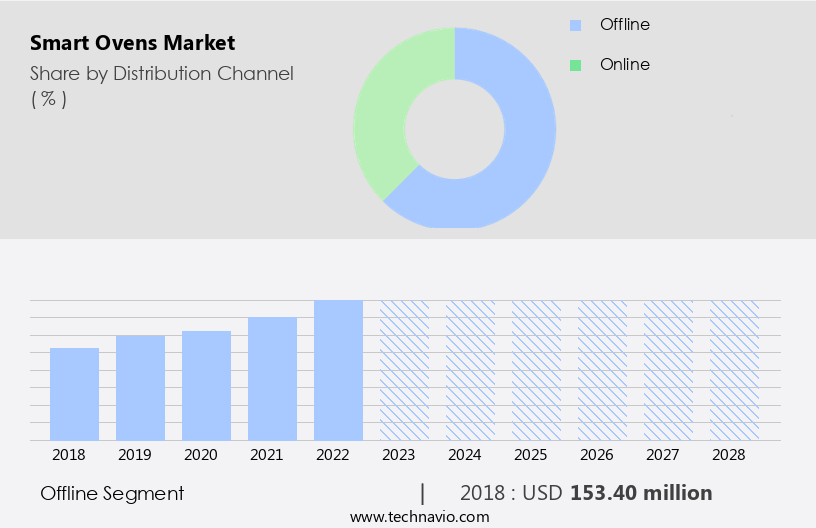
The Offline segment was valued at USD 153.40 million in 2018 and showed a gradual increase during the forecast period.

Regional Analysis

North America is estimated to contribute 40% to the growth of the global market during the forecast period.Technavio's analysts have elaborately explained the regional trends and drivers that shape the market during the forecast period.

Smart Ovens Market Share by Geography

 Request Free Sample

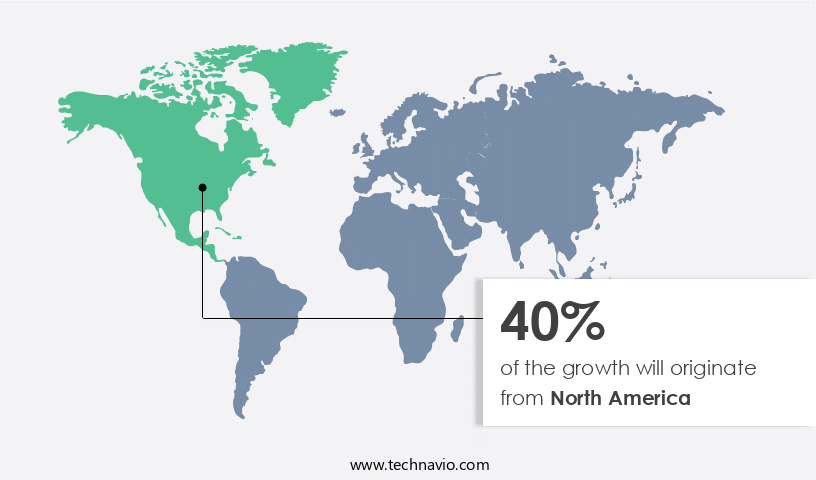
In the dynamic market of kitchen appliances, smart ovens have emerged as a significant trend, with North America being the second-largest contributor to global sales in 2023. The region's growth can be attributed to increasing consumer awareness of the advantages of high-quality, connected cooking appliances, and the favorable infrastructure, including high Wi-Fi penetration and the widespread adoption of smart homes. Smart ovens offer features such as temperature control, calorie tracking, pre-programmed cooking modes, and voice controls, catering to tech-savvy consumers and their busy lifestyles. The US, as the leading country in this market, is expected to witness notable growth during the forecast period due to the rising popularity of smart home technology.

These appliances integrate with companion apps, allowing for personalized product recommendations and remote monitoring, enhancing the user experience. Additionally, smart ovens provide energy efficiency, safety features, and offline cooking capabilities, making them an attractive choice for households. The market's evolution also includes the integration of nutrition and dietary preference information, making healthy eating more convenient. The smart oven market in North America continues to expand, driven by consumer preferences for functional kitchen spaces and the increasing availability of online shopping platforms and delivery options.

Market Dynamics

Our researchers analyzed the data with 2023 as the base year, along with the key drivers, trends, and challenges. A holistic analysis of drivers will help companies refine their marketing strategies to gain a competitive advantage.

What are the key market drivers leading to the rise in the adoption of Smart Ovens Industry?

  • In developed and developing economies, the shift in consumer lifestyles serves as the primary catalyst for market growth. 
  • The global smart oven market caters to the growing demand for advanced cooking appliances that offer convenience and connectivity. Smart ovens, which often include features like Bluetooth connectivity and compatibility with smartphone apps, fall into the premium category due to their innovative technology. These appliances offer multiple function settings, making healthy eating easier with functions for air fryers, juicers, and healthy cooking. While manual supervision is still required, the appeal of smart appliances lies in their ability to enhance kitchen design and energy efficiency. However, security concerns may arise due to the need for connectivity. Affordability remains a consideration for some consumers, with counter-top options available for those who prefer an offline experience.
  • Despite these factors, the market continues to grow as emerging economies, such as China and India, expand their middle class and embrace smart technologies. With over 80% of middle-class individuals residing in emerging countries by 2023, according to the World Bank, the potential for market expansion is significant.

What are the market trends shaping the Smart Ovens Industry?

  • The increasing demand for energy-efficient microwave ovens represents a significant market trend. These appliances, which consume less power while delivering quick cooking results, are highly sought after by consumers prioritizing energy savings and cost-effective kitchen solutions.
  • Smart ovens, a type of high-tech kitchen appliance, have gained popularity due to their energy efficiency and advanced features. These ovens offer data privacy, ensuring user information is secure. With temperature control and calorie tracking, they cater to various dietary preferences and help manage nutritional intake. Built-in companion apps and voice controls enable users to manage cooking tasks from their digital platforms. Pre-programmed cooking modes and multi-function capabilities add versatility to these appliances. Safety features ensure secure operation, while offline channels allow cooking without Wi-Fi connectivity.
  • Personalized product recommendations offer customized solutions for consumers. As energy-efficient kitchen appliances become a priority in functional kitchen spaces, smart ovens offer significant savings on utility bills while providing additional cooking capabilities. Connected home appliances are the future, and smart ovens are an essential addition to this trend.

What challenges does the Smart Ovens Industry face during its growth?

  • The growth of the mobile application industry is significantly impacted by safety concerns, which represent a crucial challenge that necessitates continuous attention and innovation from industry professionals. 
  • Smart ovens, equipped with advanced technology, cater to tech-savvy consumers seeking convenience and improved well-being in their meal decisions. These innovative appliances offer Wi-Fi connectivity, enabling hand-free control through smartphones. Consumers can preheat their ovens, manage cooking processes, and access recipe libraries from anywhere. Nutrition-conscious individuals benefit from smart ovens' ability to preserve nutrients, making them an essential addition to connected homes.
  • Busy lifestyles have led to an increased demand for smart home devices, including coffee maker machines and blenders, all of which can be controlled via device connectivity. Online shopping has made it easier than ever to purchase these consumer electronics. Smart ovens' delivery option adds to their appeal, making meal preparation more efficient and hassle-free.

Exclusive Customer Landscape

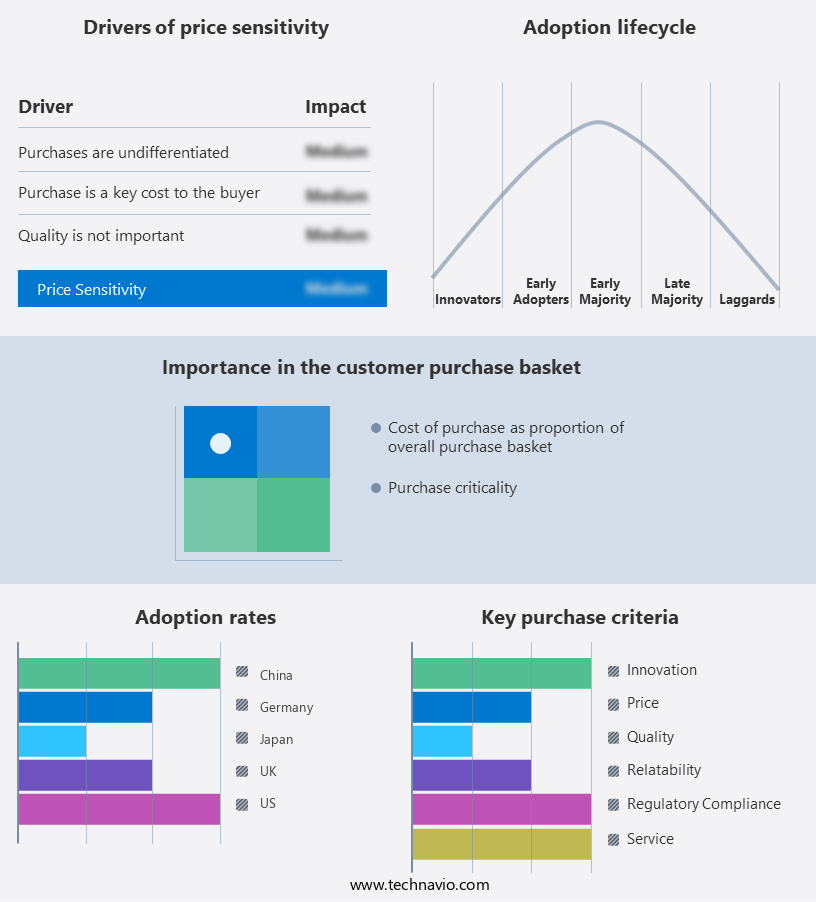
The smart ovens market forecasting report includes the adoption lifecycle of the market, covering from the innovator's stage to the laggard's stage. It focuses on adoption rates in different regions based on penetration. Furthermore, the smart ovens market report also includes key purchase criteria and drivers of price sensitivity to help companies evaluate and develop their market growth analysis strategies.

Smart Ovens Market Share by Geography

 Customer Landscape

Key Companies & Market Insights

Companies are implementing various strategies, such as strategic alliances, smart ovens market forecast, partnerships, mergers and acquisitions, geographical expansion, and product/service launches, to enhance their presence in the industry.

Alto Shaam Inc. - This company specializes in advanced cooking solutions, featuring innovative smart ovens such as the Joule Oven Air Fryer Pro, Smart Oven Air Fryer Pro, and similar models. These state-of-the-art appliances optimize cooking processes through intelligent technology, enhancing the user experience and delivering consistent results. By integrating air fryer functionality, these smart ovens cater to health-conscious consumers seeking delicious, crispy meals without the added fat of traditional frying methods. The company's commitment to innovation and quality sets it apart in the market, providing consumers with a modern, efficient, and versatile cooking solution.

The industry research and growth report includes detailed analyses of the competitive landscape of the market and information about key companies, including:

  • Alto Shaam Inc.
  • Brandt Group
  • Breville Group Ltd.
  • Electrolux group
  • General Electric Co.
  • GoWISE USA
  • Haier Smart Home Co. Ltd.
  • Hitachi Ltd.
  • JS Global Lifestyle Co. Ltd.
  • LG Electronics Inc.
  • Maestro Food Co.
  • MIDEA Group Co. Ltd.
  • Miele and Cie. KG
  • Panasonic Holdings Corp.
  • Robert Bosch GmbH
  • Samsung Electronics Co. Ltd.
  • Sharp Corp.
  • Smeg S.p.a.
  • Weber Stephen Products HK Ltd.
  • Whirlpool Corp.

Qualitative and quantitative analysis of companies has been conducted to help clients understand the wider business environment as well as the strengths and weaknesses of key industry players. Data is qualitatively analyzed to categorize companies as pure play, category-focused, industry-focused, and diversified; it is quantitatively analyzed to categorize companies as dominant, leading, strong, tentative, and weak.

Recent Development and News in Smart Ovens Market

  • In January 2024, Whirlpool Corporation, a leading appliance manufacturer, introduced the new "6th Sense Live" technology for their smart ovens, enabling real-time cooking monitoring and remote control via a smartphone app (Whirlpool Press Release, 2024). This innovation marks a significant advancement in the smart oven market, offering increased convenience and precision for home cooks.
  • In March 2025, Bosch Home Appliances and Amazon announced a strategic partnership, allowing Alexa to control Bosch smart ovens, providing voice-activated cooking capabilities and seamless integration with other smart home devices (Bosch Press Release, 2025). This collaboration underscores the growing importance of IoT and voice-controlled technology in the smart oven market.
  • In May 2024, Panasonic Corporation completed the acquisition of Just Kitchen, a startup specializing in AI-powered cooking technology, for approximately USD100 million (Reuters, 2024). This acquisition positions Panasonic to offer advanced cooking features and personalized recipes in their smart ovens, setting them apart from competitors.
  • In October 2025, the European Union passed new regulations mandating energy efficiency standards for smart ovens, effective from 2027 (European Commission, 2025). This policy change emphasizes the importance of energy efficiency in the smart oven market and encourages manufacturers to innovate in this area.

Research Analyst Overview

In the dynamic the market, companion apps and online retail platforms are revolutionizing the way consumers purchase and use small kitchen appliances. These apps offer personalized product recommendations based on individual preferences and cooking history. Safety features, such as preheat alerts and cooking temperature controls, ensure convenient and safe use. Bluetooth and device connectivity enable hand-free control via smartphones, enhancing the user experience. Algorithms analyze cooking processes and provide calorie tracking and nutritional information for health-conscious consumers. Counter top segment growth is driven by the convenience of small, visually appealing devices. Wi-Fi and delivery options cater to busy lifestyles, while voice controls add functional kitchen spaces to the digital platform.

The counter top segment, including small kitchen appliances, offers affordability and convenience for consumers. Online retail platforms and offline channels cater to various preferences, with ratings and algorithms guiding purchasing decisions. Commercial applications, including kitchen fires and labor concerns, are addressed through smart appliances and smartphone apps.

The ongoing integration of smart technology into kitchen appliances reflects the dynamic nature of the market, with premium home appliances offering visually appealing designs and manual supervision options for chefs. Energy efficiency and healthy cooking functions are essential considerations for households, with air fryers and juicers gaining popularity. Despite the numerous benefits, security concerns and hacking risks persist, requiring ongoing attention from manufacturers and consumers alike. The market's continuous unfolding is shaped by the interplay of convenience, affordability, and evolving consumer preferences, with smart ovens and other connected home appliances becoming integral components of modern kitchen spaces.

Smart ovens integrate with juicers and other small appliances, expanding their capabilities. Physical stores remain relevant by offering demonstrations and expert advice. Overall, the market continues to evolve, meeting the needs of consumers seeking efficient, connected, and nutritious cooking solutions.

Dive into Technavio's robust research methodology, blending expert interviews, extensive data synthesis, and validated models for unparalleled Smart Ovens Market insights. See full methodology.

Market Scope

Report Coverage

Details

Page number

176

Base year

2023

Historic period

2018-2022

Forecast period

2024-2028

Growth momentum & CAGR

Accelerate at a CAGR of 20.65%

Market growth 2024-2028

USD 519.8 million

Market structure

Fragmented

YoY growth 2023-2024(%)

15.57

Key countries

US, China, Germany, Japan, UK, Australia, India, France, Brazil, Canada, Brazil, UAE, Australia, Rest of World (ROW), Saudi Arabia, France, South Korea, and Mexico

Competitive landscape

Leading Companies, Market Positioning of Companies, Competitive Strategies, and Industry Risks

Request Free Sample

What are the Key Data Covered in this Smart Ovens Market Research and Growth Report?

  • CAGR of the Smart Ovens industry during the forecast period
  • Detailed information on factors that will drive the growth and forecasting between 2024 and 2028
  • Precise estimation of the size of the market and its contribution of the industry in focus to the parent market
  • Accurate predictions about upcoming growth and trends and changes in consumer behaviour
  • Growth of the market across North America, Europe, APAC, South America, and Middle East and Africa
  • Thorough analysis of the market's competitive landscape and detailed information about companies
  • Comprehensive analysis of factors that will challenge the smart ovens market growth of industry companies

We can help! Our analysts can customize this smart ovens market research report to meet your requirements.

Get in touch

1 Executive Summary

  • 1.1 Market overview
    • Executive Summary - Chart on Market Overview
    • Executive Summary - Data Table on Market Overview
    • Executive Summary - Chart on Global Market Characteristics
    • Executive Summary - Chart on Market by Geography
    • Executive Summary - Chart on Market Segmentation by Distribution Channel
    • Executive Summary - Chart on Market Segmentation by Product
    • Executive Summary - Chart on Incremental Growth
    • Executive Summary - Data Table on Incremental Growth
    • Executive Summary - Chart on Company Market Positioning

2 Market Landscape

  • 2.1 Market ecosystem
    • Parent Market
    • Data Table on - Parent Market
  • 2.2 Market characteristics
    • Market characteristics analysis
  • 2.3 Value chain analysis
    • Value Chain Analysis

3 Market Sizing

  • 3.1 Market definition
    • Offerings of companies included in the market definition
  • 3.2 Market segment analysis
    • Market segments
  • 3.3 Market size 2023
    • 3.4 Market outlook: Forecast for 2023-2028
      • Chart on Global - Market size and forecast 2023-2028 ($ million)
      • Data Table on Global - Market size and forecast 2023-2028 ($ million)
      • Chart on Global Market: Year-over-year growth 2023-2028 (%)
      • Data Table on Global Market: Year-over-year growth 2023-2028 (%)

    4 Historic Market Size

    • 4.1 Global Smart Ovens Market 2018 - 2022
      • Historic Market Size - Data Table on Global Smart Ovens Market 2018 - 2022 ($ million)
    • 4.2 Distribution Channel segment analysis 2018 - 2022
      • Historic Market Size - Distribution Channel Segment 2018 - 2022 ($ million)
    • 4.3 Product segment analysis 2018 - 2022
      • Historic Market Size - Product Segment 2018 - 2022 ($ million)
    • 4.4 Geography segment analysis 2018 - 2022
      • Historic Market Size - Geography Segment 2018 - 2022 ($ million)
    • 4.5 Country segment analysis 2018 - 2022
      • Historic Market Size - Country Segment 2018 - 2022 ($ million)

    5 Five Forces Analysis

    • 5.1 Five forces summary
      • Five forces analysis - Comparison between 2023 and 2028
    • 5.2 Bargaining power of buyers
      • Bargaining power of buyers - Impact of key factors 2023 and 2028
    • 5.3 Bargaining power of suppliers
      • Bargaining power of suppliers - Impact of key factors in 2023 and 2028
    • 5.4 Threat of new entrants
      • Threat of new entrants - Impact of key factors in 2023 and 2028
    • 5.5 Threat of substitutes
      • Threat of substitutes - Impact of key factors in 2023 and 2028
    • 5.6 Threat of rivalry
      • Threat of rivalry - Impact of key factors in 2023 and 2028
    • 5.7 Market condition
      • Chart on Market condition - Five forces 2023 and 2028

    6 Market Segmentation by Distribution Channel

    • 6.1 Market segments
      • Chart on Distribution Channel - Market share (2023-2028) (%)
      • Data Table on Distribution Channel - Market share (2023-2028) (%)
    • 6.2 Comparison by Distribution Channel
      • Chart on Comparison by Distribution Channel
      • Data Table on Comparison by Distribution Channel
    • 6.3 Offline - Market size and forecast (2023-2028)
      • Chart on Offline - Market size and forecast (2023-2028) ($ million)
      • Data Table on Offline - Market size and forecast (2023-2028) ($ million)
      • Chart on Offline - Year-over-year growth (2023-2028) (%)
      • Data Table on Offline - Year-over-year growth (2023-2028) (%)
    • 6.4 Online - Market size and forecast (2023-2028)
      • Chart on Online - Market size and forecast (2023-2028) ($ million)
      • Data Table on Online - Market size and forecast (2023-2028) ($ million)
      • Chart on Online - Year-over-year growth (2023-2028) (%)
      • Data Table on Online - Year-over-year growth (2023-2028) (%)
    • 6.5 Market opportunity by Distribution Channel
      • Market opportunity by Distribution Channel ($ million)
      • Data Table on Market opportunity by Distribution Channel ($ million)

    7 Market Segmentation by Product

    • 7.1 Market segments
      • Chart on Product - Market share (2023-2028) (%)
      • Data Table on Product - Market share (2023-2028) (%)
    • 7.2 Comparison by Product
      • Chart on Comparison by Product
      • Data Table on Comparison by Product
    • 7.3 Smart microwave oven - Market size and forecast (2023-2028)
      • Chart on Smart microwave oven - Market size and forecast (2023-2028) ($ million)
      • Data Table on Smart microwave oven - Market size and forecast (2023-2028) ($ million)
      • Chart on Smart microwave oven - Year-over-year growth (2023-2028) (%)
      • Data Table on Smart microwave oven - Year-over-year growth (2023-2028) (%)
    • 7.4 Small wall oven - Market size and forecast (2023-2028)
      • Chart on Small wall oven - Market size and forecast (2023-2028) ($ million)
      • Data Table on Small wall oven - Market size and forecast (2023-2028) ($ million)
      • Chart on Small wall oven - Year-over-year growth (2023-2028) (%)
      • Data Table on Small wall oven - Year-over-year growth (2023-2028) (%)
    • 7.5 Market opportunity by Product
      • Market opportunity by Product ($ million)
      • Data Table on Market opportunity by Product ($ million)

    8 Market Segmentation by Connectivity

    • 8.1 Market segments
      • Chart on Connectivity - Market share (2023-2028) (%)
      • Data Table on Connectivity - Market share (2023-2028) (%)
    • 8.2 Comparison by Connectivity
      • Chart on Comparison by Connectivity
      • Data Table on Comparison by Connectivity
    • 8.3 Wi-Fi - Market size and forecast (2023-2028)
      • Chart on Wi-Fi - Market size and forecast (2023-2028) ($ million)
      • Data Table on Wi-Fi - Market size and forecast (2023-2028) ($ million)
      • Chart on Wi-Fi - Year-over-year growth (2023-2028) (%)
      • Data Table on Wi-Fi - Year-over-year growth (2023-2028) (%)
    • 8.4 Bluetooth - Market size and forecast (2023-2028)
      • Chart on Bluetooth - Market size and forecast (2023-2028) ($ million)
      • Data Table on Bluetooth - Market size and forecast (2023-2028) ($ million)
      • Chart on Bluetooth - Year-over-year growth (2023-2028) (%)
      • Data Table on Bluetooth - Year-over-year growth (2023-2028) (%)
    • 8.5 Market opportunity by Connectivity
      • Market opportunity by Connectivity ($ million)
      • Data Table on Market opportunity by Connectivity ($ million)

    9 Market Segmentation by End-User

    • 9.1 Market segments
      • Chart on End-User - Market share (2023-2028) (%)
      • Data Table on End-User - Market share (2023-2028) (%)
    • 9.2 Comparison by End-User
      • Chart on Comparison by End-User
      • Data Table on Comparison by End-User
    • 9.3 Residential - Market size and forecast (2023-2028)
      • Chart on Residential - Market size and forecast (2023-2028) ($ million)
      • Data Table on Residential - Market size and forecast (2023-2028) ($ million)
      • Chart on Residential - Year-over-year growth (2023-2028) (%)
      • Data Table on Residential - Year-over-year growth (2023-2028) (%)
    • 9.4 Commercial - Market size and forecast (2023-2028)
      • Chart on Commercial - Market size and forecast (2023-2028) ($ million)
      • Data Table on Commercial - Market size and forecast (2023-2028) ($ million)
      • Chart on Commercial - Year-over-year growth (2023-2028) (%)
      • Data Table on Commercial - Year-over-year growth (2023-2028) (%)
    • 9.5 Market opportunity by End-User
      • Market opportunity by End-User ($ million)
      • Data Table on Market opportunity by End-User ($ million)

    10 Customer Landscape

    • 10.1 Customer landscape overview
      • Analysis of price sensitivity, lifecycle, customer purchase basket, adoption rates, and purchase criteria

    11 Geographic Landscape

    • 11.1 Geographic segmentation
      • Chart on Market share by geography 2023-2028 (%)
      • Data Table on Market share by geography 2023-2028 (%)
    • 11.2 Geographic comparison
      • Chart on Geographic comparison
      • Data Table on Geographic comparison
    • 11.3 North America - Market size and forecast (2023-2028)
      • Chart on North America - Market size and forecast (2023-2028) ($ million)
      • Data Table on North America - Market size and forecast (2023-2028) ($ million)
      • Chart on North America - Year-over-year growth (2023-2028) (%)
      • Data Table on North America - Year-over-year growth (2023-2028) (%)
      • Chart on North America - Market size and forecast 2023-2028 ($ million)
      • Data Table on North America - Market size and forecast 2023-2028 ($ million)
      • Chart on North America - Year-over-year growth 2023-2028 (%)
      • Data Table on North America - Year-over-year growth 2023-2028 (%)
    • 11.4 Europe - Market size and forecast (2023-2028)
      • Chart on Europe - Market size and forecast (2023-2028) ($ million)
      • Data Table on Europe - Market size and forecast (2023-2028) ($ million)
      • Chart on Europe - Year-over-year growth (2023-2028) (%)
      • Data Table on Europe - Year-over-year growth (2023-2028) (%)
      • Chart on Europe - Market size and forecast 2023-2028 ($ million)
      • Data Table on Europe - Market size and forecast 2023-2028 ($ million)
      • Chart on Europe - Year-over-year growth 2023-2028 (%)
      • Data Table on Europe - Year-over-year growth 2023-2028 (%)
    • 11.5 APAC - Market size and forecast (2023-2028)
      • Chart on APAC - Market size and forecast (2023-2028) ($ million)
      • Data Table on APAC - Market size and forecast (2023-2028) ($ million)
      • Chart on APAC - Year-over-year growth (2023-2028) (%)
      • Data Table on APAC - Year-over-year growth (2023-2028) (%)
      • Chart on APAC - Market size and forecast 2023-2028 ($ million)
      • Data Table on APAC - Market size and forecast 2023-2028 ($ million)
      • Chart on APAC - Year-over-year growth 2023-2028 (%)
      • Data Table on APAC - Year-over-year growth 2023-2028 (%)
    • 11.6 South America - Market size and forecast (2023-2028)
      • Chart on South America - Market size and forecast (2023-2028) ($ million)
      • Data Table on South America - Market size and forecast (2023-2028) ($ million)
      • Chart on South America - Year-over-year growth (2023-2028) (%)
      • Data Table on South America - Year-over-year growth (2023-2028) (%)
      • Chart on South America - Market size and forecast 2023-2028 ($ million)
      • Data Table on South America - Market size and forecast 2023-2028 ($ million)
      • Chart on South America - Year-over-year growth 2023-2028 (%)
      • Data Table on South America - Year-over-year growth 2023-2028 (%)
    • 11.7 Middle East and Africa - Market size and forecast (2023-2028)
      • Chart on Middle East and Africa - Market size and forecast (2023-2028) ($ million)
      • Data Table on Middle East and Africa - Market size and forecast (2023-2028) ($ million)
      • Chart on Middle East and Africa - Year-over-year growth (2023-2028) (%)
      • Data Table on Middle East and Africa - Year-over-year growth (2023-2028) (%)
      • Chart on Middle East and Africa - Market size and forecast 2023-2028 ($ million)
      • Data Table on Middle East and Africa - Market size and forecast 2023-2028 ($ million)
      • Chart on Middle East and Africa - Year-over-year growth 2023-2028 (%)
      • Data Table on Middle East and Africa - Year-over-year growth 2023-2028 (%)
    • 11.8 US - Market size and forecast (2023-2028)
      • Chart on US - Market size and forecast (2023-2028) ($ million)
      • Data Table on US - Market size and forecast (2023-2028) ($ million)
      • Chart on US - Year-over-year growth (2023-2028) (%)
      • Data Table on US - Year-over-year growth (2023-2028) (%)
      • Chart on US - Market size and forecast 2023-2028 ($ million)
      • Data Table on US - Market size and forecast 2023-2028 ($ million)
      • Chart on US - Year-over-year growth 2023-2028 (%)
      • Data Table on US - Year-over-year growth 2023-2028 (%)
    • 11.9 China - Market size and forecast (2023-2028)
      • Chart on China - Market size and forecast (2023-2028) ($ million)
      • Data Table on China - Market size and forecast (2023-2028) ($ million)
      • Chart on China - Year-over-year growth (2023-2028) (%)
      • Data Table on China - Year-over-year growth (2023-2028) (%)
      • Chart on China - Market size and forecast 2023-2028 ($ million)
      • Data Table on China - Market size and forecast 2023-2028 ($ million)
      • Chart on China - Year-over-year growth 2023-2028 (%)
      • Data Table on China - Year-over-year growth 2023-2028 (%)
    • 11.10 Germany - Market size and forecast (2023-2028)
      • Chart on Germany - Market size and forecast (2023-2028) ($ million)
      • Data Table on Germany - Market size and forecast (2023-2028) ($ million)
      • Chart on Germany - Year-over-year growth (2023-2028) (%)
      • Data Table on Germany - Year-over-year growth (2023-2028) (%)
      • Chart on Japan - Market size and forecast 2023-2028 ($ million)
      • Data Table on Japan - Market size and forecast 2023-2028 ($ million)
      • Chart on Japan - Year-over-year growth 2023-2028 (%)
      • Data Table on Japan - Year-over-year growth 2023-2028 (%)
    • 11.11 Japan - Market size and forecast (2023-2028)
      • Chart on Japan - Market size and forecast (2023-2028) ($ million)
      • Data Table on Japan - Market size and forecast (2023-2028) ($ million)
      • Chart on Japan - Year-over-year growth (2023-2028) (%)
      • Data Table on Japan - Year-over-year growth (2023-2028) (%)
      • Chart on Germany - Market size and forecast 2023-2028 ($ million)
      • Data Table on Germany - Market size and forecast 2023-2028 ($ million)
      • Chart on Germany - Year-over-year growth 2023-2028 (%)
      • Data Table on Germany - Year-over-year growth 2023-2028 (%)
    • 11.12 UK - Market size and forecast (2023-2028)
      • Chart on UK - Market size and forecast (2023-2028) ($ million)
      • Data Table on UK - Market size and forecast (2023-2028) ($ million)
      • Chart on UK - Year-over-year growth (2023-2028) (%)
      • Data Table on UK - Year-over-year growth (2023-2028) (%)
      • Chart on UK - Market size and forecast 2023-2028 ($ million)
      • Data Table on UK - Market size and forecast 2023-2028 ($ million)
      • Chart on UK - Year-over-year growth 2023-2028 (%)
      • Data Table on UK - Year-over-year growth 2023-2028 (%)
    • 11.13 Australia - Market size and forecast (2023-2028)
      • Chart on Australia - Market size and forecast (2023-2028) ($ million)
      • Data Table on Australia - Market size and forecast (2023-2028) ($ million)
      • Chart on Australia - Year-over-year growth (2023-2028) (%)
      • Data Table on Australia - Year-over-year growth (2023-2028) (%)
      • Market opportunity by geography ($ million)
      • Data Tables on Market opportunity by geography ($ million)
    • 11.14 India - Market size and forecast (2023-2028)
      • Chart on India - Market size and forecast (2023-2028) ($ million)
      • Data Table on India - Market size and forecast (2023-2028) ($ million)
      • Chart on India - Year-over-year growth (2023-2028) (%)
      • Data Table on India - Year-over-year growth (2023-2028) (%)
    • 11.15 France - Market size and forecast (2023-2028)
      • Chart on France - Market size and forecast (2023-2028) ($ million)
      • Data Table on France - Market size and forecast (2023-2028) ($ million)
      • Chart on France - Year-over-year growth (2023-2028) (%)
      • Data Table on France - Year-over-year growth (2023-2028) (%)
    • 11.16 Brazil - Market size and forecast (2023-2028)
      • Chart on Brazil - Market size and forecast (2023-2028) ($ million)
      • Data Table on Brazil - Market size and forecast (2023-2028) ($ million)
      • Chart on Brazil - Year-over-year growth (2023-2028) (%)
      • Data Table on Brazil - Year-over-year growth (2023-2028) (%)
    • 11.17 Canada - Market size and forecast (2023-2028)
      • Chart on Canada - Market size and forecast (2023-2028) ($ million)
      • Data Table on Canada - Market size and forecast (2023-2028) ($ million)
      • Chart on Canada - Year-over-year growth (2023-2028) (%)
      • Data Table on Canada - Year-over-year growth (2023-2028) (%)
    • 11.18 UAE - Market size and forecast (2023-2028)
      • Chart on UAE - Market size and forecast (2023-2028) ($ million)
      • Data Table on UAE - Market size and forecast (2023-2028) ($ million)
      • Chart on UAE - Year-over-year growth (2023-2028) (%)
      • Data Table on UAE - Year-over-year growth (2023-2028) (%)
    • 11.19 Rest of World (ROW) - Market size and forecast (2023-2028)
      • Chart on Rest of World (ROW) - Market size and forecast (2023-2028) ($ million)
      • Data Table on Rest of World (ROW) - Market size and forecast (2023-2028) ($ million)
      • Chart on Rest of World (ROW) - Year-over-year growth (2023-2028) (%)
      • Data Table on Rest of World (ROW) - Year-over-year growth (2023-2028) (%)
    • 11.20 Saudi Arabia - Market size and forecast (2023-2028)
      • Chart on Saudi Arabia - Market size and forecast (2023-2028) ($ million)
      • Data Table on Saudi Arabia - Market size and forecast (2023-2028) ($ million)
      • Chart on Saudi Arabia - Year-over-year growth (2023-2028) (%)
      • Data Table on Saudi Arabia - Year-over-year growth (2023-2028) (%)
    • 11.21 South Korea - Market size and forecast (2023-2028)
      • Chart on South Korea - Market size and forecast (2023-2028) ($ million)
      • Data Table on South Korea - Market size and forecast (2023-2028) ($ million)
      • Chart on South Korea - Year-over-year growth (2023-2028) (%)
      • Data Table on South Korea - Year-over-year growth (2023-2028) (%)
    • 11.22 Mexico - Market size and forecast (2023-2028)
      • Chart on Mexico - Market size and forecast (2023-2028) ($ million)
      • Data Table on Mexico - Market size and forecast (2023-2028) ($ million)
      • Chart on Mexico - Year-over-year growth (2023-2028) (%)
      • Data Table on Mexico - Year-over-year growth (2023-2028) (%)

    12 Drivers, Challenges, and Opportunity/Restraints

    • 12.1 Market drivers
      • 12.2 Market challenges
        • 12.3 Impact of drivers and challenges
          • Impact of drivers and challenges in 2023 and 2028
        • 12.4 Market opportunities/restraints

          13 Competitive Landscape

          • 13.1 Overview
            • 13.2 Competitive Landscape
              • Overview on criticality of inputs and factors of differentiation
            • 13.3 Landscape disruption
              • Overview on factors of disruption
            • 13.4 Industry risks
              • Impact of key risks on business

            14 Competitive Analysis

            • 14.1 Companies profiled
              • Companies covered
            • 14.2 Market positioning of companies
              • Matrix on companies position and classification
            • 14.3 Breville Group Ltd.
              • Breville Group Ltd. - Overview
              • Breville Group Ltd. - Product / Service
              • Breville Group Ltd. - Key offerings
            • 14.4 Electrolux group
              • Electrolux group - Overview
              • Electrolux group - Business segments
              • Electrolux group - Key news
              • Electrolux group - Key offerings
              • Electrolux group - Segment focus
            • 14.5 General Electric Co.
              • General Electric Co. - Overview
              • General Electric Co. - Business segments
              • General Electric Co. - Key news
              • General Electric Co. - Key offerings
              • General Electric Co. - Segment focus
            • 14.6 Haier Smart Home Co. Ltd.
              • Haier Smart Home Co. Ltd. - Overview
              • Haier Smart Home Co. Ltd. - Business segments
              • Haier Smart Home Co. Ltd. - Key news
              • Haier Smart Home Co. Ltd. - Key offerings
              • Haier Smart Home Co. Ltd. - Segment focus
            • 14.7 Hitachi Ltd.
              • Hitachi Ltd. - Overview
              • Hitachi Ltd. - Business segments
              • Hitachi Ltd. - Key news
              • Hitachi Ltd. - Key offerings
              • Hitachi Ltd. - Segment focus
            • 14.8 JS Global Lifestyle Co. Ltd.
              • JS Global Lifestyle Co. Ltd. - Overview
              • JS Global Lifestyle Co. Ltd. - Business segments
              • JS Global Lifestyle Co. Ltd. - Key news
              • JS Global Lifestyle Co. Ltd. - Key offerings
              • JS Global Lifestyle Co. Ltd. - Segment focus
            • 14.9 LG Electronics Inc.
              • LG Electronics Inc. - Overview
              • LG Electronics Inc. - Product / Service
              • LG Electronics Inc. - Key news
              • LG Electronics Inc. - Key offerings
            • 14.10 Maestro Food Co.
              • Maestro Food Co. - Overview
              • Maestro Food Co. - Product / Service
              • Maestro Food Co. - Key offerings
            • 14.11 Panasonic Holdings Corp.
              • Panasonic Holdings Corp. - Overview
              • Panasonic Holdings Corp. - Business segments
              • Panasonic Holdings Corp. - Key news
              • Panasonic Holdings Corp. - Key offerings
              • Panasonic Holdings Corp. - Segment focus
            • 14.12 Robert Bosch GmbH
              • Robert Bosch GmbH - Overview
              • Robert Bosch GmbH - Product / Service
              • Robert Bosch GmbH - Key news
              • Robert Bosch GmbH - Key offerings
            • 14.13 Samsung Electronics Co. Ltd.
              • Samsung Electronics Co. Ltd. - Overview
              • Samsung Electronics Co. Ltd. - Business segments
              • Samsung Electronics Co. Ltd. - Key news
              • Samsung Electronics Co. Ltd. - Key offerings
              • Samsung Electronics Co. Ltd. - Segment focus
            • 14.14 Sharp Corp.
              • Sharp Corp. - Overview
              • Sharp Corp. - Business segments
              • Sharp Corp. - Key news
              • Sharp Corp. - Key offerings
              • Sharp Corp. - Segment focus
            • 14.15 Smeg S.p.a.
              • Smeg S.p.a. - Overview
              • Smeg S.p.a. - Product / Service
              • Smeg S.p.a. - Key offerings
            • 14.16 Weber Stephen Products HK Ltd.
              • Weber Stephen Products HK Ltd. - Overview
              • Weber Stephen Products HK Ltd. - Product / Service
              • Weber Stephen Products HK Ltd. - Key offerings
            • 14.17 Whirlpool Corp.
              • Whirlpool Corp. - Overview
              • Whirlpool Corp. - Business segments
              • Whirlpool Corp. - Key news
              • Whirlpool Corp. - Key offerings
              • Whirlpool Corp. - Segment focus

            15 Appendix

            • 15.1 Scope of the report
              • 15.2 Inclusions and exclusions checklist
                • Inclusions checklist
                • Exclusions checklist
              • 15.3 Currency conversion rates for US$
                • Currency conversion rates for US$
              • 15.4 Research methodology
                • Research methodology
              • 15.5 Data procurement
                • Information sources
              • 15.6 Data validation
                • Data validation
              • 15.7 Validation techniques employed for market sizing
                • Validation techniques employed for market sizing
              • 15.8 Data synthesis
                • Data synthesis
              • 15.9 360 degree market analysis
                • 360 degree market analysis
              • 15.10 List of abbreviations
                • List of abbreviations

              Research Methodology

              Technavio presents a detailed picture of the market by way of study, synthesis, and summation of data from multiple sources. The analysts have presented the various facets of the market with a particular focus on identifying the key industry influencers. The data thus presented is comprehensive, reliable, and the result of extensive research, both primary and secondary.

              INFORMATION SOURCES

              Primary sources

              • Manufacturers and suppliers
              • Channel partners
              • Industry experts
              • Strategic decision makers

              Secondary sources

              • Industry journals and periodicals
              • Government data
              • Financial reports of key industry players
              • Historical data
              • Press releases

              DATA ANALYSIS

              Data Synthesis

              • Collation of data
              • Estimation of key figures
              • Analysis of derived insights

              Data Validation

              • Triangulation with data models
              • Reference against proprietary databases
              • Corroboration with industry experts

              REPORT WRITING

              Qualitative

              • Market drivers
              • Market challenges
              • Market trends
              • Five forces analysis

              Quantitative

              • Market size and forecast
              • Market segmentation
              • Geographical insights
              • Competitive landscape

              Interested in this report?

              Get your sample now to see our research methodology and insights!

              Download Now

              Frequently Asked Questions

              Smart Ovens market growth will increase by $ 519.8 mn during 2024-2028.

              The Smart Ovens market is expected to grow at a CAGR of 20.65% during 2024-2028.

              Smart Ovens market is segmented by Distribution Channel( Offline, Online) Product( Smart microwave oven, Small wall oven)

              Alto Shaam Inc., Brandt Group, Breville Group Ltd., Electrolux group, General Electric Co., GoWISE USA, Haier Smart Home Co. Ltd., Hitachi Ltd., JS Global Lifestyle Co. Ltd., LG Electronics Inc., Maestro Food Co., MIDEA Group Co. Ltd., Miele and Cie. KG, Panasonic Holdings Corp., Robert Bosch GmbH, Samsung Electronics Co. Ltd., Sharp Corp., Smeg S.p.a., Weber Stephen Products HK Ltd., Whirlpool Corp. are a few of the key vendors in the Smart Ovens market.

              North America will register the highest growth rate of 40% among the other regions. Therefore, the Smart Ovens market in North America is expected to garner significant business opportunities for the vendors during the forecast period.

              US, China, Germany, Japan, UK, Australia, India, France, Brazil, Canada, Brazil, UAE, Australia, Rest of World (ROW), Saudi Arabia, France, South Korea, Mexico

              • Changing lifestyles in developed and developing economiesIn the global smart oven market is the driving factor this market.
              • products usually fall into the premium category. This is attributed to the innovation and technology implemented in cooking appliances. Smart technologies are widely used in industrialized countries due to the accessibility of high-speed Internet and improved communications services is the driving factor this market.
              • which have increased the demand for smart home equipment. Consumer expenditure is strong in emerging markets such as China and India is the driving factor this market.
              • where the goal is to raise the standard of living. With the rise in smartphone penetration is the driving factor this market.
              • consumers in these nations are embracing new lifestyles and progressively moving toward smart technologies is the driving factor this market.
              • such as smart ovens. According to the World Bank is the driving factor this market.
              • in 2023 is the driving factor this market.
              • emerging countries accounted for more than 80% of middle-class people. The increase in urbanization is the driving factor this market.
              • availability of goods is the driving factor this market.
              • increase in real income is the driving factor this market.
              • sense of having comfort is the driving factor this market.
              • and tendency to spend on expensive but worthy products has been observed in customer behavior. Vendors are also drawing consumer interest by adding value to their products and expanding their product portfolio. Such factors will drive the growth of the global smart oven market during the forecast period. is the driving factor this market.

              The Smart Ovens market vendors should focus on grabbing business opportunities from the Offline segment as it accounted for the largest market share in the base year.