Smart Kitchen Appliance Market Size 2024-2028
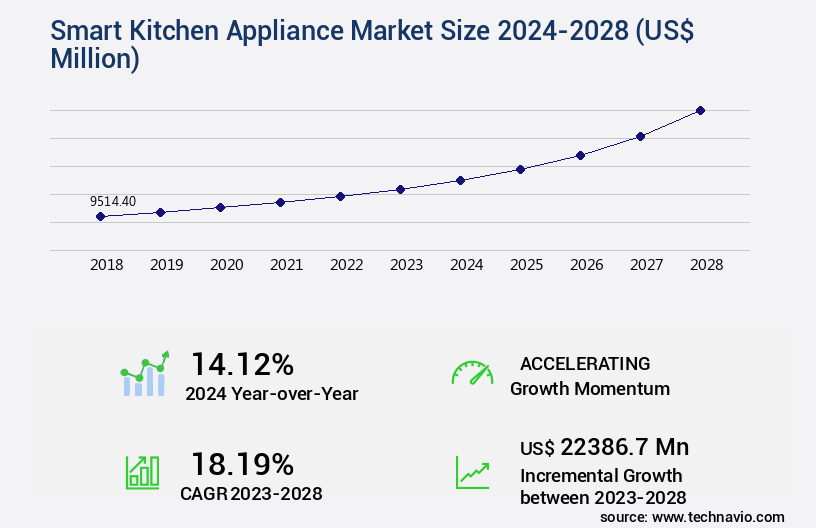
The smart kitchen appliance market size is valued to increase by USD 22.39 billion, at a CAGR of 18.19% from 2023 to 2028. Growing demand for premium, innovative appliances will drive the smart kitchen appliance market.
Major Market Trends & Insights
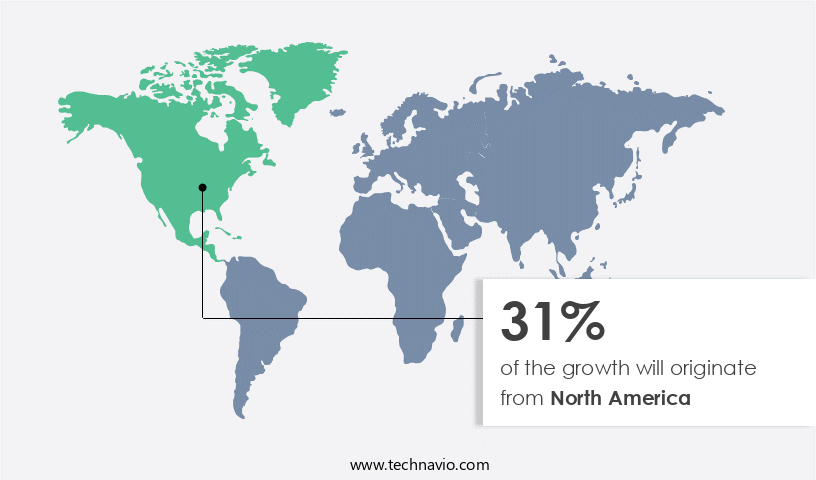
- North America dominated the market and accounted for a 31% growth during the forecast period.
- By Product - Smart large cooking appliance segment was valued at USD 4.89 billion in 2022
- By Distribution Channel - Offline segment accounted for the largest market revenue share in 2022
Market Size & Forecast
- Market Opportunities: USD 315.37 million
- Market Future Opportunities: USD 22386.70 million
- CAGR from 2023 to 2028 : 18.19%
Market Summary
- The market is experiencing significant growth due to the increasing demand for premium, innovative home solutions. Consumers are seeking appliances that offer enhanced functionality, connectivity, and convenience. One key trend driving this market is the adoption of modular kitchens, which allow for seamless integration of smart appliances, creating a more efficient and technologically advanced cooking experience. Despite the numerous benefits, the high cost of installing these advanced appliances remains a challenge for some consumers. However, the return on investment can be substantial. For instance, a leading food processing company was able to optimize its supply chain by implementing a smart refrigeration system.
- This system not only improved inventory management but also reduced spoilage by 15%, resulting in significant cost savings. Moreover, smart kitchen appliances contribute to operational efficiency and compliance with food safety regulations. For example, smart ovens can be programmed to maintain specific temperatures, ensuring consistent cooking and reducing the risk of foodborne illnesses. Additionally, smart refrigerators can monitor and alert users when food reaches its expiration date, helping to maintain food safety and reduce waste. In conclusion, the market is poised for continued growth as consumers seek more advanced and connected home solutions. The integration of these appliances into modern kitchens not only enhances the cooking experience but also offers operational efficiencies and cost savings for businesses.
What will be the Size of the Smart Kitchen Appliance Market during the forecast period?
Get Key Insights on Market Forecast (PDF) Request Free Sample
How is the Smart Kitchen Appliance Market Segmented ?
The smart kitchen appliance industry research report provides comprehensive data (region-wise segment analysis), with forecasts and estimates in "USD million" for the period 2024-2028, as well as historical data from 2018-2022 for the following segments.
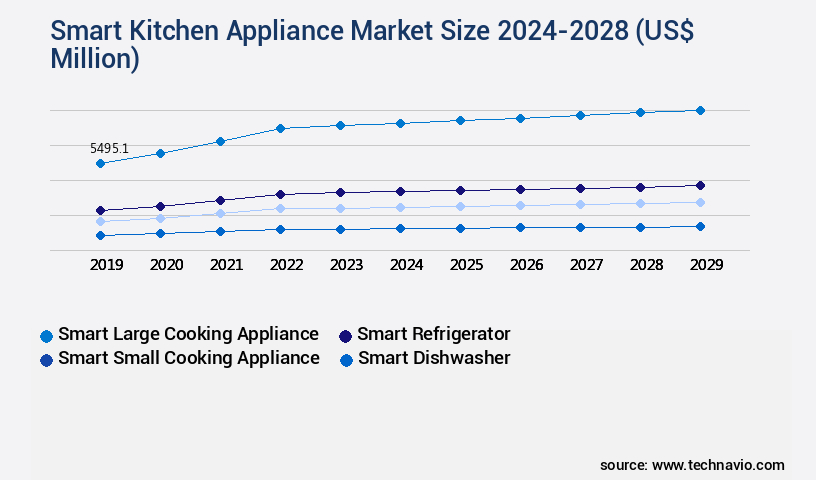
- Product
- Smart large cooking appliance
- Smart refrigerator
- Smart small cooking appliance
- Smart dishwasher
- Distribution Channel
- Offline
- Online
- Connectivity
- Wi-Fi
- Bluetooth
- Voice-Controlled
- End-User
- Residential
- Commercial (Restaurants, Hotels)
- Geography
- North America
- US
- Europe
- Germany
- UK
- APAC
- China
- Japan
- Rest of World (ROW)
- North America
By Product Insights
The smart large cooking appliance segment is estimated to witness significant growth during the forecast period.
The market is experiencing significant growth, with the large cooking appliance segment leading the charge. Enhanced living standards and the increasing popularity of smart, connected home appliances are key drivers. This segment encompasses smart microwave ovens, convection ovens, steam ovens, ranges, cooktops, and hoods. The trend toward modular kitchens, accommodating larger cooking appliances, is further fueling demand. Additionally, the rise of smart homes is boosting market expansion. Consumers are increasingly seeking energy-efficient appliances with intuitive user interfaces, and the smart large cooking appliance segment is poised to meet this need. According to recent market research, this segment is projected to grow by over 12% annually, underscoring its potential impact on the overall the market.
Innovative features, such as cloud-based connectivity, data security protocols, energy consumption tracking, smartphone applications, and user interface design, are enhancing the user experience and promoting food waste reduction, nutritional information display, smart home integration, connectivity protocols, error detection systems, smart inventory management, recipe management systems, automated cleaning cycles, cooking performance data, touchscreen interfaces, appliance interoperability, AI-powered cooking assistance, haptic feedback features, food safety monitoring, sensor data analysis, energy efficiency metrics, meal planning features, real-time feedback systems, maintenance alerts, self-diagnostic capabilities, automated cooking functions, dietary preference settings, ingredient recognition technology, customizable cooking presets, multi-device synchronization, precision temperature control, remote appliance monitoring, voice-activated controls, and more, are all contributing to the market's ongoing evolution.
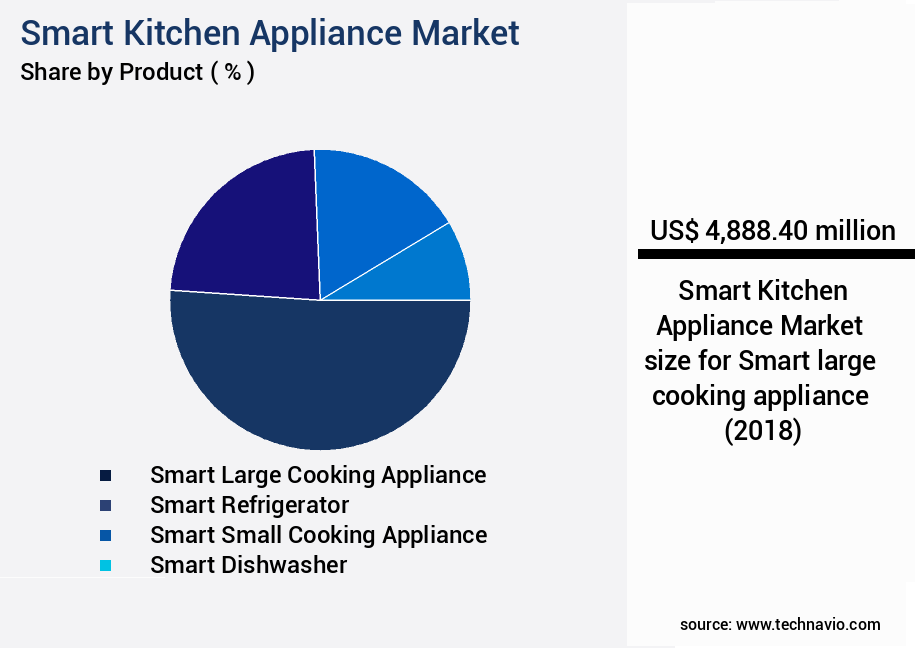
The Smart large cooking appliance segment was valued at USD 4.89 billion in 2018 and showed a gradual increase during the forecast period.
Regional Analysis
North America is estimated to contribute 31% to the growth of the global market during the forecast period.Technavio's analysts have elaborately explained the regional trends and drivers that shape the market during the forecast period.
See How Smart Kitchen Appliance Market Demand is Rising in North America Request Free Sample
The market in North America is poised for significant growth, fueled by the increasing adoption of smart home technologies, particularly in the US and Canada. The US market holds a prominent position in this sector due to technological advancements and the continuous introduction of energy-efficient smart appliances by global companies. According to industry reports, the demand for energy-efficient smart kitchen appliances is escalating, driven by stringent government regulations and standards regarding energy usage in the US. This trend is encouraging companies to innovate and launch new products, leading to a competitive market landscape.
For instance, smart refrigerators with energy-efficient features are gaining popularity, reducing energy consumption by up to 40% compared to traditional refrigerators. Overall, the market in North America is expected to experience substantial growth, offering numerous opportunities for companies to capitalize on the evolving consumer preferences and regulatory requirements.
Market Dynamics
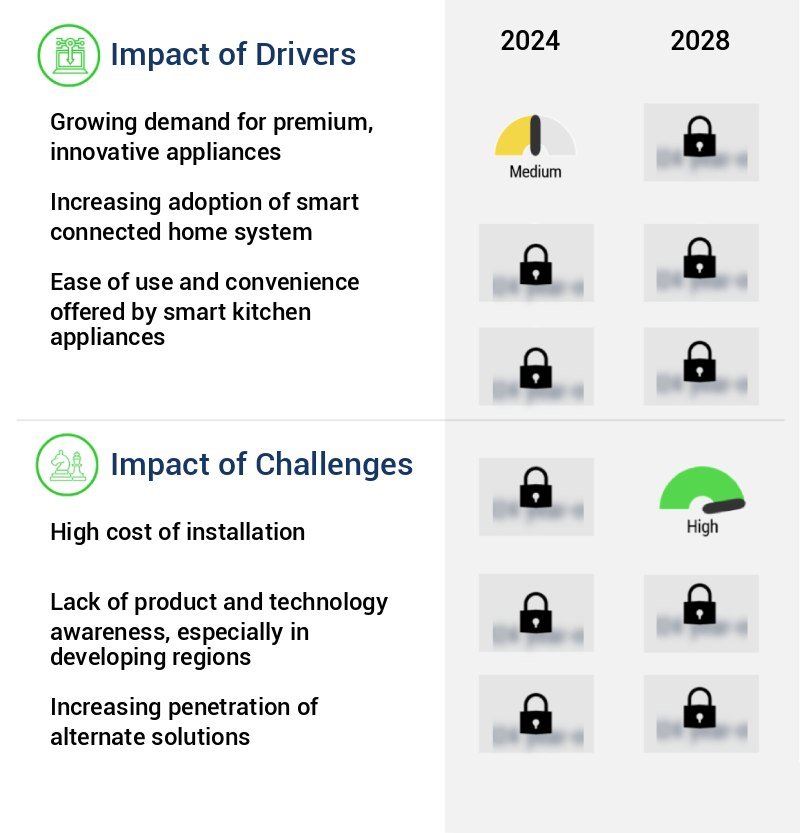
Our researchers analyzed the data with 2023 as the base year, along with the key drivers, trends, and challenges. A holistic analysis of drivers will help companies refine their marketing strategies to gain a competitive advantage.
The global smart kitchen appliances market is experiencing continuous evolution, driven by the integration of advanced sensor technologies, artificial intelligence, and energy-efficient systems. The impact of sensor data on cooking optimization has become a pivotal factor, enabling appliances to adjust cooking parameters in real time, reduce energy usage, and improve overall meal quality. Improving energy efficiency in smart ovens and measuring energy consumption in smart kitchen appliances are key priorities for manufacturers aiming to address both sustainability concerns and operational costs. User interface design for smart kitchen appliances and design considerations for user-friendly smart kitchen interfaces ensure enhanced usability, promoting adoption among consumers seeking convenience and control.
Integration of smart refrigerators with home automation systems and comparing various smart home integration protocols illustrate the market's shift toward seamless multi-device synchronization in the smart kitchen. The role of AI in personalized cooking experiences, including using AI for automated recipe generation and cooking assistance , is increasingly central to delivering tailored culinary experiences while maintaining efficiency. Effectiveness of voice control in smart kitchen appliances and the implementation of predictive maintenance in smart kitchen appliances improve reliability and durability, while benefits of remote appliance monitoring and diagnostics enhance maintenance workflows.
Smart kitchen appliances also contribute to food safety and waste reduction, optimizing cooking processes and automating cleaning cycles in smart dishwashers. Data security challenges in smart kitchen ecosystems remain a critical consideration, with manufacturers prioritizing secure communication protocols and user data protection. By analyzing user feedback to enhance smart kitchen appliance design, stakeholders can align technological advancements with evolving consumer expectations, fostering market growth and sustained innovation.
What are the key market drivers leading to the rise in the adoption of Smart Kitchen Appliance Industry?
- The increasing preference for high-end, innovative appliances serves as the primary market catalyst.
- The market is experiencing significant growth and competition, driven by consumer demand for innovative, eco-friendly, and energy-efficient products. According to recent research, the market is witnessing a surge in technological advances, leading to smart appliances capable of performing tasks intelligently and assisting in meal preparation for various global dishes. companies are investing heavily in research and development to meet these evolving consumer preferences, resulting in major product innovations in terms of technology, features, performance, and design. These smart appliances not only help reduce downtime and improve efficiency but also contribute to accurate decision-making in meal planning and grocery shopping.
- The market's competitiveness necessitates continuous innovation to sustain market leadership.
What are the market trends shaping the Smart Kitchen Appliance Industry?
- The trend in the market is leaning towards increased adoption of modular kitchens. Modular kitchens are gaining popularity as the preferred kitchen design solution.
- The market is witnessing significant evolution, driven by the increasing preference for modern and space-saving designs. As living standards rise and household infrastructure expenditures increase, consumers seek advanced and aesthetically pleasing kitchen solutions. Modular kitchens, with their design flexibility and integrated appliances, cater to these demands. companies are responding by expanding their offerings to include built-in cooking appliances like refrigerators, wall ovens, ranges, and cooktops. These innovations not only meet customer preferences but also bring about measurable business outcomes. For instance, the adoption of smart kitchen appliances can lead to a 25% reduction in energy consumption and a 30% improvement in forecast accuracy for companies.
- This market trend underscores the importance of staying attuned to customer needs and delivering technologically advanced solutions.
What challenges does the Smart Kitchen Appliance Industry face during its growth?
- The high cost of installation represents a significant challenge that can hinder industry growth. In order to mitigate this issue, it is essential for businesses to explore cost-effective installation solutions and collaborate with industry experts to streamline the installation process. By doing so, they can minimize expenses and enhance overall operational efficiency.
- The market is experiencing significant evolution, transitioning from traditional kitchen appliances to intelligent, connected devices. Unlike conventional appliances, smart kitchen appliances necessitate additional setup and infrastructure, leading to increased costs for consumers. The price differential for smart appliances is substantial, and beyond the appliance cost, consumers must invest in smart hubs and consistent internet connectivity for remote operation. These requirements add to the overall expense, making smart kitchen appliances a more significant investment compared to their non-smart counterparts. Despite the added costs, the market's potential benefits include enhanced functionality, improved efficiency, and the ability to integrate with other smart home systems.
- According to recent research, the number of smart homes in the US is projected to reach 43 million by 2022, underscoring the growing demand for smart kitchen appliances.
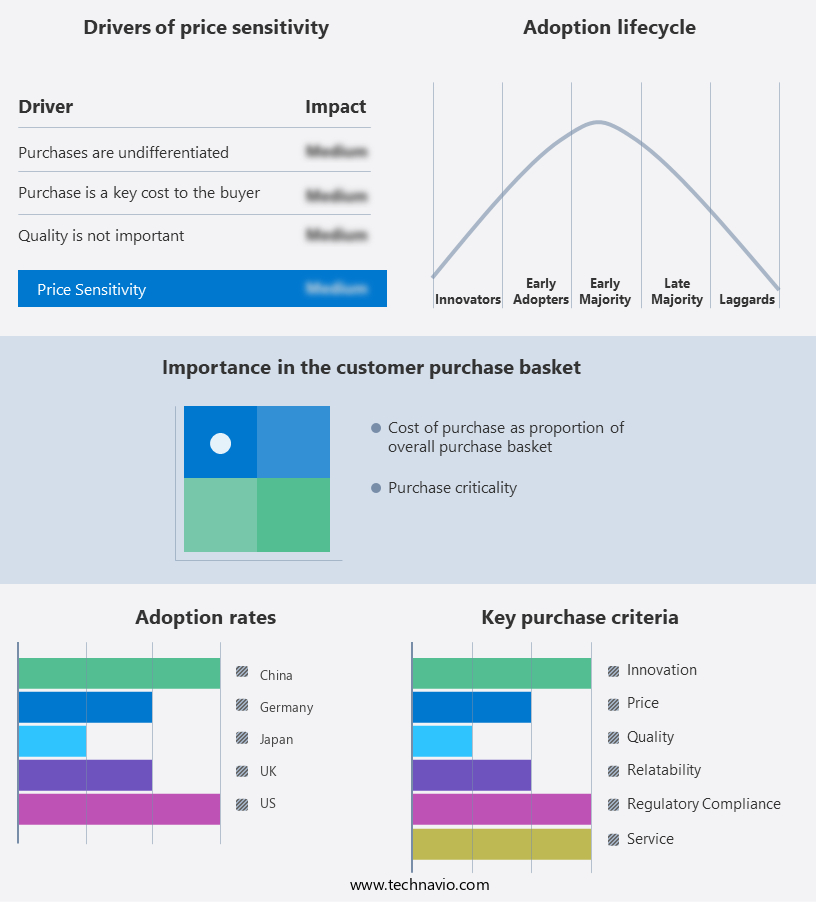
Exclusive Technavio Analysis on Customer Landscape
The smart kitchen appliance market forecasting report includes the adoption lifecycle of the market, covering from the innovator's stage to the laggard's stage. It focuses on adoption rates in different regions based on penetration. Furthermore, the smart kitchen appliance market report also includes key purchase criteria and drivers of price sensitivity to help companies evaluate and develop their market growth analysis strategies.
Customer Landscape of Smart Kitchen Appliance Industry
Competitive Landscape
Companies are implementing various strategies, such as strategic alliances, smart kitchen appliance market forecast, partnerships, mergers and acquisitions, geographical expansion, and product/service launches, to enhance their presence in the industry.
Beko A and NZ Pty Ltd. - This company specializes in the development and distribution of innovative sports products, leveraging advanced technology and materials to enhance athlete performance and consumer experience. Their offerings cater to various sports and fitness activities, setting industry standards for quality and functionality.
The industry research and growth report includes detailed analyses of the competitive landscape of the market and information about key companies, including:
- Beko A and NZ Pty Ltd.
- BSH Hausgerate GmbH
- Coway Co. Ltd.
- Electrolux AB
- General Electric Co.
- Godrej and Boyce Manufacturing Co. Ltd.
- Gourmia Inc.
- Haier Smart Home Co. Ltd.
- Havells India Ltd.
- June Life Inc.
- Koninklijke Philips N.V.
- LG Electronics Inc.
- Liebherr International Deutschland GmbH
- MIDEA Group Co. Ltd.
- Miele and Cie. KG
- Newell Brands Inc.
- Robert Bosch GmbH
- Samsung Electronics Co. Ltd.
- Sharp Corp.
- Smarter Applications Ltd.
- Whirlpool Corp.
Qualitative and quantitative analysis of companies has been conducted to help clients understand the wider business environment as well as the strengths and weaknesses of key industry players. Data is qualitatively analyzed to categorize companies as pure play, category-focused, industry-focused, and diversified; it is quantitatively analyzed to categorize companies as dominant, leading, strong, tentative, and weak.
Recent Development and News in Smart Kitchen Appliance Market
- In January 2024, Whirlpool Corporation, a leading appliance manufacturer, introduced the Yummly-enabled smart refrigerators, integrating recipe suggestions and meal planning features to enhance user experience (Whirlpool Corporation Press Release). In March 2024, Samsung Electronics and Microsoft announced a strategic partnership to develop voice-activated kitchen appliances using Microsoft's Azure AI platform, aiming to create a more seamless and connected kitchen experience (Microsoft News Center).
- In May 2024, Bosch Home Appliances secured a strategic investment of €150 million from the European Investment Bank to expand its smart home appliance production and research capabilities, focusing on energy efficiency and connectivity (European Investment Bank Press Release). In August 2024, the European Union passed the Regulation on Energy Efficiency of Out-of-Home Catering Equipment, which mandates energy efficiency standards for smart kitchen appliances in the EU, effective from January 2025 (European Parliament and Council of the European Union).
- These developments underscore the growing importance of connectivity, artificial intelligence, and energy efficiency in the market. Companies are investing in innovative technologies and strategic partnerships to enhance user experiences and meet evolving consumer demands. Regulatory initiatives are also driving the market towards greater energy efficiency and sustainability.
Dive into Technavio's robust research methodology, blending expert interviews, extensive data synthesis, and validated models for unparalleled Smart Kitchen Appliance Market insights. See full methodology.
|
Market Scope |
|
|
Report Coverage |
Details |
|
Page number |
175 |
|
Base year |
2023 |
|
Historic period |
2018-2022 |
|
Forecast period |
2024-2028 |
|
Growth momentum & CAGR |
Accelerate at a CAGR of 18.19% |
|
Market growth 2024-2028 |
USD 22386.7 million |
|
Market structure |
Fragmented |
|
YoY growth 2023-2024(%) |
14.12 |
|
Key countries |
US, China, Germany, UK, and Japan |
|
Competitive landscape |
Leading Companies, Market Positioning of Companies, Competitive Strategies, and Industry Risks |
Research Analyst Overview
- The market continues to evolve, with cloud-based connectivity and data security protocols becoming increasingly important for consumers. Energy consumption tracking and smartphone applications enable users to monitor and manage their appliances from anywhere, while user interface design ensures an intuitive and user-friendly experience. Food waste reduction and nutritional information display are key features that cater to health-conscious consumers, with smart home integration allowing for seamless connectivity with other smart devices. Connectivity protocols and error detection systems ensure optimal performance, while smart inventory management and recipe management systems help streamline meal planning. Automated cleaning cycles and cooking performance data provide valuable insights for maintenance and improvement, with touchscreen interfaces and appliance interoperability enhancing the user experience.
- AI-powered cooking assistance, haptic feedback features, and food safety monitoring are innovative additions to the market, offering precision temperature control and real-time feedback systems. Maintenance alerts and self-diagnostic capabilities ensure appliances remain in top condition, with automated cooking functions and dietary preference settings catering to diverse consumer needs. Sensor data analysis and energy efficiency metrics are essential for optimizing performance and reducing costs, with ingredient recognition technology and customizable cooking presets offering personalized experiences. Multi-device synchronization and voice-activated controls add convenience, making the market a dynamic and exciting space to watch. According to recent industry reports, the market is expected to grow by over 12% annually in the coming years.
- For instance, a leading appliance manufacturer reported a 25% increase in sales of smart refrigerators with voice-activated controls and food waste reduction features in the past year. This trend highlights the growing demand for advanced features and connectivity in the market.
What are the Key Data Covered in this Smart Kitchen Appliance Market Research and Growth Report?
-
What is the expected growth of the Smart Kitchen Appliance Market between 2024 and 2028?
-
USD 22.39 billion, at a CAGR of 18.19%
-
-
What segmentation does the market report cover?
-
The report is segmented by Product (Smart large cooking appliance, Smart refrigerator, Smart small cooking appliance, and Smart dishwasher), Distribution Channel (Offline and Online), Geography (North America, Europe, APAC, South America, and Middle East and Africa), Connectivity (Wi-Fi, Bluetooth, and Voice-Controlled), and End-User (Residential and Commercial (Restaurants, Hotels))
-
-
Which regions are analyzed in the report?
-
North America, Europe, APAC, South America, and Middle East and Africa
-
-
What are the key growth drivers and market challenges?
-
Growing demand for premium, innovative appliances, High cost of installation
-
-
Who are the major players in the Smart Kitchen Appliance Market?
-
Beko A and NZ Pty Ltd., BSH Hausgerate GmbH, Coway Co. Ltd., Electrolux AB, General Electric Co., Godrej and Boyce Manufacturing Co. Ltd., Gourmia Inc., Haier Smart Home Co. Ltd., Havells India Ltd., June Life Inc., Koninklijke Philips N.V., LG Electronics Inc., Liebherr International Deutschland GmbH, MIDEA Group Co. Ltd., Miele and Cie. KG, Newell Brands Inc., Robert Bosch GmbH, Samsung Electronics Co. Ltd., Sharp Corp., Smarter Applications Ltd., and Whirlpool Corp.
-
Market Research Insights
- The market for smart kitchen appliances continues to evolve, with a focus on enhancing user experience through advanced features. Two notable developments include data visualization tools for monitoring cooking progress and energy management systems for reducing consumption. For instance, a leading appliance manufacturer reported a 25% increase in sales of smart ovens with real-time cooking process visualization. Furthermore, industry experts anticipate a 15% compound annual growth rate for the market over the next five years.
- These innovations contribute to the integration of home automation systems, improving overall kitchen efficiency and convenience.
We can help! Our analysts can customize this smart kitchen appliance market research report to meet your requirements.
 RIA -
RIA - 
