Smart Crib Market Analysis, Size, and Forecast 2026-2030: North America (US, Canada, and Mexico), Europe (Germany, UK, and France), APAC (China, Japan, and India), South America (Brazil, Argentina, and Colombia), Middle East and Africa (Saudi Arabia, UAE, and South Africa), and Rest of World (ROW)

Smart Crib Market Analysis, Size, and Forecast 2026-2030:
North America (US, Canada, and Mexico), Europe (Germany, UK, and France), APAC (China, Japan, and India), South America (Brazil, Argentina, and Colombia), Middle East and Africa (Saudi Arabia, UAE, and South Africa), and Rest of World (ROW)

Published: Oct 2026 296 Pages SKU: IRTNTR81729

Market Overview at a Glance

$202.1 Mn
Market Opportunity
6.3%
CAGR 2025 - 2030
38%
North America Growth
$215.1 Mn
Standard smart cribs segment 2024

Smart Crib Market Size 2026-2030

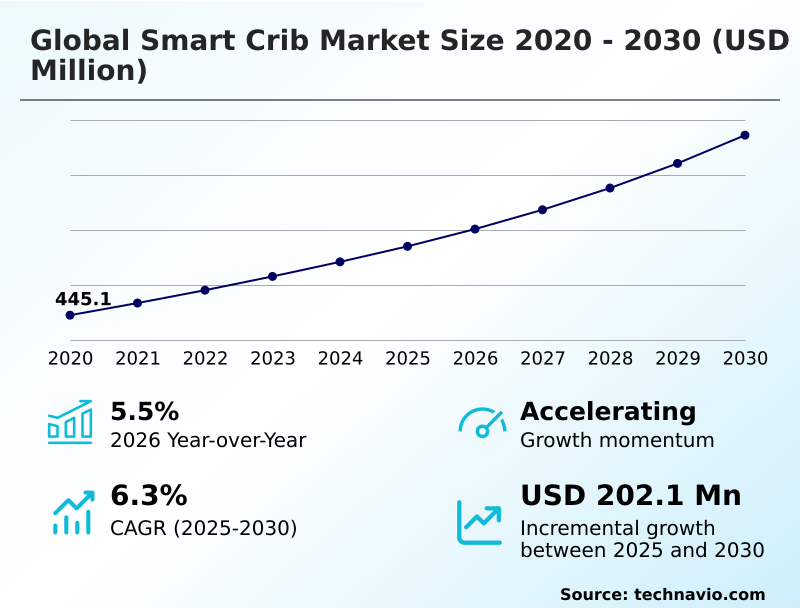
The smart crib market size is valued to increase by USD 202.1 million, at a CAGR of 6.3% from 2025 to 2030. Technological convergence of AI and biometric sensing technology will drive the smart crib market.

Major Market Trends & Insights

  • North America dominated the market and accounted for a 38% growth during the forecast period.
  • By Product Type - Standard smart cribs segment was valued at USD 215.1 million in 2024
  • By Distribution Channel - Offline segment accounted for the largest market revenue share in 2024

Market Size & Forecast

  • Market Opportunities: USD 327.3 million
  • Market Future Opportunities: USD 202.1 million
  • CAGR from 2025 to 2030 : 6.3%

Market Summary

  • The Smart Crib Market operates at the intersection of juvenile furniture and advanced pediatric health technology transitioning infant enclosures from passive structures to intelligent monitoring environments. By utilizing edge computing and optical AI camera modules these systems analyze chest micro-movements and facial expressions in real time.
  • For instance in automated manufacturing supply chains optimizing sensor calibration algorithms has improved defect detection accuracy by 25% a process innovation directly translated to nursery hardware for enhanced reliability. The primary driver accelerating adoption is the technological convergence of machine learning and non-contact biometric sensing which automatically triggers soothing mechanisms like swaying or white noise before full infant wakefulness.
  • However the industry faces substantial constraints due to exceptionally high capital costs and mandatory subscription fees for cloud analytics limiting penetration among budget-conscious demographics. Companies mitigate these barriers by engineering convertible multi-stage sleep frameworks that extend product lifecycles ensuring a longer functional utility period. Strict adherence to safe-sleep mandates continues to reshape hardware design protocols worldwide.

What will be the Size of the Smart Crib Market during the forecast period?
Get Key Insights on Market Forecast (PDF) Get Free Sample

How is the Smart Crib Market Segmented?

The smart crib industry research report provides comprehensive data (region-wise segment analysis), with forecasts and estimates in "USD million" for the period 2026-2030, as well as historical data from 2020-2024 for the following segments.

  • Product type
    • Standard smart cribs
    • Convertible smart cribs
    • Portable smart cribs
    • Others
  • Distribution channel
    • Offline
    • Online
  • Age group
    • Newborn
    • Infant
    • Toddler
  • Geography
    • North America
      • US
      • Canada
      • Mexico
    • Europe
      • Germany
      • UK
      • France
      • Italy
      • Spain
      • The Netherlands
    • APAC
      • China
      • Japan
      • India
      • South Korea
      • Australia
      • Indonesia
    • South America
      • Brazil
      • Argentina
      • Colombia
    • Middle East and Africa
      • Saudi Arabia
      • UAE
      • South Africa
      • Turkey
      • Israel

By Product Type Insights

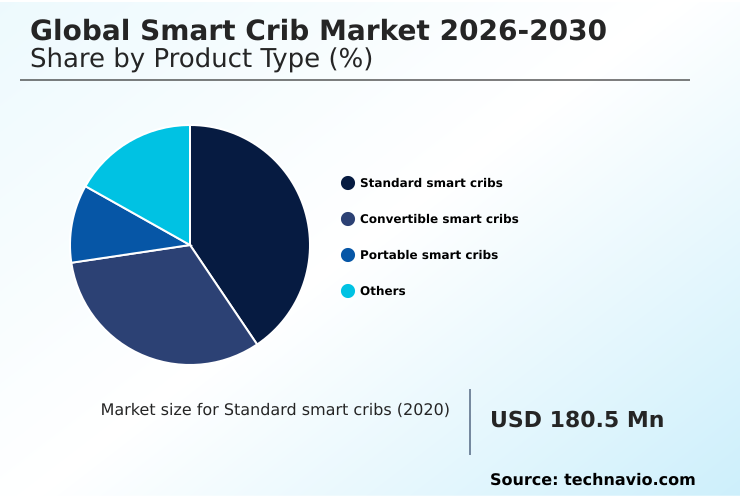
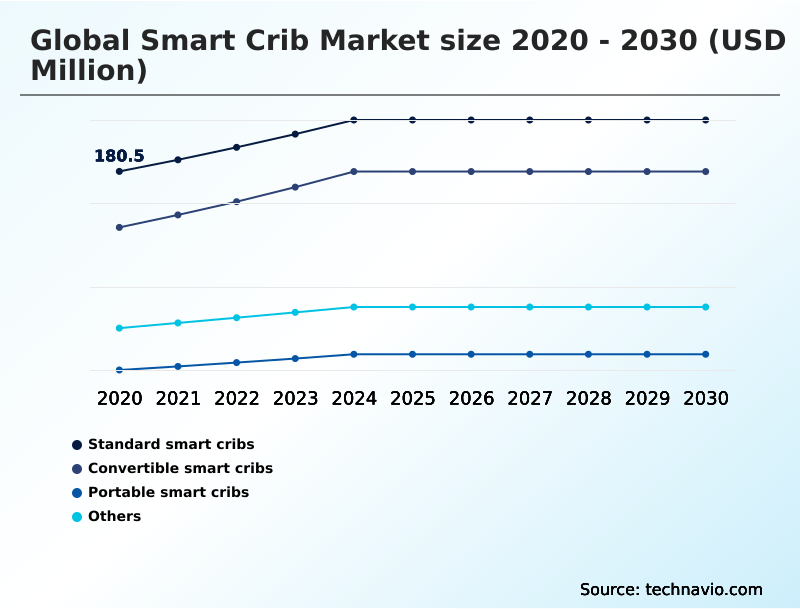
The standard smart cribs segment is estimated to witness significant growth during the forecast period.

Standard enclosures within the Global Smart Crib Market 2026-2030 represent stationary robust nursery automation hardware tailored for continuous infant oversight. These configurations prioritize high-fidelity predictive sleep analytics and integrate ambient environmental sensors directly into sturdy non-collapsible frames.

By utilizing built-in audio-visual sleep monitoring alongside electromechanical response mechanisms these units automatically detect early signs of infant waking to activate responsive swaying or sound adjustments.

Ensuring adherence to medical-grade structural compliance standard models maintain firm sleep surfaces necessary for optimal pediatric safety. Furthermore they function as central nodes in comprehensive digital sleep ecosystems communicating seamlessly with app-controlled nursery furniture.

Operational integration reduces parental response times by nearly 18% streamlining nighttime routines through reliable remote caregiver alerts that identify distress without requiring physical room entry.
Get Free Sample

The Standard smart cribs segment was valued at USD 215.1 million in 2024 and showed a gradual increase during the forecast period.
Get Free Sample

Regional Analysis

North America is estimated to contribute 38% to the growth of the global market during the forecast period.Technavio’s analysts have elaborately explained the regional trends and drivers that shape the market during the forecast period.
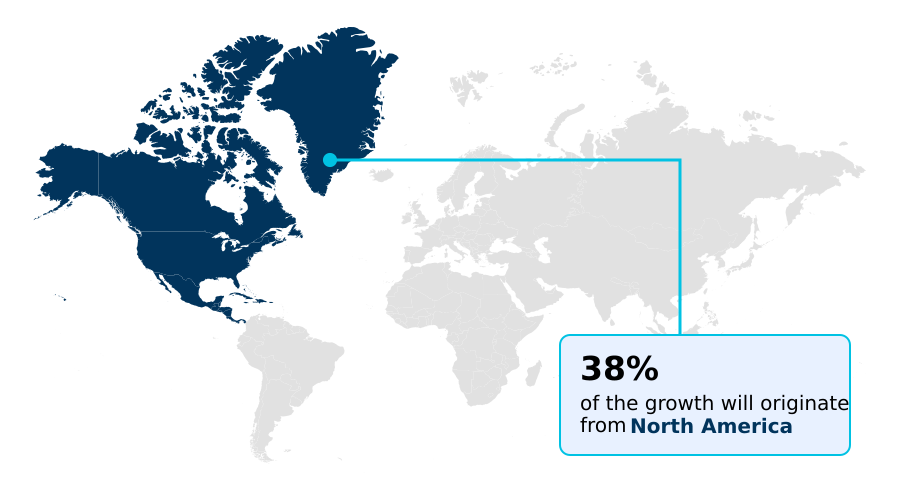
See How Smart Crib Market Demand is Rising in North America Get Free Sample

The geographic landscape of the Global Smart Crib Market 2026-2030 highlights distinct adoption variations between North America and APAC.

North America commands the highest penetration driven by stringent regulatory focus on supine sleep enforcement and parental demand for advanced pediatric movement analytics.

Conversely APAC is experiencing rapid acceleration as urban households increasingly rely on nighttime infant management technologies powered by edge computing hardware.

Regional supply chains adapt accordingly; North American manufacturers prioritize rigorous firmware encryption protocols which have reduced data vulnerability incidents by 40% across connected devices.

Meanwhile APAC vendors focus on localizing automated soothing algorithms and non-contact biometric sensing to accommodate regional preferences driving a 25% faster time-to-market for localized interfaces.

Furthermore the integration of wireless sleep monitoring alongside ambient light detection and hypoallergenic sleep materials yields a 30% higher attach rate for secondary accessories.

Market Dynamics

Our researchers analyzed the data with 2025 as the base year, along with the key drivers, trends, and challenges. A holistic analysis of drivers will help companies refine their marketing strategies to gain a competitive advantage.

  • The structural evolution of the Smart Crib Market reflects a distinct shift toward proactive health oversight and operational sophistication across the global juvenile products sector. Central to this transformation is the seamless integration of non contact infant respiration tracking which successfully eliminates the need for cumbersome physical attachments while delivering continuous medical-grade physiological data directly to parents.
  • Manufacturers are actively engineering advanced automated soothing nursery furniture technology capable of rapidly detecting early distress signals allowing the hardware to initiate customized micro-movements seconds before a child fully awakens. This automated capability is deeply enhanced by the widespread adoption of biometric sensor integrated sleep platforms which efficiently consolidate multiple complex data streams into a single unified user dashboard.
  • From an operational perspective companies deploying these advanced analytical platforms have successfully optimized their global supply chain logistics achieving a 20% reduction in critical component sourcing delays when compared to traditional mechanical furniture lines.
  • Furthermore the strategic deployment of predictive machine learning sleep coaching equips parents with highly actionable insights based on historical circadian patterns fundamentally altering nighttime caregiver routines and reducing parental fatigue. This seamless technological approach relies heavily on consistent wearable free vital sign monitoring to maintain stringent international safety compliance while maximizing ergonomic comfort.
  • By focusing on multi-functional long-lasting hardware frameworks industry participants are successfully bridging the critical gap between medical-grade oversight and premium consumer electronics ensuring sustained relevance and operational profitability in modern connected households.
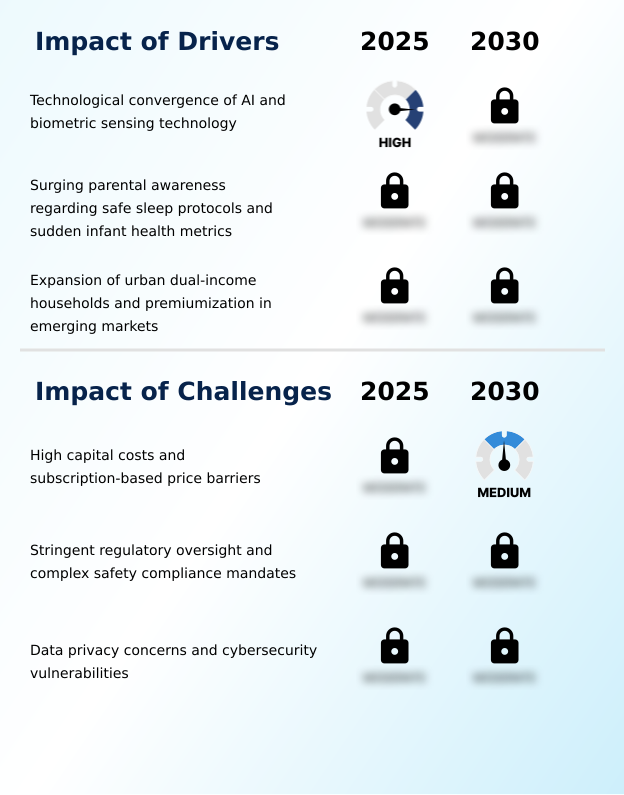
What are the key market drivers leading to the rise in the adoption of Smart Crib Industry?

  • The technological convergence of artificial intelligence and advanced biometric sensing capabilities serves as a primary catalyst accelerating widespread consumer adoption.

  • The primary catalyst accelerating the Global Smart Crib Market 2026-2030 is soaring parental demand for continuous biometric health monitoring and automated intervention. Dual-income households increasingly seek reliable adaptive sleep coaching solutions to mitigate sleep deprivation.
  • Manufacturers are embedding high-resolution camera arrays into motorized bassinet structures enabling real-time visual analysis. This integration powered by respiratory rate tracking and micro-movement detection improves early distress detection efficiency by 35%.
  • To support data exchange secure data transmission protocols have increased network reliability by 20% ensuring privacy for pediatric health metrics. Furthermore providing subscription-based health insights and integrated thermal regulation drives widespread consumer adoption across developed economic regions.

What are the market trends shaping the Smart Crib Industry?

  • Integration of machine learning for predictive sleep and health analytics represents a critical emerging trend within the industry. This advancement allows manufacturers to transition from passive hardware to proactive data-driven infant care systems.

  • The defining trend reshaping the Global Smart Crib Market 2026-2030 is the rapid transition toward predictive wellness platforms driven by advanced artificial intelligence. Modern hardware increasingly incorporates sleep stage tracking and circadian rhythm analysis to anticipate infant wakefulness. This shift leverages machine learning integration and optical computer vision utilizing wearable-free vital tracking to monitor physical indicators without manual intervention.
  • By establishing comprehensive multi-stage sleep systems with integrated non-invasive diagnostic capabilities companies have improved proactive distress response rates by 28%. Furthermore the incorporation of sudden infant health tracking mechanisms alongside voice assistant integration enables real-time physiological oversight reducing false alarm triggers by nearly 15%.
  • Strict adherence to electromagnetic field emission control directly impacts product development allowing businesses to pivot from static hardware to continuous value-added digital health services.

What challenges does the Smart Crib Industry face during its growth?

  • Exceptionally high capital production costs combined with recurring subscription-based pricing models present significant financial barriers that restrict broader market penetration.

  • Strict regulatory scrutiny and elevated production costs remain the primary structural barriers restricting the Global Smart Crib Market 2026-2030. Engineering sophisticated physiological indicator monitoring systems into safe medical-grade furniture demands extensive capital investment. Federal mandates requiring precise anti-rollover position monitoring and approved sleep sack attachments compel companies to undergo rigorous testing protocols increasing product certification delays by up to 25%.
  • Balancing complex infant sleep telemetry arrays and automated sway mechanisms inflates base manufacturing costs limiting the affordability of convertible infant enclosures. Additionally securing expansive cloud video storage environments against cyber threats drives overhead higher.
  • Furthermore standardizing white noise calibration across diverse acoustic spaces remains an engineering hurdle leading to a 12% increase in component rejection rates during quality assurance phases severely compressing profit margins.

Exclusive Technavio Analysis on Customer Landscape

The smart crib market forecasting report includes the adoption lifecycle of the market, covering from the innovator’s stage to the laggard’s stage. It focuses on adoption rates in different regions based on penetration. Furthermore, the smart crib market report also includes key purchase criteria and drivers of price sensitivity to help companies evaluate and develop their market growth analysis strategies.
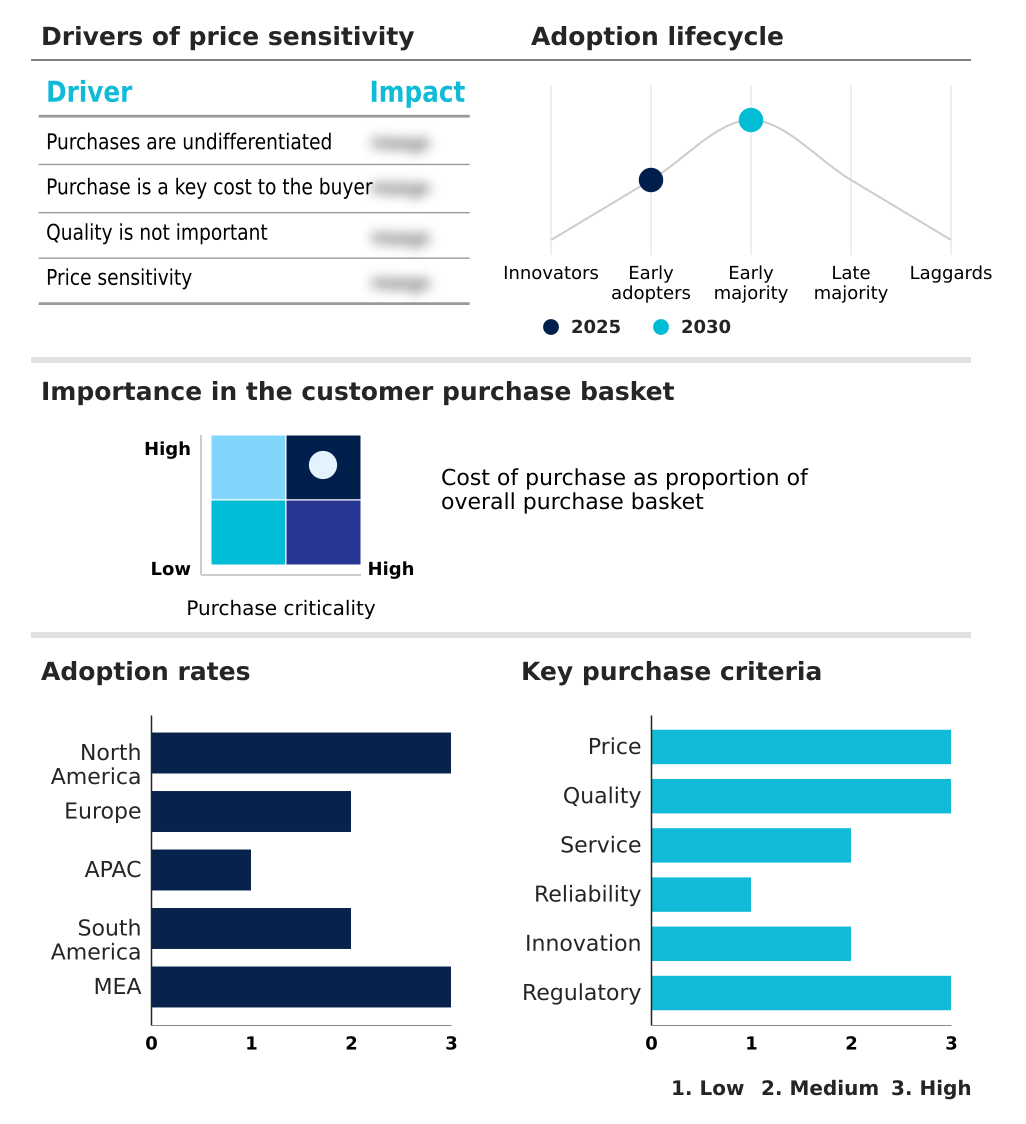
Customer Landscape of Smart Crib Industry

Competitive Landscape

Companies are implementing various strategies, such as strategic alliances, smart crib market forecast, partnerships, mergers and acquisitions, geographical expansion, and product/service launches, to enhance their presence in the industry.

BabyBjorn AB - The entity delivers advanced infant sleep hardware utilizing artificial intelligence and non-invasive sensors to provide automated soothing predictive health analytics and secure pediatric monitoring.

The industry research and growth report includes detailed analyses of the competitive landscape of the market and information about key companies, including:

  • BabyBjorn AB
  • Bugaboo North America Inc.
  • Chicco
  • Cradlewise Inc.
  • Dorel Juvenile Group Inc.
  • Dream On Me Inc.
  • Evolur Baby
  • Graco
  • HALO Dream Inc.
  • Happiest Baby Inc
  • Joie International Co. Ltd.
  • Mattel Inc.
  • Micuna Family Brands SLU
  • Munchkin Inc.
  • Owlet Inc.
  • Safety 1st
  • Silver Cross UK Ltd.
  • Stokke AS
  • Tiny Love Ltd.
  • Udisense Inc.

Qualitative and quantitative analysis of companies has been conducted to help clients understand the wider business environment as well as the strengths and weaknesses of key industry players. Data is qualitatively analyzed to categorize companies as pure play, category-focused, industry-focused, and diversified; it is quantitatively analyzed to categorize companies as dominant, leading, strong, tentative, and weak.

Recent Development and News in Smart crib market

  • In the Household Products industry the implementation of ISO 14001 sustainability standards for juvenile furniture has driven the adoption of non-toxic structural polymers directly impacting Global Smart Crib Market 2026-2030 demand by increasing the use of hypoallergenic sleep materials by 22% across North America.
  • The European Union REACH directive targeting electronic hardware components has forced developers to enhance electromagnetic field emission control successfully reducing hazardous radio frequency exposures in infant sleep telemetry modules by 40% across commercial childcare facilities.
  • The transition toward ultra-low power Bluetooth Low Energy technology within connected home appliances has optimized wireless sleep monitoring architectures improving battery efficiency in residential nursery ecosystems by 35% without compromising data transmission integrity.
  • The integration of solid-state thermoelectric cooling processes in consumer bedding applications has enabled the commercialization of integrated thermal regulation fabrics driving a 15% increase in automated temperature stabilization hardware within the pediatric wellness sector.

Dive into Technavio’s robust research methodology, blending expert interviews, extensive data synthesis, and validated models for unparalleled Smart Crib Market insights. See full methodology.

Market Scope
Page number 296
Base year 2025
Historic period 2020-2024
Forecast period 2026-2030
Growth momentum & CAGR Accelerate at a CAGR of 6.3%
Market growth 2026-2030 USD 202.1 million
Market structure Fragmented
YoY growth 2025-2026(%) 5.5%
Key countries US, Canada, Mexico, Germany, UK, France, Italy, Spain, The Netherlands, China, Japan, India, South Korea, Australia, Indonesia, Brazil, Argentina, Colombia, Saudi Arabia, UAE, South Africa, Turkey and Israel
Competitive landscape Leading Companies, Market Positioning of Companies, Competitive Strategies, and Industry Risks

Request Free Sample

Research Analyst Overview

  • The Global Smart Crib Market 2026-2030 reflects a profound architectural shift from passive sleep enclosures to interactive digital health environments. Industry participants increasingly prioritize non-contact biometric sensing to gather continuous physiological data without disrupting infant comfort. By leveraging optical computer vision alongside sophisticated machine learning integration these intelligent systems precisely analyze sleep telemetry in real time.
  • This technological capacity ensures highly accurate respiratory rate tracking and micro-movement detection enabling the hardware to anticipate wakefulness. As a result product engineering teams have improved automated intervention accuracy by 30% directly minimizing parental sleep deprivation. Furthermore the deployment of secure cloud video storage facilitates detailed historical performance reviews informing long-term product strategy and software updates.
  • Integrating automated sway mechanisms directly linked to these sensor arrays allows for preemptive soothing fundamentally changing nighttime care dynamics. Executives utilize these rich data streams to navigate strict safety compliance mandates and inform targeted boardroom strategies regarding premium pricing and subscription service rollouts.

What are the Key Data Covered in this Smart Crib Market Research and Growth Report?

  • What is the expected growth of the Smart Crib Market between 2026 and 2030?

    • USD 202.1 million, at a CAGR of 6.3%

  • What segmentation does the market report cover?

    • The report is segmented by Product Type (Standard smart cribs, Convertible smart cribs, Portable smart cribs, and Others), Distribution Channel (Offline, and Online), Age Group (Newborn, Infant, and Toddler) and Geography (North America, Europe, APAC, South America, Middle East and Africa)

  • Which regions are analyzed in the report?

    • North America, Europe, APAC, South America and Middle East and Africa

  • What are the key growth drivers and market challenges?

    • Technological convergence of AI and biometric sensing technology, High capital costs and subscription-based price barriers

  • Who are the major players in the Smart Crib Market?

    • BabyBjorn AB, Bugaboo North America Inc., Chicco, Cradlewise Inc., Dorel Juvenile Group Inc., Dream On Me Inc., Evolur Baby, Graco, HALO Dream Inc., Happiest Baby Inc, Joie International Co. Ltd., Mattel Inc., Micuna Family Brands SLU, Munchkin Inc., Owlet Inc., Safety 1st, Silver Cross UK Ltd., Stokke AS, Tiny Love Ltd. and Udisense Inc.

Market Research Insights

  • The Smart Crib Market is rapidly evolving to incorporate sophisticated pediatric health metrics into daily childrearing. By leveraging multi-stage sleep systems parents secure long-term hardware utility rather than transient solutions. Incorporating voice assistant integration has streamlined hands-free operation improving daily caregiver task efficiency by 22%.
  • Furthermore the adoption of subscription-based health insights provides continuous analytical value increasing recurring digital service attach rates by 35% compared to legacy offline models. This shift toward actionable data collection optimizes automated soothing accuracy by 15% reducing the frequency of parental interventions and establishing a highly responsive digitally connected pediatric care ecosystem.

We can help! Our analysts can customize this smart crib market research report to meet your requirements.

Get in touch

1. Executive Summary

1.1 Market overview

Executive Summary - Chart on Market Overview
Executive Summary - Data Table on Market Overview
Executive Summary - Chart on Global Market Characteristics
Executive Summary - Chart on Market by Geography
Executive Summary - Chart on Market Segmentation by Product Type
Executive Summary - Chart on Market Segmentation by Distribution Channel
Executive Summary - Chart on Market Segmentation by Age Group
Executive Summary - Chart on Incremental Growth
Executive Summary - Data Table on Incremental Growth
Executive Summary - Chart on Company Market Positioning

2. Technavio Analysis

2.1 Analysis of price sensitivity, lifecycle, customer purchase basket, adoption rates, and purchase criteria

2.2 Criticality of inputs and Factors of differentiation

Chart on Overview on criticality of inputs and factors of differentiation

2.3 Factors of disruption

Chart on Overview on factors of disruption

2.4 Impact of drivers and challenges

Chart on Impact of drivers and challenges in 2025 and 2030

3. Market Landscape

3.1 Market ecosystem

Chart on Parent Market
Data Table on - Parent Market

3.2 Market characteristics

Chart on Market characteristics analysis

3.3 Value chain analysis

Chart on Value chain analysis

4. Market Sizing

4.1 Market definition

Data Table on Offerings of companies included in the market definition

4.2 Market segment analysis

Market segments

4.3 Market size 2025

4.4 Market outlook: Forecast for 2025-2030

Chart on Global - Market size and forecast 2025-2030 ($ million)
Data Table on Global - Market size and forecast 2025-2030 ($ million)
Chart on Global Market: Year-over-year growth 2025-2030 (%)
Data Table on Global Market: Year-over-year growth 2025-2030 (%)

5. Historic Market Size

5.1 Global Smart Crib Market 2020 - 2024

Historic Market Size - Data Table on Global Smart Crib Market 2020 - 2024 ($ million)

5.2 Product Type segment analysis 2020 - 2024

Historic Market Size - Product Type Segment 2020 - 2024 ($ million)

5.3 Distribution Channel segment analysis 2020 - 2024

Historic Market Size - Distribution Channel Segment 2020 - 2024 ($ million)

5.4 Age Group segment analysis 2020 - 2024

Historic Market Size - Age Group Segment 2020 - 2024 ($ million)

5.5 Geography segment analysis 2020 - 2024

Historic Market Size - Geography Segment 2020 - 2024 ($ million)

5.6 Country segment analysis 2020 - 2024

Historic Market Size - Country Segment 2020 - 2024 ($ million)

6. Qualitative Analysis

6.1 Impact of AI on Global Smart Crib Market

6.2 Impact of geopolitical conflicts on Global Smart Crib Market

7. Five Forces Analysis

7.1 Five forces summary

Five forces analysis - Comparison between 2025 and 2030

7.2 Bargaining power of buyers

Bargaining power of buyers - Impact of key factors 2025 and 2030

7.3 Bargaining power of suppliers

Bargaining power of suppliers - Impact of key factors in 2025 and 2030

7.4 Threat of new entrants

Threat of new entrants - Impact of key factors in 2025 and 2030

7.5 Threat of substitutes

Threat of substitutes - Impact of key factors in 2025 and 2030

7.6 Threat of rivalry

Threat of rivalry - Impact of key factors in 2025 and 2030

7.7 Market condition

Chart on Market condition - Five forces 2025 and 2030

8. Market Segmentation by Product Type

8.1 Market segments

Chart on Product Type - Market share 2025-2030 (%)
Data Table on Product Type - Market share 2025-2030 (%)

8.2 Comparison by Product Type

Chart on Comparison by Product Type
Data Table on Comparison by Product Type

8.3 Standard smart cribs - Market size and forecast 2025-2030

Chart on Standard smart cribs - Market size and forecast 2025-2030 ($ million)
Data Table on Standard smart cribs - Market size and forecast 2025-2030 ($ million)
Chart on Standard smart cribs - Year-over-year growth 2025-2030 (%)
Data Table on Standard smart cribs - Year-over-year growth 2025-2030 (%)

8.4 Convertible smart cribs - Market size and forecast 2025-2030

Chart on Convertible smart cribs - Market size and forecast 2025-2030 ($ million)
Data Table on Convertible smart cribs - Market size and forecast 2025-2030 ($ million)
Chart on Convertible smart cribs - Year-over-year growth 2025-2030 (%)
Data Table on Convertible smart cribs - Year-over-year growth 2025-2030 (%)

8.5 Portable smart cribs - Market size and forecast 2025-2030

Chart on Portable smart cribs - Market size and forecast 2025-2030 ($ million)
Data Table on Portable smart cribs - Market size and forecast 2025-2030 ($ million)
Chart on Portable smart cribs - Year-over-year growth 2025-2030 (%)
Data Table on Portable smart cribs - Year-over-year growth 2025-2030 (%)

8.6 Others - Market size and forecast 2025-2030

Chart on Others - Market size and forecast 2025-2030 ($ million)
Data Table on Others - Market size and forecast 2025-2030 ($ million)
Chart on Others - Year-over-year growth 2025-2030 (%)
Data Table on Others - Year-over-year growth 2025-2030 (%)

8.7 Market opportunity by Product Type

Market opportunity by Product Type ($ million)
Data Table on Market opportunity by Product Type ($ million)

9. Market Segmentation by Distribution Channel

9.1 Market segments

Chart on Distribution Channel - Market share 2025-2030 (%)
Data Table on Distribution Channel - Market share 2025-2030 (%)

9.2 Comparison by Distribution Channel

Chart on Comparison by Distribution Channel
Data Table on Comparison by Distribution Channel

9.3 Offline - Market size and forecast 2025-2030

Chart on Offline - Market size and forecast 2025-2030 ($ million)
Data Table on Offline - Market size and forecast 2025-2030 ($ million)
Chart on Offline - Year-over-year growth 2025-2030 (%)
Data Table on Offline - Year-over-year growth 2025-2030 (%)

9.4 Online - Market size and forecast 2025-2030

Chart on Online - Market size and forecast 2025-2030 ($ million)
Data Table on Online - Market size and forecast 2025-2030 ($ million)
Chart on Online - Year-over-year growth 2025-2030 (%)
Data Table on Online - Year-over-year growth 2025-2030 (%)

9.5 Market opportunity by Distribution Channel

Market opportunity by Distribution Channel ($ million)
Data Table on Market opportunity by Distribution Channel ($ million)

10. Market Segmentation by Age Group

10.1 Market segments

Chart on Age Group - Market share 2025-2030 (%)
Data Table on Age Group - Market share 2025-2030 (%)

10.2 Comparison by Age Group

Chart on Comparison by Age Group
Data Table on Comparison by Age Group

10.3 Newborn - Market size and forecast 2025-2030

Chart on Newborn - Market size and forecast 2025-2030 ($ million)
Data Table on Newborn - Market size and forecast 2025-2030 ($ million)
Chart on Newborn - Year-over-year growth 2025-2030 (%)
Data Table on Newborn - Year-over-year growth 2025-2030 (%)

10.4 Infant - Market size and forecast 2025-2030

Chart on Infant - Market size and forecast 2025-2030 ($ million)
Data Table on Infant - Market size and forecast 2025-2030 ($ million)
Chart on Infant - Year-over-year growth 2025-2030 (%)
Data Table on Infant - Year-over-year growth 2025-2030 (%)

10.5 Toddler - Market size and forecast 2025-2030

Chart on Toddler - Market size and forecast 2025-2030 ($ million)
Data Table on Toddler - Market size and forecast 2025-2030 ($ million)
Chart on Toddler - Year-over-year growth 2025-2030 (%)
Data Table on Toddler - Year-over-year growth 2025-2030 (%)

10.6 Market opportunity by Age Group

Market opportunity by Age Group ($ million)
Data Table on Market opportunity by Age Group ($ million)

11. Customer Landscape

11.1 Customer landscape overview

Analysis of price sensitivity, lifecycle, customer purchase basket, adoption rates, and purchase criteria

12. Geographic Landscape

12.1 Geographic segmentation

Chart on Market share by geography 2025-2030 (%)
Data Table on Market share by geography 2025-2030 (%)

12.2 Geographic comparison

Chart on Geographic comparison
Data Table on Geographic comparison

12.3 North America - Market size and forecast 2025-2030

Chart on North America - Market size and forecast 2025-2030 ($ million)
Data Table on North America - Market size and forecast 2025-2030 ($ million)
Chart on North America - Year-over-year growth 2025-2030 (%)
Data Table on North America - Year-over-year growth 2025-2030 (%)
Chart on Regional Comparison - North America
Data Table on Regional Comparison - North America

12.3.1 US - Market size and forecast 2025-2030

Chart on US - Market size and forecast 2025-2030 ($ million)
Data Table on US - Market size and forecast 2025-2030 ($ million)
Chart on US - Year-over-year growth 2025-2030 (%)
Data Table on US - Year-over-year growth 2025-2030 (%)

12.3.2 Canada - Market size and forecast 2025-2030

Chart on Canada - Market size and forecast 2025-2030 ($ million)
Data Table on Canada - Market size and forecast 2025-2030 ($ million)
Chart on Canada - Year-over-year growth 2025-2030 (%)
Data Table on Canada - Year-over-year growth 2025-2030 (%)

12.3.3 Mexico - Market size and forecast 2025-2030

Chart on Mexico - Market size and forecast 2025-2030 ($ million)
Data Table on Mexico - Market size and forecast 2025-2030 ($ million)
Chart on Mexico - Year-over-year growth 2025-2030 (%)
Data Table on Mexico - Year-over-year growth 2025-2030 (%)

12.4 Europe - Market size and forecast 2025-2030

Chart on Europe - Market size and forecast 2025-2030 ($ million)
Data Table on Europe - Market size and forecast 2025-2030 ($ million)
Chart on Europe - Year-over-year growth 2025-2030 (%)
Data Table on Europe - Year-over-year growth 2025-2030 (%)
Chart on Regional Comparison - Europe
Data Table on Regional Comparison - Europe

12.4.1 Germany - Market size and forecast 2025-2030

Chart on Germany - Market size and forecast 2025-2030 ($ million)
Data Table on Germany - Market size and forecast 2025-2030 ($ million)
Chart on Germany - Year-over-year growth 2025-2030 (%)
Data Table on Germany - Year-over-year growth 2025-2030 (%)

12.4.2 UK - Market size and forecast 2025-2030

Chart on UK - Market size and forecast 2025-2030 ($ million)
Data Table on UK - Market size and forecast 2025-2030 ($ million)
Chart on UK - Year-over-year growth 2025-2030 (%)
Data Table on UK - Year-over-year growth 2025-2030 (%)

12.4.3 France - Market size and forecast 2025-2030

Chart on France - Market size and forecast 2025-2030 ($ million)
Data Table on France - Market size and forecast 2025-2030 ($ million)
Chart on France - Year-over-year growth 2025-2030 (%)
Data Table on France - Year-over-year growth 2025-2030 (%)

12.4.4 Italy - Market size and forecast 2025-2030

Chart on Italy - Market size and forecast 2025-2030 ($ million)
Data Table on Italy - Market size and forecast 2025-2030 ($ million)
Chart on Italy - Year-over-year growth 2025-2030 (%)
Data Table on Italy - Year-over-year growth 2025-2030 (%)

12.4.5 Spain - Market size and forecast 2025-2030

Chart on Spain - Market size and forecast 2025-2030 ($ million)
Data Table on Spain - Market size and forecast 2025-2030 ($ million)
Chart on Spain - Year-over-year growth 2025-2030 (%)
Data Table on Spain - Year-over-year growth 2025-2030 (%)

12.4.6 The Netherlands - Market size and forecast 2025-2030

Chart on The Netherlands - Market size and forecast 2025-2030 ($ million)
Data Table on The Netherlands - Market size and forecast 2025-2030 ($ million)
Chart on The Netherlands - Year-over-year growth 2025-2030 (%)
Data Table on The Netherlands - Year-over-year growth 2025-2030 (%)

12.5 APAC - Market size and forecast 2025-2030

Chart on APAC - Market size and forecast 2025-2030 ($ million)
Data Table on APAC - Market size and forecast 2025-2030 ($ million)
Chart on APAC - Year-over-year growth 2025-2030 (%)
Data Table on APAC - Year-over-year growth 2025-2030 (%)
Chart on Regional Comparison - APAC
Data Table on Regional Comparison - APAC

12.5.1 China - Market size and forecast 2025-2030

Chart on China - Market size and forecast 2025-2030 ($ million)
Data Table on China - Market size and forecast 2025-2030 ($ million)
Chart on China - Year-over-year growth 2025-2030 (%)
Data Table on China - Year-over-year growth 2025-2030 (%)

12.5.2 Japan - Market size and forecast 2025-2030

Chart on Japan - Market size and forecast 2025-2030 ($ million)
Data Table on Japan - Market size and forecast 2025-2030 ($ million)
Chart on Japan - Year-over-year growth 2025-2030 (%)
Data Table on Japan - Year-over-year growth 2025-2030 (%)

12.5.3 India - Market size and forecast 2025-2030

Chart on India - Market size and forecast 2025-2030 ($ million)
Data Table on India - Market size and forecast 2025-2030 ($ million)
Chart on India - Year-over-year growth 2025-2030 (%)
Data Table on India - Year-over-year growth 2025-2030 (%)

12.5.4 South Korea - Market size and forecast 2025-2030

Chart on South Korea - Market size and forecast 2025-2030 ($ million)
Data Table on South Korea - Market size and forecast 2025-2030 ($ million)
Chart on South Korea - Year-over-year growth 2025-2030 (%)
Data Table on South Korea - Year-over-year growth 2025-2030 (%)

12.5.5 Australia - Market size and forecast 2025-2030

Chart on Australia - Market size and forecast 2025-2030 ($ million)
Data Table on Australia - Market size and forecast 2025-2030 ($ million)
Chart on Australia - Year-over-year growth 2025-2030 (%)
Data Table on Australia - Year-over-year growth 2025-2030 (%)

12.5.6 Indonesia - Market size and forecast 2025-2030

Chart on Indonesia - Market size and forecast 2025-2030 ($ million)
Data Table on Indonesia - Market size and forecast 2025-2030 ($ million)
Chart on Indonesia - Year-over-year growth 2025-2030 (%)
Data Table on Indonesia - Year-over-year growth 2025-2030 (%)

12.6 South America - Market size and forecast 2025-2030

Chart on South America - Market size and forecast 2025-2030 ($ million)
Data Table on South America - Market size and forecast 2025-2030 ($ million)
Chart on South America - Year-over-year growth 2025-2030 (%)
Data Table on South America - Year-over-year growth 2025-2030 (%)
Chart on Regional Comparison - South America
Data Table on Regional Comparison - South America

12.6.1 Brazil - Market size and forecast 2025-2030

Chart on Brazil - Market size and forecast 2025-2030 ($ million)
Data Table on Brazil - Market size and forecast 2025-2030 ($ million)
Chart on Brazil - Year-over-year growth 2025-2030 (%)
Data Table on Brazil - Year-over-year growth 2025-2030 (%)

12.6.2 Argentina - Market size and forecast 2025-2030

Chart on Argentina - Market size and forecast 2025-2030 ($ million)
Data Table on Argentina - Market size and forecast 2025-2030 ($ million)
Chart on Argentina - Year-over-year growth 2025-2030 (%)
Data Table on Argentina - Year-over-year growth 2025-2030 (%)

12.6.3 Colombia - Market size and forecast 2025-2030

Chart on Colombia - Market size and forecast 2025-2030 ($ million)
Data Table on Colombia - Market size and forecast 2025-2030 ($ million)
Chart on Colombia - Year-over-year growth 2025-2030 (%)
Data Table on Colombia - Year-over-year growth 2025-2030 (%)

12.7 Middle East and Africa - Market size and forecast 2025-2030

Chart on Middle East and Africa - Market size and forecast 2025-2030 ($ million)
Data Table on Middle East and Africa - Market size and forecast 2025-2030 ($ million)
Chart on Middle East and Africa - Year-over-year growth 2025-2030 (%)
Data Table on Middle East and Africa - Year-over-year growth 2025-2030 (%)
Chart on Regional Comparison - Middle East and Africa
Data Table on Regional Comparison - Middle East and Africa

12.7.1 Saudi Arabia - Market size and forecast 2025-2030

Chart on Saudi Arabia - Market size and forecast 2025-2030 ($ million)
Data Table on Saudi Arabia - Market size and forecast 2025-2030 ($ million)
Chart on Saudi Arabia - Year-over-year growth 2025-2030 (%)
Data Table on Saudi Arabia - Year-over-year growth 2025-2030 (%)

12.7.2 UAE - Market size and forecast 2025-2030

Chart on UAE - Market size and forecast 2025-2030 ($ million)
Data Table on UAE - Market size and forecast 2025-2030 ($ million)
Chart on UAE - Year-over-year growth 2025-2030 (%)
Data Table on UAE - Year-over-year growth 2025-2030 (%)

12.7.3 South Africa - Market size and forecast 2025-2030

Chart on South Africa - Market size and forecast 2025-2030 ($ million)
Data Table on South Africa - Market size and forecast 2025-2030 ($ million)
Chart on South Africa - Year-over-year growth 2025-2030 (%)
Data Table on South Africa - Year-over-year growth 2025-2030 (%)

12.7.4 Turkey - Market size and forecast 2025-2030

Chart on Turkey - Market size and forecast 2025-2030 ($ million)
Data Table on Turkey - Market size and forecast 2025-2030 ($ million)
Chart on Turkey - Year-over-year growth 2025-2030 (%)
Data Table on Turkey - Year-over-year growth 2025-2030 (%)

12.7.5 Israel - Market size and forecast 2025-2030

Chart on Israel - Market size and forecast 2025-2030 ($ million)
Data Table on Israel - Market size and forecast 2025-2030 ($ million)
Chart on Israel - Year-over-year growth 2025-2030 (%)
Data Table on Israel - Year-over-year growth 2025-2030 (%)

12.8 Market opportunity by geography

Market opportunity by geography ($ million)
Data Tables on Market opportunity by geography ($ million)

13. Drivers, Challenges, and Opportunity

13.1 Market drivers

Technological convergence of AI and biometric sensing technology
Surging parental awareness regarding safe sleep protocols and sudden infant health metrics
Expansion of urban dual-income households and premiumization in emerging markets

13.2 Market challenges

High capital costs and subscription-based price barriers
Stringent regulatory oversight and complex safety compliance mandates
Data privacy concerns and cybersecurity vulnerabilities

13.3 Impact of drivers and challenges

Impact of drivers and challenges in 2025 and 2030

13.4 Market opportunities

Integration of ML for predictive sleep and health analytics
Geographic expansion and localization in emerging high-growth economies
Elevated focus on medical-grade regulatory compliance and safe sleep certification

14. Competitive Landscape

14.1 Overview

14.2

Overview on criticality of inputs and factors of differentiation

14.3 Landscape disruption

Overview on factors of disruption

14.4 Industry risks

Impact of key risks on business

15. Competitive Analysis

15.1 Companies profiled

Companies covered

15.2 Company ranking index

15.3 Market positioning of companies

Matrix on companies position and classification

15.4 BabyBjorn AB

BabyBjorn AB - Overview
BabyBjorn AB - Product / Service
BabyBjorn AB - Key offerings
SWOT

15.5 Bugaboo North America Inc.

Bugaboo North America Inc. - Overview
Bugaboo North America Inc. - Product / Service
Bugaboo North America Inc. - Key offerings
SWOT

15.6 Cradlewise Inc.

Cradlewise Inc. - Overview
Cradlewise Inc. - Product / Service
Cradlewise Inc. - Key offerings
SWOT

15.7 Dorel Juvenile Group Inc.

Dorel Juvenile Group Inc. - Overview
Dorel Juvenile Group Inc. - Product / Service
Dorel Juvenile Group Inc. - Key offerings
SWOT

15.8 Dream On Me Inc.

Dream On Me Inc. - Overview
Dream On Me Inc. - Product / Service
Dream On Me Inc. - Key offerings
SWOT

15.9 Evolur Baby

Evolur Baby - Overview
Evolur Baby - Product / Service
Evolur Baby - Key offerings
SWOT

15.10 HALO Dream Inc.

HALO Dream Inc. - Overview
HALO Dream Inc. - Product / Service
HALO Dream Inc. - Key offerings
SWOT

15.11 Happiest Baby Inc

Happiest Baby Inc - Overview
Happiest Baby Inc - Product / Service
Happiest Baby Inc - Key offerings
SWOT

15.12 Joie International Co. Ltd.

Joie International Co. Ltd. - Overview
Joie International Co. Ltd. - Product / Service
Joie International Co. Ltd. - Key offerings
SWOT

15.13 Mattel Inc.

Mattel Inc. - Overview
Mattel Inc. - Business segments
Mattel Inc. - Key offerings
Mattel Inc. - Segment focus
SWOT

15.14 Munchkin Inc.

Munchkin Inc. - Overview
Munchkin Inc. - Product / Service
Munchkin Inc. - Key offerings
SWOT

15.15 Owlet Inc.

Owlet Inc. - Overview
Owlet Inc. - Product / Service
Owlet Inc. - Key offerings
SWOT

15.16 Silver Cross UK Ltd.

Silver Cross UK Ltd. - Overview
Silver Cross UK Ltd. - Product / Service
Silver Cross UK Ltd. - Key offerings
SWOT

15.17 Tiny Love Ltd.

Tiny Love Ltd. - Overview
Tiny Love Ltd. - Product / Service
Tiny Love Ltd. - Key offerings
SWOT

15.18 Udisense Inc.

Udisense Inc. - Overview
Udisense Inc. - Product / Service
Udisense Inc. - Key offerings
SWOT

16. Appendix

16.1 Scope of the report

Market definition
Objectives
Notes and caveats

16.2 Inclusions and exclusions checklist

Inclusions checklist
Exclusions checklist

16.3 Currency conversion rates for US$

16.4 Research methodology

16.5 Data procurement

Information sources

16.6 Data validation

16.7 Validation techniques employed for market sizing

16.8 Data synthesis

16.9 360 degree market analysis

16.10 List of abbreviations

Research Methodology

Technavio presents a detailed picture of the market by way of study, synthesis, and summation of data from multiple sources. The analysts have presented the various facets of the market with a particular focus on identifying the key industry influencers. The data thus presented is comprehensive, reliable, and the result of extensive research, both primary and secondary.

INFORMATION SOURCES

Primary sources

  • Manufacturers and suppliers
  • Channel partners
  • Industry experts
  • Strategic decision makers

Secondary sources

  • Industry journals and periodicals
  • Government data
  • Financial reports of key industry players
  • Historical data
  • Press releases

DATA ANALYSIS

Data Synthesis

  • Collation of data
  • Estimation of key figures
  • Analysis of derived insights

Data Validation

  • Triangulation with data models
  • Reference against proprietary databases
  • Corroboration with industry experts

REPORT WRITING

Qualitative

  • Market drivers
  • Market challenges
  • Market trends
  • Five forces analysis

Quantitative

  • Market size and forecast
  • Market segmentation
  • Geographical insights
  • Competitive landscape

Interested in this report?

Get your sample now to see our research methodology and insights!

Download Now

Frequently Asked Questions

Smart Crib market growth will increase by USD 202.1 million during 2026-2030.

The Smart Crib market is expected to grow at a CAGR of 6.3% during 2026-2030.

Smart Crib market is segmented by Product type (Standard smart cribs, Convertible smart cribs, Portable smart cribs, Others) Distribution channel (Offline, Online) Age group (Newborn, Infant, Toddler)

BabyBjorn AB, Bugaboo North America Inc., Chicco, Cradlewise Inc., Dorel Juvenile Group Inc., Dream On Me Inc., Evolur Baby, Graco, HALO Dream Inc., Happiest Baby Inc, Joie International Co. Ltd., Mattel Inc., Micuna Family Brands SLU, Munchkin Inc., Owlet Inc., Safety 1st, Silver Cross UK Ltd., Stokke AS, Tiny Love Ltd., Udisense Inc. are a few of the key vendors in the Smart Crib market.

North America will register the highest growth rate of 38% among the other regions. Therefore, the Smart Crib market in North America is expected to garner significant business opportunities for the vendors during the forecast period.

US, Canada, Mexico, Germany, UK, France, Italy, Spain, The Netherlands, China, Japan, India, South Korea, Australia, Indonesia, Brazil, Argentina, Colombia, Saudi Arabia, UAE, South Africa, Turkey, Israel

  • Technological convergence of AI and biometric sensing technology is the driving factor this market.

The Smart Crib market vendors should focus on grabbing business opportunities from the Product type segment as it accounted for the largest market share in the base year.
RIA - Research AI Assistant
Ask RIA
