Smart Room Heater Market Analysis, Size, and Forecast 2026-2030: Europe (Germany, UK, and France), North America (US, Canada, and Mexico), APAC (China, Japan, and India), South America (Brazil and Argentina), Middle East and Africa (Saudi Arabia, UAE, and South Africa), and Rest of World (ROW)

Smart Room Heater Market Analysis, Size, and Forecast 2026-2030:
Europe (Germany, UK, and France), North America (US, Canada, and Mexico), APAC (China, Japan, and India), South America (Brazil and Argentina), Middle East and Africa (Saudi Arabia, UAE, and South Africa), and Rest of World (ROW)

Published: Apr 2026 313 Pages SKU: IRTNTR44825

Market Overview at a Glance

$897.9 Mn
Market Opportunity
11.5%
CAGR 2025 - 2030
33.3%
Europe Growth
$675 Mn
Without connectivity segment 2024

Smart Room Heater Market Size 2026-2030

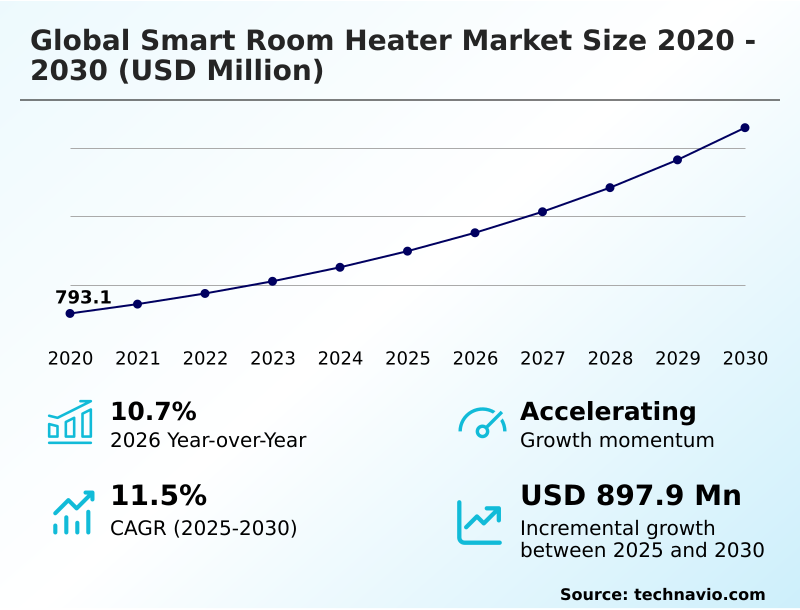
The smart room heater market size is valued to increase by USD 897.9 million, at a CAGR of 11.5% from 2025 to 2030. Rising demand for energy-efficient zone heating will drive the smart room heater market.

Major Market Trends & Insights

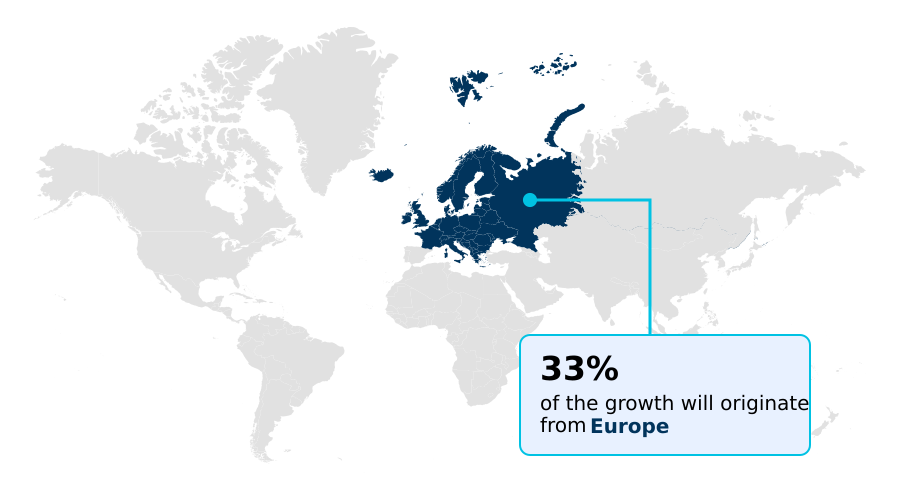
  • Europe dominated the market and accounted for a 33.3% growth during the forecast period.
  • By Type - Without connectivity segment was valued at USD 675 million in 2024
  • By Distribution Channel - Offline segment accounted for the largest market revenue share in 2024

Market Size & Forecast

  • Market Opportunities: USD 1.35 billion
  • Market Future Opportunities: USD 897.9 million
  • CAGR from 2025 to 2030 : 11.5%

Market Summary

  • The smart room heater market is undergoing a significant transformation, evolving from standalone appliances to integral components of interconnected home ecosystems. This shift is primarily fueled by the convergence of IoT technology and consumer demand for greater energy efficiency and convenience.
  • Modern devices offer sophisticated features such as automated scheduling, remote management via mobile applications, and voice-activated controls, which collectively contribute to optimized energy usage and enhanced user comfort. Key market dynamics include the push for sustainability, supported by government incentives for energy-efficient products, and the continuous innovation in heating technologies like infrared and advanced ceramic elements.
  • However, the industry grapples with challenges related to data security and the high upfront cost of smart devices. For instance, a property management firm leveraging a fleet of smart heaters must implement robust cybersecurity protocols to protect tenant data and prevent unauthorized access, highlighting the critical balance between technological advancement and user trust.
  • This evolving landscape necessitates a focus on developing secure, interoperable, and cost-effective solutions to drive widespread adoption.

What will be the Size of the Smart Room Heater Market during the forecast period?

Get Key Insights on Market Forecast (PDF) Request Free Sample

How is the Smart Room Heater Market Segmented?

The smart room heater industry research report provides comprehensive data (region-wise segment analysis), with forecasts and estimates in "USD million" for the period 2026-2030, as well as historical data from 2020-2024 for the following segments.

  • Type
    • Without connectivity
    • With connectivity
  • Distribution channel
    • Offline
    • Online
  • Product type
    • Electric heaters
    • Gas heaters
    • Panel heaters
    • Infrared heaters
    • Smart thermostats and controls
  • Application
    • Residential
    • Non-residential
  • Geography
    • Europe
      • Germany
      • UK
      • France
    • North America
      • US
      • Canada
      • Mexico
    • APAC
      • China
      • Japan
      • India
    • South America
      • Brazil
      • Argentina
    • Middle East and Africa
      • Saudi Arabia
      • UAE
      • South Africa
    • Rest of World (ROW)

By Type Insights

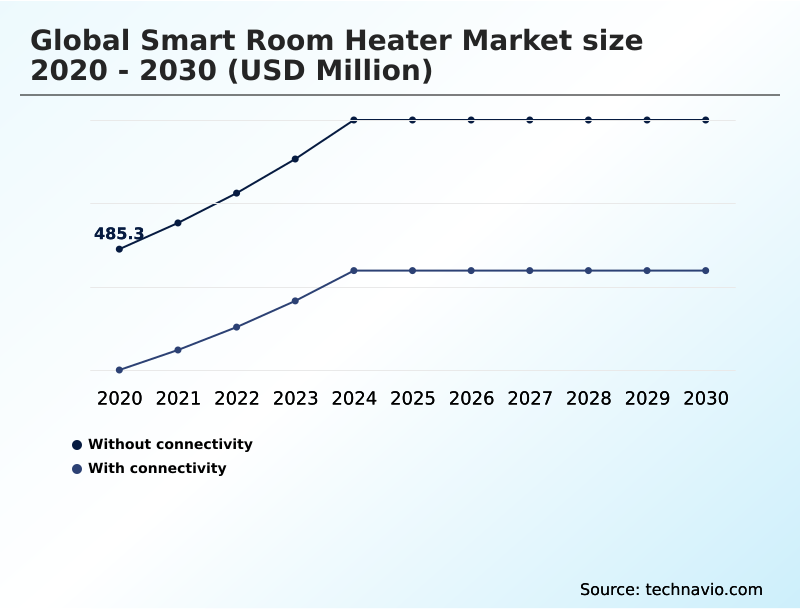
The without connectivity segment is estimated to witness significant growth during the forecast period.

The global smart room heater market 2026-2030 is segmented by type, distribution channel, product type, application, and geography.

The market includes intelligent standalone units that operate without external network communication, a segment catering to consumers prioritizing data privacy and operational simplicity. These devices leverage internal automation through high-precision sensors and ambient temperature sensors for localized zone heating.

Unlike systems dependent on Wi-Fi connectivity modules, their value lies in reliability, remaining unaffected by internet outages.

Features such as open-window detection are managed by onboard microprocessors, delivering significant energy savings; some models achieve a 25% reduction in wasted energy compared to non-intelligent heaters.

While lacking remote access, these heaters appeal to a demographic wary of the upfront investment cost and complexity of a fully connected ecosystem, offering dependable plug-and-play climate control with an integrated tip-over protection sensor.

Request Free Sample

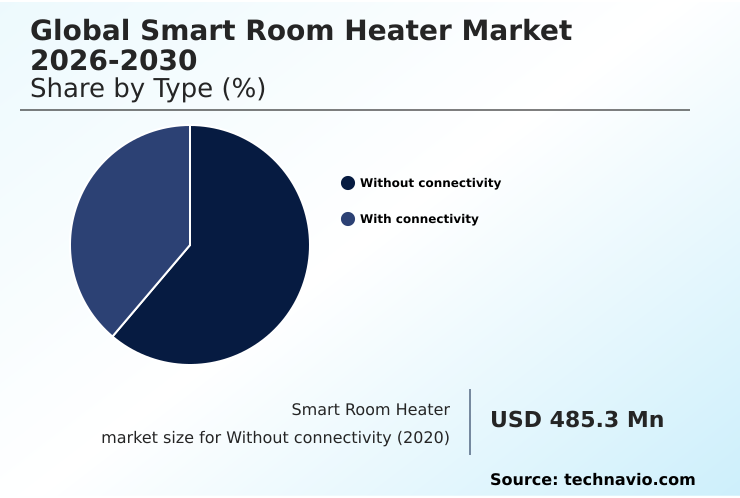
The Without connectivity segment was valued at USD 675 million in 2024 and showed a gradual increase during the forecast period.

Request Free Sample

Regional Analysis

Europe is estimated to contribute 33.3% to the growth of the global market during the forecast period.Technavio’s analysts have elaborately explained the regional trends and drivers that shape the market during the forecast period.

See How Smart Room Heater Market Demand is Rising in Europe Request Free Sample

The market's geographic landscape is diverse, with APAC holding the largest revenue share due to rapid urbanization, while Europe is the fastest-growing region, contributing 33.3% of the incremental growth.

European adoption is driven by stringent regulations and a focus on sustainable living solutions. Consumers in this region prefer devices with advanced thermal management systems, including proactive thermal management and open-window detection, to optimize efficiency.

In North America, the integration into smart home ecosystems is paramount, with a strong emphasis on real-time energy monitoring and energy consumption analytics. Commercial adoption in the region for centralized facility management has reduced utility costs by over 15%.

Features like eco-friendly power modes and automated safety monitoring are becoming standard expectations globally, reflecting a universal push toward smarter, safer, and more efficient climate control.
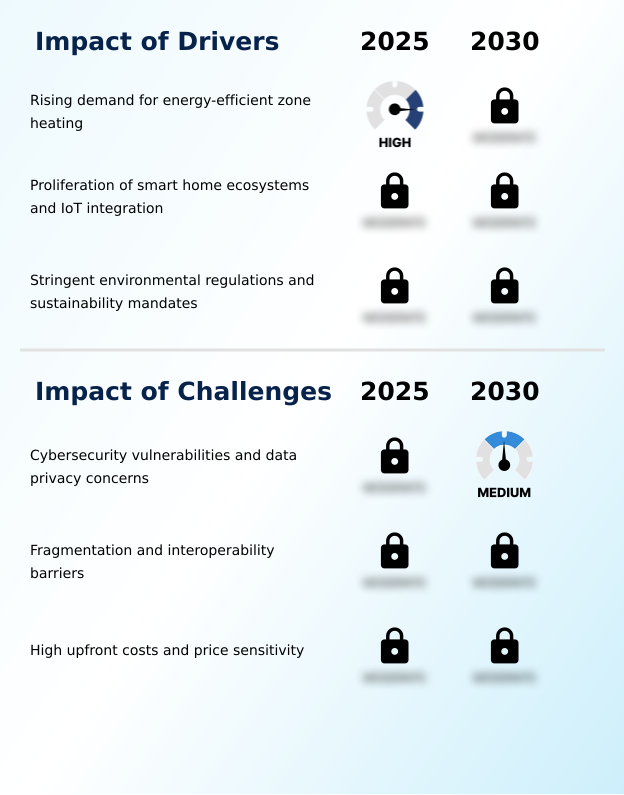
Market Dynamics

Our researchers analyzed the data with 2025 as the base year, along with the key drivers, trends, and challenges. A holistic analysis of drivers will help companies refine their marketing strategies to gain a competitive advantage.

  • Strategic decision-making in the smart room heater energy efficiency landscape requires a nuanced understanding of competing technologies and use cases. An infrared vs ceramic smart heater comparison, for instance, reveals that infrared models excel in targeted heating for large rooms, while ceramic units are superior for consistent ambient warmth in smaller spaces.
  • The benefits of a zone heating strategy are amplified with AI proactive thermal management, which can optimize energy use beyond simple scheduling. For consumers, the choice between an offline vs online smart heater often balances privacy concerns against the convenience of remote climate control.
  • The best smart heater for apartments is typically a wall-mounted panel heater, prized for its space-saving design and high energy efficiency. Integrating heaters with home automation is simplified by the matter protocol heater interoperability, which eliminates proprietary system conflicts.
  • Key features like a portable smart heater with a thermostat, smart heater open window detection, and eco mode on smart heaters are becoming standard. From a security standpoint, understanding heater cybersecurity data privacy is crucial before connecting any device. OTA updates for smart appliances ensure that both features and security protocols remain current.
  • For families, smart heater child safety features provide essential peace of mind. Businesses leveraging these technologies find that systems offering smart grid demand response programs can reduce operational energy costs by a margin significantly greater than those without, with some achieving savings nearly double that of non-integrated systems.
  • Ultimately, features like voice control for room heaters and energy consumption monitoring on heaters are shifting the market toward a more interactive and data-driven future.

What are the key market drivers leading to the rise in the adoption of Smart Room Heater Industry?

  • The rising demand for energy-efficient zone heating solutions is a key driver for market growth.

  • The market is primarily driven by the rising consumer demand for energy efficiency, best exemplified by the zone heating strategy. This approach utilizes supplemental heating solutions to warm specific areas, reducing reliance on central systems by up to 30%.
  • The rapid expansion of home automation ecosystems and the need for remote climate management have transformed heaters into interconnected nodes within smart building infrastructure.
  • Technological advancements in low-carbon heating technologies, including efficient ceramic heating elements and infrared radiation heating, provide faster, more targeted warmth.
  • Innovations like occupancy sensing technology and variable power output managed by precise digital thermostat control further optimize performance, reinforcing the industry's overarching digital transformation strategy toward smarter, more sustainable thermal management solutions.

What are the market trends shaping the Smart Room Heater Industry?

  • The integration of AI for proactive thermal management is an emerging market trend. This shift signifies a move toward predictive climate control solutions that enhance both energy efficiency and user convenience.

  • A key market trend is the shift toward AI-driven predictive analytics, where machine learning algorithms analyze user behavioral patterns and external data to enable proactive climate control. The adoption of matter-certified interoperability is dismantling ecosystem fragmentation, ensuring devices adhere to universal interoperability standards. This allows for seamless voice command synchronization with major voice-activated assistants.
  • The integration of geofencing technology enhances automated scheduling routines, with devices reducing output when users are away. Furthermore, smart heaters are becoming active participants in smart grid integration, offering grid flexibility services by responding to demand-response signals to reduce peak power consumption, a feature that lowers utility bills by an average of 15% in participating programs.

What challenges does the Smart Room Heater Industry face during its growth?

  • Cybersecurity vulnerabilities and data privacy concerns represent a key challenge affecting industry growth.

  • Significant market challenges persist, led by cybersecurity vulnerabilities associated with cloud-based data processing and the need to comply with stringent data privacy regulations. A reported security breach can diminish consumer trust by over 40%. Market fragmentation, caused by proprietary communication protocols, complicates integration into building management systems, although standards like the Zigbee communication protocol aim to resolve this.
  • Volatility in the semiconductor supply chain affects manufacturing costs and contributes to product premiumization, with smart models often priced twice as high as conventional heaters. Ensuring the security of over-the-air (OTA) updates and justifying the high initial cost remain critical hurdles for manufacturers aiming to balance innovation with affordability and occupant well-being.

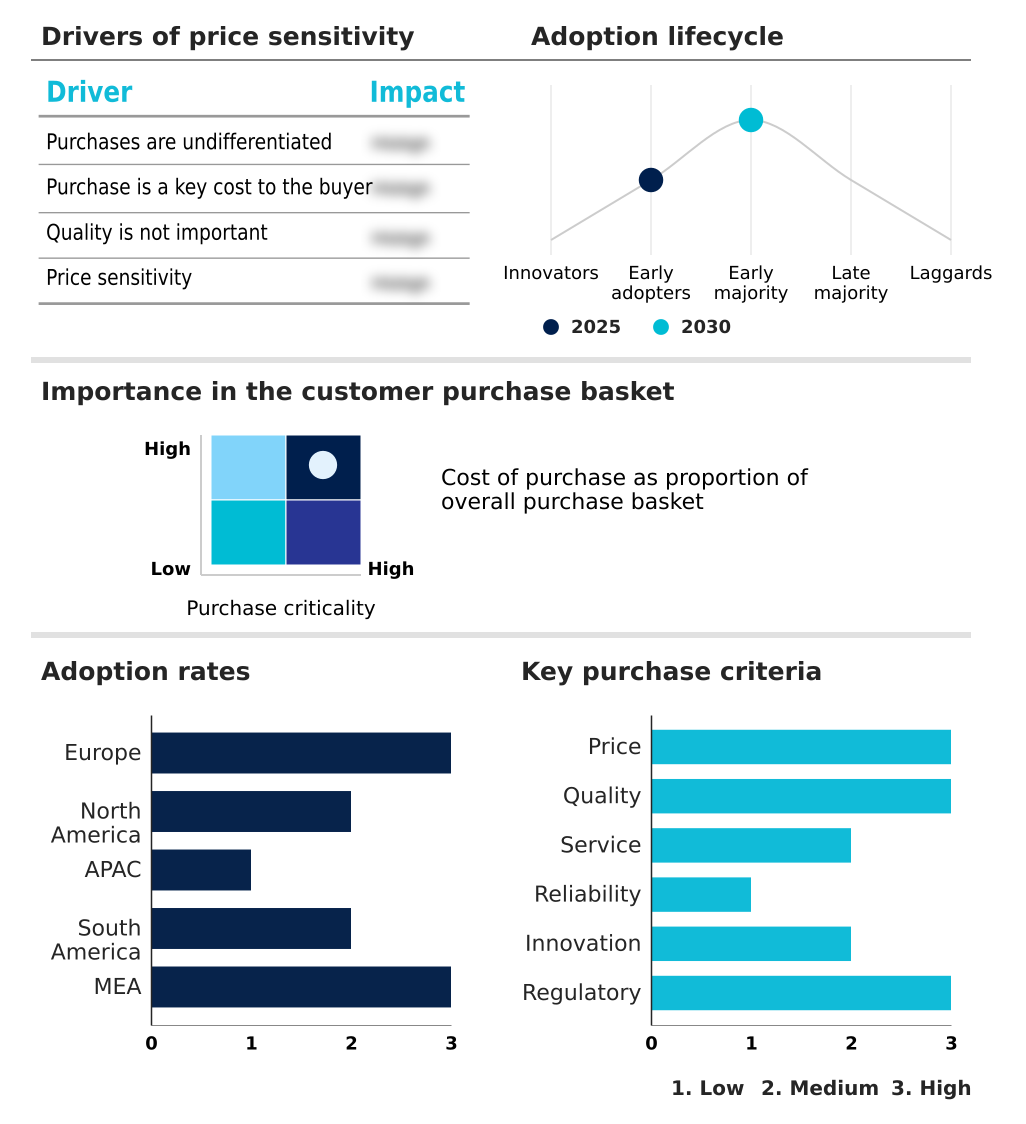
Exclusive Technavio Analysis on Customer Landscape

The smart room heater market forecasting report includes the adoption lifecycle of the market, covering from the innovator’s stage to the laggard’s stage. It focuses on adoption rates in different regions based on penetration. Furthermore, the smart room heater market report also includes key purchase criteria and drivers of price sensitivity to help companies evaluate and develop their market growth analysis strategies.

Customer Landscape of Smart Room Heater Industry

Competitive Landscape

Companies are implementing various strategies, such as strategic alliances, smart room heater market forecast, partnerships, mergers and acquisitions, geographical expansion, and product/service launches, to enhance their presence in the industry.

Arovast Corp. - The company provides smart space heaters, including CLEVAST models with oscillation and thermostats, alongside related Arovast and Levoit smart PTC ceramic units.

The industry research and growth report includes detailed analyses of the competitive landscape of the market and information about key companies, including:

  • Arovast Corp.
  • Atomi Inc.
  • Bromic Group
  • Chal Tec GmbH
  • DeLonghi Group
  • Dr. Infrared Heater
  • Dyson Ltd.
  • Energy Wise Solutions
  • Glen Dimplex Group.
  • Govee
  • Honeywell International Inc.
  • Lasko Products LLC
  • Mill International AS
  • Pelonis Technologies Inc.
  • Princess
  • STIEBEL ELTRON GmbH
  • TCL Industries Holdings Ltd.
  • Tuya Inc
  • Vornado Air LLC
  • Xiaomi Corp.

Qualitative and quantitative analysis of companies has been conducted to help clients understand the wider business environment as well as the strengths and weaknesses of key industry players. Data is qualitatively analyzed to categorize companies as pure play, category-focused, industry-focused, and diversified; it is quantitatively analyzed to categorize companies as dominant, leading, strong, tentative, and weak.

Recent Development and News in Smart room heater market

  • In November 2024, Mill International AS launched a software update enabling its Wi-Fi Generation 3 panel heaters and Smart WiFi Plug to support the Matter smart home protocol, allowing direct control via major smart home platforms without a separate hub.
  • In December 2024, Daikin Europe N.V. introduced the Daikin Altherma 4 H, its first residential heat pump range using the R-290 propane natural refrigerant, designed to decarbonize residential heating across Europe.
  • In November 2024, Govee, in cooperation with the US Consumer Product Safety Commission, announced a recall of over 500,000 smart electric space heaters due to fire and burn hazards from potential overheating.
  • In January 2025, Resideo Technologies Inc. launched the Honeywell Home X2S smart thermostat, a Matter-enabled and ENERGY STAR certified device aimed at mainstream consumers, featuring geofencing and broad compatibility with major smart home ecosystems.

Dive into Technavio’s robust research methodology, blending expert interviews, extensive data synthesis, and validated models for unparalleled Smart Room Heater Market insights. See full methodology.

Market Scope
Page number 313
Base year 2025
Historic period 2020-2024
Forecast period 2026-2030
Growth momentum & CAGR Accelerate at a CAGR of 11.5%
Market growth 2026-2030 USD 897.9 million
Market structure Fragmented
YoY growth 2025-2026(%) 10.7%
Key countries Germany, UK, France, Italy, Spain, The Netherlands, US, Canada, Mexico, China, Japan, India, South Korea, Australia, Indonesia, Brazil, Argentina, Chile, Saudi Arabia, UAE, South Africa, Israel and Turkey
Competitive landscape Leading Companies, Market Positioning of Companies, Competitive Strategies, and Industry Risks

Request Free Sample

Research Analyst Overview

  • The smart room heater market is defined by a decisive shift from hardware-centric design to software-driven intelligence, where proactive thermal management and AI-driven predictive analytics are the new benchmarks for value.
  • This evolution requires a strategic pivot in boardroom-level investment, prioritizing the development of sophisticated machine learning algorithms and cloud-based data processing over incremental improvements to resistive heating elements or physical design. The integration of matter-certified interoperability and geofencing technology is no longer a premium feature but a baseline expectation for achieving seamless voice command synchronization within smart home hubs.
  • Firms leveraging advanced thermal management systems with occupancy sensing technology and open-window detection are reporting efficiency gains that translate directly to consumer savings, with some systems demonstrating a 25% improvement in energy optimization over static-schedule models.
  • The competitive edge now belongs to companies that master smart grid integration, responding to demand-response signals with variable power output and offering granular energy consumption analytics. This software-first approach reshapes R&D, supply chain focus, and long-term product strategy.

What are the Key Data Covered in this Smart Room Heater Market Research and Growth Report?

  • What is the expected growth of the Smart Room Heater Market between 2026 and 2030?

    • USD 897.9 million, at a CAGR of 11.5%

  • What segmentation does the market report cover?

    • The report is segmented by Type (Without connectivity, and With connectivity), Distribution Channel (Offline, and Online), Product Type (Electric heaters, Gas heaters, Panel heaters, Infrared heaters, and Smart thermostats and controls), Application (Residential, and Non-residential) and Geography (Europe, North America, APAC, South America, Middle East and Africa)

  • Which regions are analyzed in the report?

    • Europe, North America, APAC, South America and Middle East and Africa

  • What are the key growth drivers and market challenges?

    • Rising demand for energy-efficient zone heating, Cybersecurity vulnerabilities and data privacy concerns

  • Who are the major players in the Smart Room Heater Market?

    • Arovast Corp., Atomi Inc., Bromic Group, Chal Tec GmbH, DeLonghi Group, Dr. Infrared Heater, Dyson Ltd., Energy Wise Solutions, Glen Dimplex Group., Govee, Honeywell International Inc., Lasko Products LLC, Mill International AS, Pelonis Technologies Inc., Princess, STIEBEL ELTRON GmbH, TCL Industries Holdings Ltd., Tuya Inc, Vornado Air LLC and Xiaomi Corp.

Market Research Insights

  • The market's momentum is sustained by a dynamic interplay between technological innovation and evolving consumer expectations for home automation ecosystems. The proliferation of interoperability standards is a key factor, with the adoption of new universal protocols reducing device setup complexities by over 40% and enhancing user experience.
  • This seamless integration encourages the adoption of multi-brand smart home environments, a shift from previous reliance on proprietary communication protocols. Concurrently, the demand for energy conservation is met with devices offering advanced automated scheduling routines, which can lower a household's seasonal heating expenditure by up to 25%.
  • This focus on efficiency and convenience is driving product premiumization, as consumers increasingly prioritize long-term savings and superior performance over initial upfront investment cost, creating a competitive landscape where software-defined features and energy efficiency ratings are critical differentiators.

We can help! Our analysts can customize this smart room heater market research report to meet your requirements.

Get in touch

1. Executive Summary

1.1 Market overview

Executive Summary - Chart on Market Overview
Executive Summary - Data Table on Market Overview
Executive Summary - Chart on Global Market Characteristics
Executive Summary - Chart on Market by Geography
Executive Summary - Chart on Market Segmentation by Type
Executive Summary - Chart on Market Segmentation by Distribution Channel
Executive Summary - Chart on Market Segmentation by Product Type
Executive Summary - Chart on Market Segmentation by Application
Executive Summary - Chart on Incremental Growth
Executive Summary - Data Table on Incremental Growth
Executive Summary - Chart on Company Market Positioning

2. Technavio Analysis

2.1 Analysis of price sensitivity, lifecycle, customer purchase basket, adoption rates, and purchase criteria

2.2 Criticality of inputs and Factors of differentiation

Chart on Overview on criticality of inputs and factors of differentiation

2.3 Factors of disruption

Chart on Overview on factors of disruption

2.4 Impact of drivers and challenges

Chart on Impact of drivers and challenges in 2025 and 2030

3. Market Landscape

3.1 Market ecosystem

Chart on Parent Market
Data Table on - Parent Market

3.2 Market characteristics

Chart on Market characteristics analysis

3.3 Value chain analysis

Chart on Value chain analysis

4. Market Sizing

4.1 Market definition

Data Table on Offerings of companies included in the market definition

4.2 Market segment analysis

Market segments

4.3 Market size 2025

4.4 Market outlook: Forecast for 2025-2030

Chart on Global - Market size and forecast 2025-2030 ($ million)
Data Table on Global - Market size and forecast 2025-2030 ($ million)
Chart on Global Market: Year-over-year growth 2025-2030 (%)
Data Table on Global Market: Year-over-year growth 2025-2030 (%)

5. Historic Market Size

5.1 Global Smart Room Heater Market 2020 - 2024

Historic Market Size - Data Table on Global Smart Room Heater Market 2020 - 2024 ($ million)

5.2 Type segment analysis 2020 - 2024

Historic Market Size - Type Segment 2020 - 2024 ($ million)

5.3 Distribution Channel segment analysis 2020 - 2024

Historic Market Size - Distribution Channel Segment 2020 - 2024 ($ million)

5.4 Product Type segment analysis 2020 - 2024

Historic Market Size - Product Type Segment 2020 - 2024 ($ million)

5.5 Application segment analysis 2020 - 2024

Historic Market Size - Application Segment 2020 - 2024 ($ million)

5.6 Geography segment analysis 2020 - 2024

Historic Market Size - Geography Segment 2020 - 2024 ($ million)

5.7 Country segment analysis 2020 - 2024

Historic Market Size - Country Segment 2020 - 2024 ($ million)

6. Qualitative Analysis

6.1 Impact of AI on global smart room heater market

6.2 Impact of geopolitical conflict on global smart room heater market

7. Five Forces Analysis

7.1 Five forces summary

Five forces analysis - Comparison between 2025 and 2030

7.2 Bargaining power of buyers

Bargaining power of buyers - Impact of key factors 2025 and 2030

7.3 Bargaining power of suppliers

Bargaining power of suppliers - Impact of key factors in 2025 and 2030

7.4 Threat of new entrants

Threat of new entrants - Impact of key factors in 2025 and 2030

7.5 Threat of substitutes

Threat of substitutes - Impact of key factors in 2025 and 2030

7.6 Threat of rivalry

Threat of rivalry - Impact of key factors in 2025 and 2030

7.7 Market condition

Chart on Market condition - Five forces 2025 and 2030

8. Market Segmentation by Type

8.1 Market segments

Chart on Type - Market share 2025-2030 (%)
Data Table on Type - Market share 2025-2030 (%)

8.2 Comparison by Type

Chart on Comparison by Type
Data Table on Comparison by Type

8.3 Without connectivity - Market size and forecast 2025-2030

Chart on Without connectivity - Market size and forecast 2025-2030 ($ million)
Data Table on Without connectivity - Market size and forecast 2025-2030 ($ million)
Chart on Without connectivity - Year-over-year growth 2025-2030 (%)
Data Table on Without connectivity - Year-over-year growth 2025-2030 (%)

8.4 With connectivity - Market size and forecast 2025-2030

Chart on With connectivity - Market size and forecast 2025-2030 ($ million)
Data Table on With connectivity - Market size and forecast 2025-2030 ($ million)
Chart on With connectivity - Year-over-year growth 2025-2030 (%)
Data Table on With connectivity - Year-over-year growth 2025-2030 (%)

8.5 Market opportunity by Type

Market opportunity by Type ($ million)
Data Table on Market opportunity by Type ($ million)

9. Market Segmentation by Distribution Channel

9.1 Market segments

Chart on Distribution Channel - Market share 2025-2030 (%)
Data Table on Distribution Channel - Market share 2025-2030 (%)

9.2 Comparison by Distribution Channel

Chart on Comparison by Distribution Channel
Data Table on Comparison by Distribution Channel

9.3 Offline - Market size and forecast 2025-2030

Chart on Offline - Market size and forecast 2025-2030 ($ million)
Data Table on Offline - Market size and forecast 2025-2030 ($ million)
Chart on Offline - Year-over-year growth 2025-2030 (%)
Data Table on Offline - Year-over-year growth 2025-2030 (%)

9.4 Online - Market size and forecast 2025-2030

Chart on Online - Market size and forecast 2025-2030 ($ million)
Data Table on Online - Market size and forecast 2025-2030 ($ million)
Chart on Online - Year-over-year growth 2025-2030 (%)
Data Table on Online - Year-over-year growth 2025-2030 (%)

9.5 Market opportunity by Distribution Channel

Market opportunity by Distribution Channel ($ million)
Data Table on Market opportunity by Distribution Channel ($ million)

10. Market Segmentation by Product Type

10.1 Market segments

Chart on Product Type - Market share 2025-2030 (%)
Data Table on Product Type - Market share 2025-2030 (%)

10.2 Comparison by Product Type

Chart on Comparison by Product Type
Data Table on Comparison by Product Type

10.3 Electric heaters - Market size and forecast 2025-2030

Chart on Electric heaters - Market size and forecast 2025-2030 ($ million)
Data Table on Electric heaters - Market size and forecast 2025-2030 ($ million)
Chart on Electric heaters - Year-over-year growth 2025-2030 (%)
Data Table on Electric heaters - Year-over-year growth 2025-2030 (%)

10.4 Gas heaters - Market size and forecast 2025-2030

Chart on Gas heaters - Market size and forecast 2025-2030 ($ million)
Data Table on Gas heaters - Market size and forecast 2025-2030 ($ million)
Chart on Gas heaters - Year-over-year growth 2025-2030 (%)
Data Table on Gas heaters - Year-over-year growth 2025-2030 (%)

10.5 Panel heaters - Market size and forecast 2025-2030

Chart on Panel heaters - Market size and forecast 2025-2030 ($ million)
Data Table on Panel heaters - Market size and forecast 2025-2030 ($ million)
Chart on Panel heaters - Year-over-year growth 2025-2030 (%)
Data Table on Panel heaters - Year-over-year growth 2025-2030 (%)

10.6 Infrared heaters - Market size and forecast 2025-2030

Chart on Infrared heaters - Market size and forecast 2025-2030 ($ million)
Data Table on Infrared heaters - Market size and forecast 2025-2030 ($ million)
Chart on Infrared heaters - Year-over-year growth 2025-2030 (%)
Data Table on Infrared heaters - Year-over-year growth 2025-2030 (%)

10.7 Smart thermostats and controls - Market size and forecast 2025-2030

Chart on Smart thermostats and controls - Market size and forecast 2025-2030 ($ million)
Data Table on Smart thermostats and controls - Market size and forecast 2025-2030 ($ million)
Chart on Smart thermostats and controls - Year-over-year growth 2025-2030 (%)
Data Table on Smart thermostats and controls - Year-over-year growth 2025-2030 (%)

10.8 Market opportunity by Product Type

Market opportunity by Product Type ($ million)
Data Table on Market opportunity by Product Type ($ million)

11. Market Segmentation by Application

11.1 Market segments

Chart on Application - Market share 2025-2030 (%)
Data Table on Application - Market share 2025-2030 (%)

11.2 Comparison by Application

Chart on Comparison by Application
Data Table on Comparison by Application

11.3 Residential - Market size and forecast 2025-2030

Chart on Residential - Market size and forecast 2025-2030 ($ million)
Data Table on Residential - Market size and forecast 2025-2030 ($ million)
Chart on Residential - Year-over-year growth 2025-2030 (%)
Data Table on Residential - Year-over-year growth 2025-2030 (%)

11.4 Non-residential - Market size and forecast 2025-2030

Chart on Non-residential - Market size and forecast 2025-2030 ($ million)
Data Table on Non-residential - Market size and forecast 2025-2030 ($ million)
Chart on Non-residential - Year-over-year growth 2025-2030 (%)
Data Table on Non-residential - Year-over-year growth 2025-2030 (%)

11.5 Market opportunity by Application

Market opportunity by Application ($ million)
Data Table on Market opportunity by Application ($ million)

12. Customer Landscape

12.1 Customer landscape overview

Analysis of price sensitivity, lifecycle, customer purchase basket, adoption rates, and purchase criteria

13. Geographic Landscape

13.1 Geographic segmentation

Chart on Market share by geography 2025-2030 (%)
Data Table on Market share by geography 2025-2030 (%)

13.2 Geographic comparison

Chart on Geographic comparison
Data Table on Geographic comparison

13.3 Europe - Market size and forecast 2025-2030

Chart on Europe - Market size and forecast 2025-2030 ($ million)
Data Table on Europe - Market size and forecast 2025-2030 ($ million)
Chart on Europe - Year-over-year growth 2025-2030 (%)
Data Table on Europe - Year-over-year growth 2025-2030 (%)
Chart on Regional Comparison - Europe
Data Table on Regional Comparison - Europe

13.3.1 Germany - Market size and forecast 2025-2030

Chart on Germany - Market size and forecast 2025-2030 ($ million)
Data Table on Germany - Market size and forecast 2025-2030 ($ million)
Chart on Germany - Year-over-year growth 2025-2030 (%)
Data Table on Germany - Year-over-year growth 2025-2030 (%)

13.3.2 UK - Market size and forecast 2025-2030

Chart on UK - Market size and forecast 2025-2030 ($ million)
Data Table on UK - Market size and forecast 2025-2030 ($ million)
Chart on UK - Year-over-year growth 2025-2030 (%)
Data Table on UK - Year-over-year growth 2025-2030 (%)

13.3.3 France - Market size and forecast 2025-2030

Chart on France - Market size and forecast 2025-2030 ($ million)
Data Table on France - Market size and forecast 2025-2030 ($ million)
Chart on France - Year-over-year growth 2025-2030 (%)
Data Table on France - Year-over-year growth 2025-2030 (%)

13.3.4 Italy - Market size and forecast 2025-2030

Chart on Italy - Market size and forecast 2025-2030 ($ million)
Data Table on Italy - Market size and forecast 2025-2030 ($ million)
Chart on Italy - Year-over-year growth 2025-2030 (%)
Data Table on Italy - Year-over-year growth 2025-2030 (%)

13.3.5 Spain - Market size and forecast 2025-2030

Chart on Spain - Market size and forecast 2025-2030 ($ million)
Data Table on Spain - Market size and forecast 2025-2030 ($ million)
Chart on Spain - Year-over-year growth 2025-2030 (%)
Data Table on Spain - Year-over-year growth 2025-2030 (%)

13.3.6 The Netherlands - Market size and forecast 2025-2030

Chart on The Netherlands - Market size and forecast 2025-2030 ($ million)
Data Table on The Netherlands - Market size and forecast 2025-2030 ($ million)
Chart on The Netherlands - Year-over-year growth 2025-2030 (%)
Data Table on The Netherlands - Year-over-year growth 2025-2030 (%)

13.4 North America - Market size and forecast 2025-2030

Chart on North America - Market size and forecast 2025-2030 ($ million)
Data Table on North America - Market size and forecast 2025-2030 ($ million)
Chart on North America - Year-over-year growth 2025-2030 (%)
Data Table on North America - Year-over-year growth 2025-2030 (%)
Chart on Regional Comparison - North America
Data Table on Regional Comparison - North America

13.4.1 US - Market size and forecast 2025-2030

Chart on US - Market size and forecast 2025-2030 ($ million)
Data Table on US - Market size and forecast 2025-2030 ($ million)
Chart on US - Year-over-year growth 2025-2030 (%)
Data Table on US - Year-over-year growth 2025-2030 (%)

13.4.2 Canada - Market size and forecast 2025-2030

Chart on Canada - Market size and forecast 2025-2030 ($ million)
Data Table on Canada - Market size and forecast 2025-2030 ($ million)
Chart on Canada - Year-over-year growth 2025-2030 (%)
Data Table on Canada - Year-over-year growth 2025-2030 (%)

13.4.3 Mexico - Market size and forecast 2025-2030

Chart on Mexico - Market size and forecast 2025-2030 ($ million)
Data Table on Mexico - Market size and forecast 2025-2030 ($ million)
Chart on Mexico - Year-over-year growth 2025-2030 (%)
Data Table on Mexico - Year-over-year growth 2025-2030 (%)

13.5 APAC - Market size and forecast 2025-2030

Chart on APAC - Market size and forecast 2025-2030 ($ million)
Data Table on APAC - Market size and forecast 2025-2030 ($ million)
Chart on APAC - Year-over-year growth 2025-2030 (%)
Data Table on APAC - Year-over-year growth 2025-2030 (%)
Chart on Regional Comparison - APAC
Data Table on Regional Comparison - APAC

13.5.1 China - Market size and forecast 2025-2030

Chart on China - Market size and forecast 2025-2030 ($ million)
Data Table on China - Market size and forecast 2025-2030 ($ million)
Chart on China - Year-over-year growth 2025-2030 (%)
Data Table on China - Year-over-year growth 2025-2030 (%)

13.5.2 Japan - Market size and forecast 2025-2030

Chart on Japan - Market size and forecast 2025-2030 ($ million)
Data Table on Japan - Market size and forecast 2025-2030 ($ million)
Chart on Japan - Year-over-year growth 2025-2030 (%)
Data Table on Japan - Year-over-year growth 2025-2030 (%)

13.5.3 India - Market size and forecast 2025-2030

Chart on India - Market size and forecast 2025-2030 ($ million)
Data Table on India - Market size and forecast 2025-2030 ($ million)
Chart on India - Year-over-year growth 2025-2030 (%)
Data Table on India - Year-over-year growth 2025-2030 (%)

13.5.4 South Korea - Market size and forecast 2025-2030

Chart on South Korea - Market size and forecast 2025-2030 ($ million)
Data Table on South Korea - Market size and forecast 2025-2030 ($ million)
Chart on South Korea - Year-over-year growth 2025-2030 (%)
Data Table on South Korea - Year-over-year growth 2025-2030 (%)

13.5.5 Australia - Market size and forecast 2025-2030

Chart on Australia - Market size and forecast 2025-2030 ($ million)
Data Table on Australia - Market size and forecast 2025-2030 ($ million)
Chart on Australia - Year-over-year growth 2025-2030 (%)
Data Table on Australia - Year-over-year growth 2025-2030 (%)

13.5.6 Indonesia - Market size and forecast 2025-2030

Chart on Indonesia - Market size and forecast 2025-2030 ($ million)
Data Table on Indonesia - Market size and forecast 2025-2030 ($ million)
Chart on Indonesia - Year-over-year growth 2025-2030 (%)
Data Table on Indonesia - Year-over-year growth 2025-2030 (%)

13.6 South America - Market size and forecast 2025-2030

Chart on South America - Market size and forecast 2025-2030 ($ million)
Data Table on South America - Market size and forecast 2025-2030 ($ million)
Chart on South America - Year-over-year growth 2025-2030 (%)
Data Table on South America - Year-over-year growth 2025-2030 (%)
Chart on Regional Comparison - South America
Data Table on Regional Comparison - South America

13.6.1 Brazil - Market size and forecast 2025-2030

Chart on Brazil - Market size and forecast 2025-2030 ($ million)
Data Table on Brazil - Market size and forecast 2025-2030 ($ million)
Chart on Brazil - Year-over-year growth 2025-2030 (%)
Data Table on Brazil - Year-over-year growth 2025-2030 (%)

13.6.2 Argentina - Market size and forecast 2025-2030

Chart on Argentina - Market size and forecast 2025-2030 ($ million)
Data Table on Argentina - Market size and forecast 2025-2030 ($ million)
Chart on Argentina - Year-over-year growth 2025-2030 (%)
Data Table on Argentina - Year-over-year growth 2025-2030 (%)

13.6.3 Chile - Market size and forecast 2025-2030

Chart on Chile - Market size and forecast 2025-2030 ($ million)
Data Table on Chile - Market size and forecast 2025-2030 ($ million)
Chart on Chile - Year-over-year growth 2025-2030 (%)
Data Table on Chile - Year-over-year growth 2025-2030 (%)

13.7 Middle East and Africa - Market size and forecast 2025-2030

Chart on Middle East and Africa - Market size and forecast 2025-2030 ($ million)
Data Table on Middle East and Africa - Market size and forecast 2025-2030 ($ million)
Chart on Middle East and Africa - Year-over-year growth 2025-2030 (%)
Data Table on Middle East and Africa - Year-over-year growth 2025-2030 (%)
Chart on Regional Comparison - Middle East and Africa
Data Table on Regional Comparison - Middle East and Africa

13.7.1 Saudi Arabia - Market size and forecast 2025-2030

Chart on Saudi Arabia - Market size and forecast 2025-2030 ($ million)
Data Table on Saudi Arabia - Market size and forecast 2025-2030 ($ million)
Chart on Saudi Arabia - Year-over-year growth 2025-2030 (%)
Data Table on Saudi Arabia - Year-over-year growth 2025-2030 (%)

13.7.2 UAE - Market size and forecast 2025-2030

Chart on UAE - Market size and forecast 2025-2030 ($ million)
Data Table on UAE - Market size and forecast 2025-2030 ($ million)
Chart on UAE - Year-over-year growth 2025-2030 (%)
Data Table on UAE - Year-over-year growth 2025-2030 (%)

13.7.3 South Africa - Market size and forecast 2025-2030

Chart on South Africa - Market size and forecast 2025-2030 ($ million)
Data Table on South Africa - Market size and forecast 2025-2030 ($ million)
Chart on South Africa - Year-over-year growth 2025-2030 (%)
Data Table on South Africa - Year-over-year growth 2025-2030 (%)

13.7.4 Israel - Market size and forecast 2025-2030

Chart on Israel - Market size and forecast 2025-2030 ($ million)
Data Table on Israel - Market size and forecast 2025-2030 ($ million)
Chart on Israel - Year-over-year growth 2025-2030 (%)
Data Table on Israel - Year-over-year growth 2025-2030 (%)

13.7.5 Turkey - Market size and forecast 2025-2030

Chart on Turkey - Market size and forecast 2025-2030 ($ million)
Data Table on Turkey - Market size and forecast 2025-2030 ($ million)
Chart on Turkey - Year-over-year growth 2025-2030 (%)
Data Table on Turkey - Year-over-year growth 2025-2030 (%)

13.8 Market opportunity by geography

Market opportunity by geography ($ million)
Data Tables on Market opportunity by geography ($ million)

14. Drivers, Challenges, and Opportunity

14.1 Market drivers

Rising demand for energy-efficient zone heating
Proliferation of smart home ecosystems and IoT integration
Stringent environmental regulations and sustainability mandates

14.2 Market challenges

Cybersecurity vulnerabilities and data privacy concerns
Fragmentation and interoperability barriers
High upfront costs and price sensitivity

14.3 Impact of drivers and challenges

Impact of drivers and challenges in 2025 and 2030

14.4 Market opportunities

Integration of AI for proactive thermal management
Rapid adoption of matter-certified interoperability standards
Expansion of smart energy monitoring and grid flexibility

15. Competitive Landscape

15.1 Overview

15.2

Overview on criticality of inputs and factors of differentiation

15.3 Landscape disruption

Overview on factors of disruption

15.4 Industry risks

Impact of key risks on business

16. Competitive Analysis

16.1 Companies profiled

Companies covered

16.2 Company ranking index

16.3 Market positioning of companies

Matrix on companies position and classification

16.4 Arovast Corp.

Arovast Corp. - Overview
Arovast Corp. - Product / Service
Arovast Corp. - Key offerings
SWOT

16.5 Bromic Group

Bromic Group - Overview
Bromic Group - Product / Service
Bromic Group - Key offerings
SWOT

16.6 DeLonghi Group

DeLonghi Group - Overview
DeLonghi Group - Business segments
DeLonghi Group - Key offerings
DeLonghi Group - Segment focus
SWOT

16.7 Dyson Ltd.

Dyson Ltd. - Overview
Dyson Ltd. - Product / Service
Dyson Ltd. - Key offerings
SWOT

16.8 Glen Dimplex Group.

Glen Dimplex Group. - Overview
Glen Dimplex Group. - Product / Service
Glen Dimplex Group. - Key offerings
SWOT

16.9 Govee

Govee - Overview
Govee - Product / Service
Govee - Key offerings
SWOT

16.10 Honeywell International Inc.

Honeywell International Inc. - Overview
Honeywell International Inc. - Business segments
Honeywell International Inc. - Key news
Honeywell International Inc. - Key offerings
Honeywell International Inc. - Segment focus
SWOT

16.11 Lasko Products LLC

Lasko Products LLC - Overview
Lasko Products LLC - Product / Service
Lasko Products LLC - Key offerings
SWOT

16.12 Pelonis Technologies Inc.

Pelonis Technologies Inc. - Overview
Pelonis Technologies Inc. - Product / Service
Pelonis Technologies Inc. - Key offerings
SWOT

16.13 Princess

Princess - Overview
Princess - Product / Service
Princess - Key offerings
SWOT

16.14 STIEBEL ELTRON GmbH

STIEBEL ELTRON GmbH - Overview
STIEBEL ELTRON GmbH - Product / Service
STIEBEL ELTRON GmbH - Key offerings
SWOT

16.15 TCL Industries Holdings Ltd.

TCL Industries Holdings Ltd. - Overview
TCL Industries Holdings Ltd. - Business segments
TCL Industries Holdings Ltd. - Key news
TCL Industries Holdings Ltd. - Key offerings
TCL Industries Holdings Ltd. - Segment focus
SWOT

16.16 Tuya Inc

Tuya Inc - Overview
Tuya Inc - Product / Service
Tuya Inc - Key offerings
SWOT

16.17 Vornado Air LLC

Vornado Air LLC - Overview
Vornado Air LLC - Product / Service
Vornado Air LLC - Key offerings
SWOT

16.18 Xiaomi Corp.

Xiaomi Corp. - Overview
Xiaomi Corp. - Business segments
Xiaomi Corp. - Key offerings
Xiaomi Corp. - Segment focus
SWOT

17. Appendix

17.1 Scope of the report

Market definition
Objectives
Notes and caveats

17.2 Inclusions and exclusions checklist

Inclusions checklist
Exclusions checklist

17.3 Currency conversion rates for US$

17.4 Research methodology

17.5 Data procurement

Information sources

17.6 Data validation

17.7 Validation techniques employed for market sizing

17.8 Data synthesis

17.9 360 degree market analysis

17.10 List of abbreviations

Research Methodology

Technavio presents a detailed picture of the market by way of study, synthesis, and summation of data from multiple sources. The analysts have presented the various facets of the market with a particular focus on identifying the key industry influencers. The data thus presented is comprehensive, reliable, and the result of extensive research, both primary and secondary.

INFORMATION SOURCES

Primary sources

  • Manufacturers and suppliers
  • Channel partners
  • Industry experts
  • Strategic decision makers

Secondary sources

  • Industry journals and periodicals
  • Government data
  • Financial reports of key industry players
  • Historical data
  • Press releases

DATA ANALYSIS

Data Synthesis

  • Collation of data
  • Estimation of key figures
  • Analysis of derived insights

Data Validation

  • Triangulation with data models
  • Reference against proprietary databases
  • Corroboration with industry experts

REPORT WRITING

Qualitative

  • Market drivers
  • Market challenges
  • Market trends
  • Five forces analysis

Quantitative

  • Market size and forecast
  • Market segmentation
  • Geographical insights
  • Competitive landscape

Interested in this report?

Get your sample now to see our research methodology and insights!

Download Now

Frequently Asked Questions

Smart Room Heater market growth will increase by USD 897.9 million during 2026-2030.

The Smart Room Heater market is expected to grow at a CAGR of 11.5% during 2026-2030.

Smart Room Heater market is segmented by Type (Without connectivity, With connectivity) Distribution channel (Offline, Online) Product type (Electric heaters, Gas heaters, Panel heaters, Infrared heaters, Smart thermostats and controls) Application (Residential, Non-residential)

Arovast Corp., Atomi Inc., Bromic Group, Chal Tec GmbH, DeLonghi Group, Dr. Infrared Heater, Dyson Ltd., Energy Wise Solutions, Glen Dimplex Group., Govee, Honeywell International Inc., Lasko Products LLC, Mill International AS, Pelonis Technologies Inc., Princess, STIEBEL ELTRON GmbH, TCL Industries Holdings Ltd., Tuya Inc, Vornado Air LLC, Xiaomi Corp. are a few of the key vendors in the Smart Room Heater market.

Europe will register the highest growth rate of 33.3% among the other regions. Therefore, the Smart Room Heater market in Europe is expected to garner significant business opportunities for the vendors during the forecast period.

Germany, UK, France, Italy, Spain, The Netherlands, US, Canada, Mexico, China, Japan, India, South Korea, Australia, Indonesia, Brazil, Argentina, Chile, Saudi Arabia, UAE, South Africa, Israel, Turkey

  • Rising demand for energy-efficient zone heating is the driving factor this market.

The Smart Room Heater market vendors should focus on grabbing business opportunities from the Type segment as it accounted for the largest market share in the base year.
RIA - Research AI Assistant
Ask RIA