Smartphone Power Management Integrated Circuit (IC) Market Analysis APAC, North America, Europe, Middle East and Africa, South America - US, Canada, China, South Korea, Japan - Size and Forecast 2024-2028

Smartphone Power Management Integrated Circuit (IC) Market Analysis APAC, North America, Europe, Middle East and Africa, South America - US, Canada, China, South Korea, Japan - Size and Forecast 2024-2028

Published: Apr 2024 185 Pages SKU: IRTNTR40145

Market Overview at a Glance

$887.02 Mn
Market Opportunity
6.07%
CAGR
5.48
YoY growth 2023-2024(%)

Smartphone Power Management IC Market Size 2024-2028

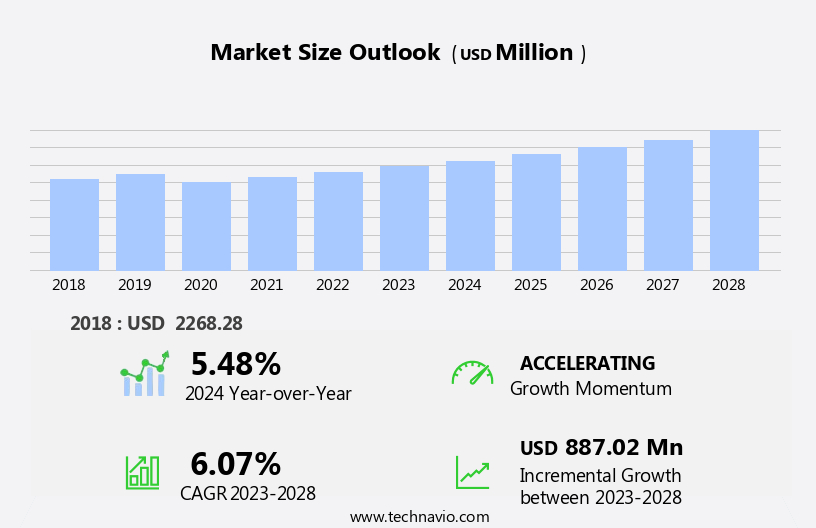
The smartphone power management ic market size is forecast to increase by USD 887.02 million at a CAGR of 6.07% between 2023 and 2028.

  • The market is experiencing significant growth due to several key trends. The increasing usage of smartphones for various applications, such as social media, streaming, and gaming, is leading to a surge in internet penetration and data traffic. This trend is driving the need for more efficient power management solutions to extend battery life and improve overall performance. Additionally, the miniaturization of semiconductor devices and the increasing complexity of power management IC design are presenting challenges for market participants. To address these challenges, companies are investing in research and development to create more advanced and power-efficient solutions. Overall, the market is expected to grow steadily In the coming years as the demand for longer battery life and more advanced features continues to increase.
  • What will be the Size of the Smartphone Power Management IC Market During the Forecast Period?

    Smartphone Power Management IC Market Size

     Request Free Sample

  • The market caters to the growing demand for longer battery life in electronic systems, including gadgets such as smartphones, tablets, smartwatches, and IoT devices. With the increasing prevalence of portable electronics, there is a heightened focus on power management chips to optimize electrical power flow and ensure voltage safety in battery-operated devices. These semiconductor components play a crucial role in managing power controls, voltage monitoring, and heat dissipation for various consumer electronic devices. The integration of next-gen mobile networks, such as 4G and 5G, into these devices further necessitates advanced power management solutions. Motor control ICs and low voltage regulators are essential components in this regard, as they enable efficient power usage and contribute to the overall performance of machine power and connected devices.
  • The market is expected to grow significantly due to the increasing popularity of mobile services and the integration of advanced power management technologies into an expanding array of consumer electronic devices.
  • How is this Smartphone Power Management IC Industry segmented and which is the largest segment?

    The smartphone power management ic industry research report provides comprehensive data (region-wise segment analysis), with forecasts and estimates in "USD million" for the period 2024-2028, as well as historical data from 2018-2022 for the following segments.

    • Price
      • Premium range
      • Medium range
      • Low range
    • Type
      • Integrated ASSP power management ICs
      • Battery management ICs
      • Others
    • Geography
      • APAC
        • China
        • Japan
        • South Korea
      • North America
        • Canada
        • US
      • Europe
        • Middle East and Africa
          • South America

          By Price Insights

          • The premium range segment is estimated to witness significant growth during the forecast period.

          Power management ICs play a crucial role In the efficient electrical power flow and power controls of various electronic systems, including portable electronics such as smartphones, tablets, smartwatches, IoT devices, and wearable electronics. These components ensure voltage safety, monitoring, and heat dissipation for battery-operated devices. Power management ICs are also integral to the operation of electric vehicles (EVs), renewable energy systems like solar and wind power, data centers, and automation in industries. They are essential for data processing, storage, and data security In these applications, emphasizing energy efficiency and integration with motor control ICs, low voltage regulators, and precision voltage references.

          Semiconductor companies produce these chips for various consumer electronic devices, automotive applications, and ODMs and OEMs, addressing the increasing demand for mobile services, next-generation mobile networks, and integration into various sectors. Power management ICs are a vital component In the electrical power flow of machines and devices, ensuring optimal performance and longevity.

          Smartphone Power Management IC Market Size

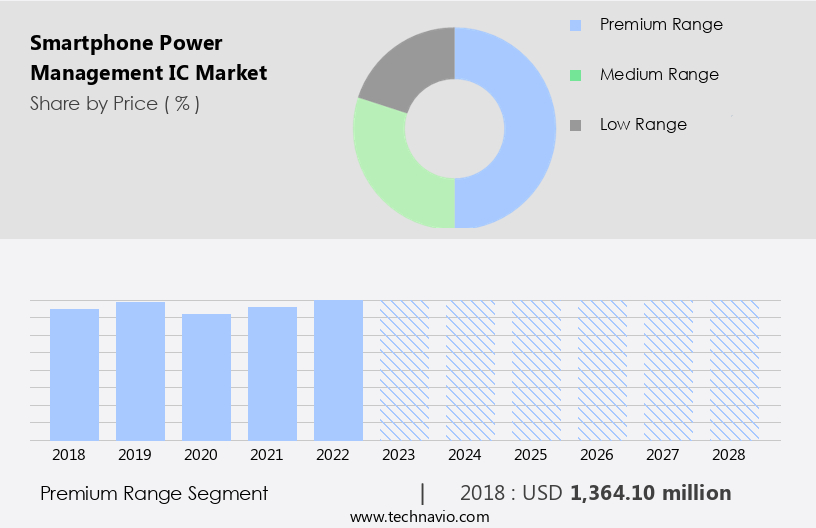
          Get a glance at the  Smartphone Power Management IC Industry report of share of various segments Request Free Sample

          The Premium range segment was valued at USD 1364.10 million in 2018 and showed a gradual increase during the forecast period.

          Regional Analysis

          • APAC is estimated to contribute 71% to the growth of the global market during the forecast period.

          Technavio’s analysts have elaborately explained the regional trends and drivers that shape the market during the forecast period.

          Smartphone Power Management IC Market Share by Geography

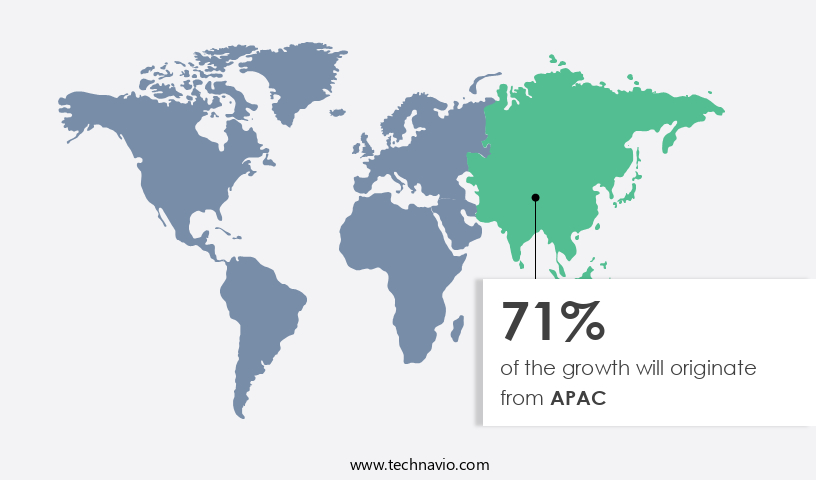
          For more insights on the market share of various regions, Request Free Sample

          The APAC market for power management ICs in portable electronics, including smartphones, tablets, smartwatches, IoT devices, and wearable electronics, is experiencing significant growth due to the increasing adoption of these devices In the region. Major manufacturers such as Samsung Electronics, Huawei Technologies, ZTE, OPPO, Xiaomi, and LG Electronics are based in APAC and are driving market growth through innovation. Advanced features like triple-lens cameras, AI, virtual assistants, fingerprint sensors, and facial recognition are becoming standard in new smartphone models. Power management ICs play a crucial role in managing electrical power flow, ensuring voltage safety, monitoring voltage levels, and facilitating heat dissipation In these battery-operated devices.

          Additionally, the integration of motor control ICs, low voltage regulators, automation, and data processing in various sectors such as electric vehicles, renewable energy, data centers, and automotive applications further boosts the demand for power management ICs. Energy efficiency, precision voltage references, and programmable voltage references are essential semiconductor components for power management ICs, ensuring optimal performance and longevity for consumer electronic devices and connected devices.

          Market Dynamics

          Our  researchers analyzed the data with 2023 as the base year, along with the key drivers, trends, and challenges. A holistic analysis of drivers will help companies refine their marketing strategies to gain a competitive advantage.

          What are the key market drivers leading to the rise In the adoption of Smartphone Power Management IC Industry?

          Growing internet penetration and data traffic is the key driver of the market.

        • The market for Power Management ICs (PMICs) in electronic systems, including smartphones, tablets, smartwatches, IoT devices, wearable electronics, electric vehicles (EVs), and data centers, is experiencing significant growth. With the increasing popularity of portable electronics and consumer electronic devices, the demand for PMICs that ensure energy efficiency, voltage safety, voltage monitoring, heat dissipation, and precision voltage references is escalating. The integration of machine power, motor control ICs, low voltage regulators, and automation in various applications is driving the market's growth. The expansion of next-generation mobile networks, such as 4G and 5G, is increasing the data processing requirements for these devices, leading to higher power consumption.
        • To address this challenge, PMICs are being integrated into battery-operated devices, including cell phones, to optimize electrical power flow and improve battery life. Renewable energy sources, such as solar and wind power, are also being utilized to power data centers and electric vehicles, necessitating advanced PMICs for efficient energy management. Moreover, the increasing adoption of connected devices and mobile services is driving the demand for PMICs in various applications. The semiconductor ICs used In these applications undergo a complex production process, and the ongoing chip shortage is impacting the market's growth. Despite these challenges, the market for Power Management ICs is expected to continue its upward trajectory, fueled by the increasing demand for energy-efficient and reliable power management solutions in various industries, including automotive, ODMs and OEMs.
        • What are the market trends shaping the Smartphone Power Management IC Industry?

          Miniaturization of semiconductor devices is the upcoming market trend.

        • The market is experiencing significant growth due to the increasing integration of advanced technologies in electronic systems, including gadgets such as smartphones, tablets, smartwatches, IoT devices, and wearable electronics, as well as renewable energy sources like solar and wind power for electronic devices. These battery-operated devices require efficient power management to extend battery life and ensure voltage safety, monitoring, and heat dissipation. Power management ICs, including voltage regulators and battery management ICs, play a crucial role in managing electrical power flow and controlling power consumption In these devices. Moreover, the increasing adoption of electric vehicles (EVs) and data centers for data processing, storage, and data security further boosts the demand for energy-efficient power management solutions.
        • The integration process of motor control ICs, low voltage regulators, and automation systems also necessitates the use of power management ICs. Semiconductor components, such as precision voltage references and programmable voltage references, are essential for maintaining optimal voltage levels and ensuring the reliable operation of these systems. As the use of consumer electronic devices, connected devices, and mobile services continues to expand, next-generation mobile networks, such as 4G and 5G, require advanced power management solutions to support the increased power demands. Power management ICs enable efficient power management and help reduce energy consumption, making them a critical component In the production of semiconductor ICs, including ODMs and OEMs.
        • However, the ongoing chip production and chip shortage pose challenges to the market's growth. In conclusion, the market is poised for growth due to the increasing demand for energy-efficient power management solutions in portable electronics, renewable energy systems, and automotive applications. Power management ICs play a vital role in managing electrical power flow, ensuring voltage safety, and minimizing energy consumption In these systems. The integration of advanced power management solutions will continue to drive innovation and efficiency In the electronics industry.
        • What challenges does the Smartphone Power Management IC Industry face during its growth?

          Increasing complexity of power management IC design is a key challenge affecting the industry growth.

        • Power management ICs have become essential components in various electronic systems, including gadgets such as smartphones, tablets, smartwatches, IoT devices, wearable electronics, and even electric vehicles (EVs). With the increasing demand for longer battery life in portable electronics and the integration of advanced features, power management ICs have evolved from simple voltage regulators to complex systems that ensure energy efficiency, voltage safety, voltage monitoring, heat dissipation, and precision voltage references. These chips are crucial for managing electrical power flow and power controls in battery-operated devices, enabling them to function optimally. The market for power management ICs is driven by the growing number of consumer electronic devices and connected devices that require efficient power management.
        • Next-gen mobile networks, such as 4G and 5G, and the integration of motor control ICs, low voltage regulators, automation, and data processing in various applications further fuel the demand for power management ICs. Energy efficiency is a critical factor in data centers, renewable energy systems, and data security, making power management ICs an indispensable part of these systems. The increasing complexity of power management ICs is due to the miniaturization of semiconductor components and the need to provide the right combination of voltage and current to different parts of applications. This complexity requires advanced chips, such as precision voltage references and programmable voltage references, to ensure optimal power management.
        • The power management IC market is expected to grow significantly In the coming years as the demand for energy-efficient and high-performance electronic systems continues to increase.
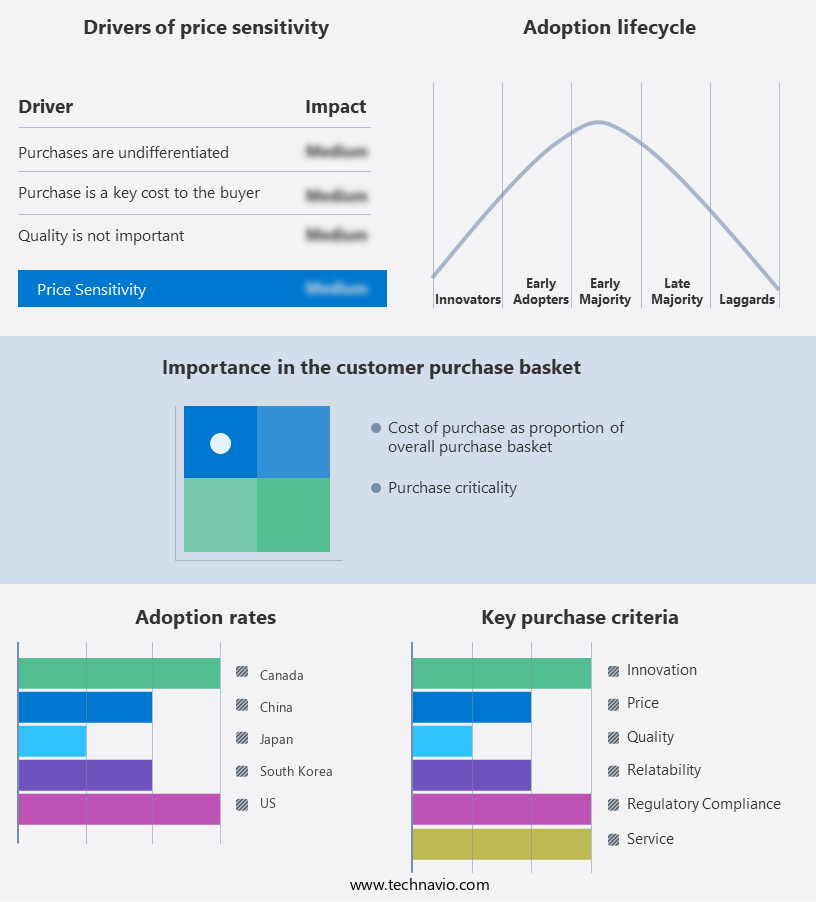
        • Exclusive Customer Landscape

          The smartphone power management ic market forecasting report includes the adoption lifecycle of the market, covering from the innovator’s stage to the laggard’s stage. It focuses on adoption rates in different regions based on penetration. Furthermore, the smartphone power management ic market report also includes key purchase criteria and drivers of price sensitivity to help companies evaluate and develop their market growth analysis strategies.

          Smartphone Power Management IC Market Share by Geography

           Customer Landscape

          Key Companies & Market Insights

          Companies are implementing various strategies, such as strategic alliances, smartphone power management ic market forecast, partnerships, mergers and acquisitions, geographical expansion, and product/service launches, to enhance their presence In the industry.

          Analog Devices Inc. - The company provides a range of power management integrated circuits (ICs) for smartphones, including uModule LED Drivers, µModule Buck Regulators, Battery Status Monitors, isoPower technology, and Xenon Photoflash Chargers. These advanced IC solutions ensure efficient power consumption, extended battery life, and optimal charging for various smartphone components. The offered technologies cater to diverse smartphone applications, enhancing overall system performance and user experience.

          The industry research and growth report includes detailed analyses of the competitive landscape of the market and information about key companies, including:

          • Analog Devices Inc.
          • Infineon Technologies AG
          • MagnaChip Semiconductor Corp.
          • MediaTek Inc.
          • Microchip Technology Inc.
          • Nisshinbo Holdings Inc.
          • NXP Semiconductors NV
          • ON Semiconductor Corp.
          • Qorvo Inc.
          • Qualcomm Inc.
          • Renesas Electronics Corp.
          • Richtek Technology Corp.
          • ROHM Co. Ltd.
          • Samsung Electronics Co. Ltd.
          • Semtech Corp.
          • STMicroelectronics International NV
          • Texas Instruments Inc.
          • Toshiba Corp.
          • Diodes Inc.

          Qualitative and quantitative analysis of companies has been conducted to help clients understand the wider business environment as well as the strengths and weaknesses of key industry players. Data is qualitatively analyzed to categorize companies as pure play, category-focused, industry-focused, and diversified; it is quantitatively analyzed to categorize companies as dominant, leading, strong, tentative, and weak.

          Research Analyst Overview

          The global market for power management integrated circuits (ICs) in electronic systems is experiencing significant growth due to the increasing demand for energy-efficient solutions in various applications. These applications include portable electronics such as smartphones, tablets, smartwatches, and IoT devices, as well as electric vehicles (EVs), renewable energy systems, data centers, and other battery-operated devices. Power management ICs play a crucial role in optimizing electrical power flow and ensuring voltage safety and monitoring In these systems. They are essential components in managing the power consumption of electronic devices, enabling longer battery life and improved performance. The integration of advanced features such as precision voltage references, programmable voltage references, and motor control ICs has further expanded the capabilities of power management ICs.

          These features enable more efficient power management in various applications, including automotive systems, consumer electronics, and industrial automation. The growing adoption of next-gen mobile networks, such as 4G and 5G, has also driven the demand for power management ICs in mobile services. The integration process of these networks requires efficient power management to ensure seamless connectivity and longer battery life for mobile devices. Moreover, the increasing focus on energy efficiency and the integration of renewable energy sources, such as solar and wind power, in various applications has further boosted the demand for power management ICs. These ICs help in managing the power flow from renewable sources and ensuring voltage stability and safety.

          The semiconductor industry is also witnessing a chip shortage, which has led to an increased focus on energy efficiency and power management in chip production. Power management ICs are essential components in optimizing the power consumption of semiconductor processes, enabling higher yields and reduced energy costs. Despite the challenges posed by the chip shortage and the ongoing trade tensions, the power management IC market is expected to continue its growth trajectory. The increasing demand for energy-efficient solutions and the continuous advancements in power management technology are expected to drive the market growth In the coming years. In conclusion, the power management IC market is witnessing significant growth due to the increasing demand for energy-efficient solutions in various applications.

          These applications include portable electronics, electric vehicles, renewable energy systems, data centers, and other battery-operated devices. Power management ICs play a crucial role in optimizing electrical power flow, ensuring voltage safety and monitoring, and improving overall system performance. The market is expected to continue its growth trajectory, driven by the increasing focus on energy efficiency and the continuous advancements in power management technology.

          Market Scope

          Report Coverage

          Details

          Page number

          185

          Base year

          2023

          Historic period

          2018-2022

          Forecast period

          2024-2028

          Growth momentum & CAGR

          Accelerate at a CAGR of 6.07%

          Market growth 2024-2028

          USD 887.02 million

          Market structure

          Fragmented

          YoY growth 2023-2024(%)

          5.48

          Key countries

          US, Canada, China, South Korea, and Japan

          Competitive landscape

          Leading Companies, Market Positioning of Companies, Competitive Strategies, and Industry Risks

          Request Free Sample

          What are the Key Data Covered in this Smartphone Power Management IC Market Research and Growth Report?

          • CAGR of the Smartphone Power Management IC industry during the forecast period
          • Detailed information on factors that will drive the growth and forecasting between 2024 and 2028
          • Precise estimation of the size of the market and its contribution of the industry in focus to the parent market
          • Accurate predictions about upcoming growth and trends and changes in consumer behaviour
          • Growth of the market across APAC, North America, Europe, Middle East and Africa, and South America
          • Thorough analysis of the market’s competitive landscape and detailed information about companies
          • Comprehensive analysis of factors that will challenge the smartphone power management ic market growth of industry companies

          We can help! Our analysts can customize this smartphone power management ic market research report to meet your requirements.

          Get in touch


          1 Executive Summary

          • 1.1 Market overview
            • Exhibit 01: Executive Summary – Chart on Market Overview
            • Exhibit 02: Executive Summary – Data Table on Market Overview
            • Exhibit 03: Executive Summary – Chart on Global Market Characteristics
            • Exhibit 04: Executive Summary – Chart on Market by Geography
            • Exhibit 05: Executive Summary – Chart on Market Segmentation by Price
            • Exhibit 06: Executive Summary – Chart on Market Segmentation by Type
            • Exhibit 07: Executive Summary – Chart on Incremental Growth
            • Exhibit 08: Executive Summary – Data Table on Incremental Growth
            • Exhibit 09: Executive Summary – Chart on Vendor Market Positioning

          2 Market Landscape

          • 2.1 Market ecosystem
            • Exhibit 10: Parent market
            • Exhibit 11: Market Characteristics

          3 Market Sizing

          • 3.1 Market definition
            • Exhibit 12: Offerings of vendors included in the market definition
          • 3.2 Market segment analysis
            • Exhibit 13: Market segments
          • 3.3 Market size 2023
            • 3.4 Market outlook: Forecast for 2023-2028
              • Exhibit 14: Chart on Global - Market size and forecast 2023-2028 ($ million)
              • Exhibit 15: Data Table on Global - Market size and forecast 2023-2028 ($ million)
              • Exhibit 16: Chart on Global Market: Year-over-year growth 2023-2028 (%)
              • Exhibit 17: Data Table on Global Market: Year-over-year growth 2023-2028 (%)

            4 Historic Market Size

            • 4.1 Global smartphone power management IC market 2018 - 2022
              • Exhibit 18: Historic Market Size – Data Table on global smartphone power management ic market 2018 - 2022 ($ million)
            • 4.2 Price Segment Analysis 2018 - 2022
              • Exhibit 19: Historic Market Size – Price Segment 2018 - 2022 ($ million)
            • 4.3 Type Segment Analysis 2018 - 2022
              • Exhibit 20: Historic Market Size – Type Segment 2018 - 2022 ($ million)
            • 4.4 Geography Segment Analysis 2018 - 2022
              • Exhibit 21: Historic Market Size – Geography Segment 2018 - 2022 ($ million)
            • 4.5 Country Segment Analysis 2018 - 2022
              • Exhibit 22: Historic Market Size – Country Segment 2018 - 2022 ($ million)

            5 Five Forces Analysis

            • 5.1 Five forces summary
              • Exhibit 23: Five forces analysis - Comparison between 2023 and 2028
            • 5.2 Bargaining power of buyers
              • Exhibit 24: Chart on Bargaining power of buyers – Impact of key factors 2023 and 2028
            • 5.3 Bargaining power of suppliers
              • Exhibit 25: Bargaining power of suppliers – Impact of key factors in 2023 and 2028
            • 5.4 Threat of new entrants
              • Exhibit 26: Threat of new entrants – Impact of key factors in 2023 and 2028
            • 5.5 Threat of substitutes
              • Exhibit 27: Threat of substitutes – Impact of key factors in 2023 and 2028
            • 5.6 Threat of rivalry
              • Exhibit 28: Threat of rivalry – Impact of key factors in 2023 and 2028
            • 5.7 Market condition
              • Exhibit 29: Chart on Market condition - Five forces 2023 and 2028

            6 Market Segmentation by Price

            • 6.1 Market segments
              • Exhibit 30: Chart on Price - Market share 2023-2028 (%)
              • Exhibit 31: Data Table on Price - Market share 2023-2028 (%)
            • 6.2 Comparison by Price
              • Exhibit 32: Chart on Comparison by Price
              • Exhibit 33: Data Table on Comparison by Price
            • 6.3 Premium range - Market size and forecast 2023-2028
              • Exhibit 34: Chart on Premium range - Market size and forecast 2023-2028 ($ million)
              • Exhibit 35: Data Table on Premium range - Market size and forecast 2023-2028 ($ million)
              • Exhibit 36: Chart on Premium range - Year-over-year growth 2023-2028 (%)
              • Exhibit 37: Data Table on Premium range - Year-over-year growth 2023-2028 (%)
            • 6.4 Medium range - Market size and forecast 2023-2028
              • Exhibit 38: Chart on Medium range - Market size and forecast 2023-2028 ($ million)
              • Exhibit 39: Data Table on Medium range - Market size and forecast 2023-2028 ($ million)
              • Exhibit 40: Chart on Medium range - Year-over-year growth 2023-2028 (%)
              • Exhibit 41: Data Table on Medium range - Year-over-year growth 2023-2028 (%)
            • 6.5 Low range - Market size and forecast 2023-2028
              • Exhibit 42: Chart on Low range - Market size and forecast 2023-2028 ($ million)
              • Exhibit 43: Data Table on Low range - Market size and forecast 2023-2028 ($ million)
              • Exhibit 44: Chart on Low range - Year-over-year growth 2023-2028 (%)
              • Exhibit 45: Data Table on Low range - Year-over-year growth 2023-2028 (%)
            • 6.6 Market opportunity by Price
              • Exhibit 46: Market opportunity by Price ($ million)
              • Exhibit 47: Data Table on Market opportunity by Price ($ million)

            7 Market Segmentation by Type

            • 7.1 Market segments
              • Exhibit 48: Chart on Type - Market share 2023-2028 (%)
              • Exhibit 49: Data Table on Type - Market share 2023-2028 (%)
            • 7.2 Comparison by Type
              • Exhibit 50: Chart on Comparison by Type
              • Exhibit 51: Data Table on Comparison by Type
            • 7.3 Integrated ASSP power management ICs - Market size and forecast 2023-2028
              • Exhibit 52: Chart on Integrated ASSP power management ICs - Market size and forecast 2023-2028 ($ million)
              • Exhibit 53: Data Table on Integrated ASSP power management ICs - Market size and forecast 2023-2028 ($ million)
              • Exhibit 54: Chart on Integrated ASSP power management ICs - Year-over-year growth 2023-2028 (%)
              • Exhibit 55: Data Table on Integrated ASSP power management ICs - Year-over-year growth 2023-2028 (%)
            • 7.4 Battery management ICs - Market size and forecast 2023-2028
              • Exhibit 56: Chart on Battery management ICs - Market size and forecast 2023-2028 ($ million)
              • Exhibit 57: Data Table on Battery management ICs - Market size and forecast 2023-2028 ($ million)
              • Exhibit 58: Chart on Battery management ICs - Year-over-year growth 2023-2028 (%)
              • Exhibit 59: Data Table on Battery management ICs - Year-over-year growth 2023-2028 (%)
            • 7.5 Others - Market size and forecast 2023-2028
              • Exhibit 60: Chart on Others - Market size and forecast 2023-2028 ($ million)
              • Exhibit 61: Data Table on Others - Market size and forecast 2023-2028 ($ million)
              • Exhibit 62: Chart on Others - Year-over-year growth 2023-2028 (%)
              • Exhibit 63: Data Table on Others - Year-over-year growth 2023-2028 (%)
            • 7.6 Market opportunity by Type
              • Exhibit 64: Market opportunity by Type ($ million)
              • Exhibit 65: Data Table on Market opportunity by Type ($ million)

            8 Customer Landscape

            • 8.1 Customer landscape overview
              • Exhibit 66: Analysis of price sensitivity, lifecycle, customer purchase basket, adoption rates, and purchase criteria

            9 Geographic Landscape

            • 9.1 Geographic segmentation
              • Exhibit 67: Chart on Market share by geography 2023-2028 (%)
              • Exhibit 68: Data Table on Market share by geography 2023-2028 (%)
            • 9.2 Geographic comparison
              • Exhibit 69: Chart on Geographic comparison
              • Exhibit 70: Data Table on Geographic comparison
            • 9.3 APAC - Market size and forecast 2023-2028
              • Exhibit 71: Chart on APAC - Market size and forecast 2023-2028 ($ million)
              • Exhibit 72: Data Table on APAC - Market size and forecast 2023-2028 ($ million)
              • Exhibit 73: Chart on APAC - Year-over-year growth 2023-2028 (%)
              • Exhibit 74: Data Table on APAC - Year-over-year growth 2023-2028 (%)
            • 9.4 North America - Market size and forecast 2023-2028
              • Exhibit 75: Chart on North America - Market size and forecast 2023-2028 ($ million)
              • Exhibit 76: Data Table on North America - Market size and forecast 2023-2028 ($ million)
              • Exhibit 77: Chart on North America - Year-over-year growth 2023-2028 (%)
              • Exhibit 78: Data Table on North America - Year-over-year growth 2023-2028 (%)
            • 9.5 Europe - Market size and forecast 2023-2028
              • Exhibit 79: Chart on Europe - Market size and forecast 2023-2028 ($ million)
              • Exhibit 80: Data Table on Europe - Market size and forecast 2023-2028 ($ million)
              • Exhibit 81: Chart on Europe - Year-over-year growth 2023-2028 (%)
              • Exhibit 82: Data Table on Europe - Year-over-year growth 2023-2028 (%)
            • 9.6 Middle East and Africa - Market size and forecast 2023-2028
              • Exhibit 83: Chart on Middle East and Africa - Market size and forecast 2023-2028 ($ million)
              • Exhibit 84: Data Table on Middle East and Africa - Market size and forecast 2023-2028 ($ million)
              • Exhibit 85: Chart on Middle East and Africa - Year-over-year growth 2023-2028 (%)
              • Exhibit 86: Data Table on Middle East and Africa - Year-over-year growth 2023-2028 (%)
            • 9.7 South America - Market size and forecast 2023-2028
              • Exhibit 87: Chart on South America - Market size and forecast 2023-2028 ($ million)
              • Exhibit 88: Data Table on South America - Market size and forecast 2023-2028 ($ million)
              • Exhibit 89: Chart on South America - Year-over-year growth 2023-2028 (%)
              • Exhibit 90: Data Table on South America - Year-over-year growth 2023-2028 (%)
            • 9.8 China - Market size and forecast 2023-2028
              • Exhibit 91: Chart on China - Market size and forecast 2023-2028 ($ million)
              • Exhibit 92: Data Table on China - Market size and forecast 2023-2028 ($ million)
              • Exhibit 93: Chart on China - Year-over-year growth 2023-2028 (%)
              • Exhibit 94: Data Table on China - Year-over-year growth 2023-2028 (%)
            • 9.9 South Korea - Market size and forecast 2023-2028
              • Exhibit 95: Chart on South Korea - Market size and forecast 2023-2028 ($ million)
              • Exhibit 96: Data Table on South Korea - Market size and forecast 2023-2028 ($ million)
              • Exhibit 97: Chart on South Korea - Year-over-year growth 2023-2028 (%)
              • Exhibit 98: Data Table on South Korea - Year-over-year growth 2023-2028 (%)
            • 9.10 US - Market size and forecast 2023-2028
              • Exhibit 99: Chart on US - Market size and forecast 2023-2028 ($ million)
              • Exhibit 100: Data Table on US - Market size and forecast 2023-2028 ($ million)
              • Exhibit 101: Chart on US - Year-over-year growth 2023-2028 (%)
              • Exhibit 102: Data Table on US - Year-over-year growth 2023-2028 (%)
            • 9.11 Japan - Market size and forecast 2023-2028
              • Exhibit 103: Chart on Japan - Market size and forecast 2023-2028 ($ million)
              • Exhibit 104: Data Table on Japan - Market size and forecast 2023-2028 ($ million)
              • Exhibit 105: Chart on Japan - Year-over-year growth 2023-2028 (%)
              • Exhibit 106: Data Table on Japan - Year-over-year growth 2023-2028 (%)
            • 9.12 Canada - Market size and forecast 2023-2028
              • Exhibit 107: Chart on Canada - Market size and forecast 2023-2028 ($ million)
              • Exhibit 108: Data Table on Canada - Market size and forecast 2023-2028 ($ million)
              • Exhibit 109: Chart on Canada - Year-over-year growth 2023-2028 (%)
              • Exhibit 110: Data Table on Canada - Year-over-year growth 2023-2028 (%)
            • 9.13 Market opportunity by geography
              • Exhibit 111: Market opportunity by geography ($ million)
              • Exhibit 112: Data Tables on Market opportunity by geography ($ million)

            10 Drivers, Challenges, and Trends

            • 10.1 Market drivers
              • 10.2 Market challenges
                • 10.3 Impact of drivers and challenges
                  • Exhibit 113: Impact of drivers and challenges in 2023 and 2028
                • 10.4 Market trends

                  11 Vendor Landscape

                  • 11.1 Overview
                    • 11.2 Vendor landscape
                      • Exhibit 114: Overview on Criticality of inputs and Factors of differentiation
                    • 11.3 Landscape disruption
                      • Exhibit 115: Overview on factors of disruption
                    • 11.4 Industry risks
                      • Exhibit 116: Impact of key risks on business

                    12 Vendor Analysis

                    • 12.1 Vendors covered
                      • Exhibit 117: Vendors covered
                    • 12.2 Market positioning of vendors
                      • Exhibit 118: Matrix on vendor position and classification
                    • 12.3 Analog Devices Inc.
                      • Exhibit 119: Analog Devices Inc. - Overview
                      • Exhibit 120: Analog Devices Inc. - Business segments
                      • Exhibit 121: Analog Devices Inc. - Key news
                      • Exhibit 122: Analog Devices Inc. - Key offerings
                      • Exhibit 123: Analog Devices Inc. - Segment focus
                    • 12.4 Diodes Inc.
                      • Exhibit 124: Diodes Inc. - Overview
                      • Exhibit 125: Diodes Inc. - Product / Service
                      • Exhibit 126: Diodes Inc. - Key news
                      • Exhibit 127: Diodes Inc. - Key offerings
                    • 12.5 Infineon Technologies AG
                      • Exhibit 128: Infineon Technologies AG - Overview
                      • Exhibit 129: Infineon Technologies AG - Business segments
                      • Exhibit 130: Infineon Technologies AG - Key news
                      • Exhibit 131: Infineon Technologies AG - Key offerings
                      • Exhibit 132: Infineon Technologies AG - Segment focus
                    • 12.6 MagnaChip Semiconductor Corp.
                      • Exhibit 133: MagnaChip Semiconductor Corp. - Overview
                      • Exhibit 134: MagnaChip Semiconductor Corp. - Product / Service
                      • Exhibit 135: MagnaChip Semiconductor Corp. - Key news
                      • Exhibit 136: MagnaChip Semiconductor Corp. - Key offerings
                    • 12.7 MediaTek Inc.
                      • Exhibit 137: MediaTek Inc. - Overview
                      • Exhibit 138: MediaTek Inc. - Product / Service
                      • Exhibit 139: MediaTek Inc. - Key offerings
                    • 12.8 Microchip Technology Inc.
                      • Exhibit 140: Microchip Technology Inc. - Overview
                      • Exhibit 141: Microchip Technology Inc. - Business segments
                      • Exhibit 142: Microchip Technology Inc. - Key news
                      • Exhibit 143: Microchip Technology Inc. - Key offerings
                      • Exhibit 144: Microchip Technology Inc. - Segment focus
                    • 12.9 Nisshinbo Holdings Inc.
                      • Exhibit 145: Nisshinbo Holdings Inc. - Overview
                      • Exhibit 146: Nisshinbo Holdings Inc. - Business segments
                      • Exhibit 147: Nisshinbo Holdings Inc. - Key offerings
                      • Exhibit 148: Nisshinbo Holdings Inc. - Segment focus
                    • 12.10 NXP Semiconductors NV
                      • Exhibit 149: NXP Semiconductors NV - Overview
                      • Exhibit 150: NXP Semiconductors NV - Product / Service
                      • Exhibit 151: NXP Semiconductors NV - Key news
                      • Exhibit 152: NXP Semiconductors NV - Key offerings
                    • 12.11 ON Semiconductor Corp.
                      • Exhibit 153: ON Semiconductor Corp. - Overview
                      • Exhibit 154: ON Semiconductor Corp. - Business segments
                      • Exhibit 155: ON Semiconductor Corp. - Key news
                      • Exhibit 156: ON Semiconductor Corp. - Key offerings
                      • Exhibit 157: ON Semiconductor Corp. - Segment focus
                    • 12.12 Qorvo Inc.
                      • Exhibit 158: Qorvo Inc. - Overview
                      • Exhibit 159: Qorvo Inc. - Business segments
                      • Exhibit 160: Qorvo Inc. - Key news
                      • Exhibit 161: Qorvo Inc. - Key offerings
                      • Exhibit 162: Qorvo Inc. - Segment focus
                    • 12.13 Qualcomm Inc.
                      • Exhibit 163: Qualcomm Inc. - Overview
                      • Exhibit 164: Qualcomm Inc. - Business segments
                      • Exhibit 165: Qualcomm Inc. - Key news
                      • Exhibit 166: Qualcomm Inc. - Key offerings
                      • Exhibit 167: Qualcomm Inc. - Segment focus
                    • 12.14 Renesas Electronics Corp.
                      • Exhibit 168: Renesas Electronics Corp. - Overview
                      • Exhibit 169: Renesas Electronics Corp. - Business segments
                      • Exhibit 170: Renesas Electronics Corp. - Key news
                      • Exhibit 171: Renesas Electronics Corp. - Key offerings
                      • Exhibit 172: Renesas Electronics Corp. - Segment focus
                    • 12.15 Samsung Electronics Co. Ltd.
                      • Exhibit 173: Samsung Electronics Co. Ltd. - Overview
                      • Exhibit 174: Samsung Electronics Co. Ltd. - Business segments
                      • Exhibit 175: Samsung Electronics Co. Ltd. - Key news
                      • Exhibit 176: Samsung Electronics Co. Ltd. - Key offerings
                      • Exhibit 177: Samsung Electronics Co. Ltd. - Segment focus
                    • 12.16 STMicroelectronics International NV
                      • Exhibit 178: STMicroelectronics International NV - Overview
                      • Exhibit 179: STMicroelectronics International NV - Business segments
                      • Exhibit 180: STMicroelectronics International NV - Key news
                      • Exhibit 181: STMicroelectronics International NV - Key offerings
                      • Exhibit 182: STMicroelectronics International NV - Segment focus
                    • 12.17 Texas Instruments Inc.
                      • Exhibit 183: Texas Instruments Inc. - Overview
                      • Exhibit 184: Texas Instruments Inc. - Business segments
                      • Exhibit 185: Texas Instruments Inc. - Key news
                      • Exhibit 186: Texas Instruments Inc. - Key offerings
                      • Exhibit 187: Texas Instruments Inc. - Segment focus

                    13 Appendix

                    • 13.1 Scope of the report
                      • 13.2 Inclusions and exclusions checklist
                        • Exhibit 188: Inclusions checklist
                        • Exhibit 189: Exclusions checklist
                      • 13.3 Currency conversion rates for US$
                        • Exhibit 190: Currency conversion rates for US$
                      • 13.4 Research methodology
                        • Exhibit 191: Research methodology
                        • Exhibit 192: Validation techniques employed for market sizing
                        • Exhibit 193: Information sources
                      • 13.5 List of abbreviations
                        • Exhibit 194: List of abbreviations

                      Research Methodology

                      Technavio presents a detailed picture of the market by way of study, synthesis, and summation of data from multiple sources. The analysts have presented the various facets of the market with a particular focus on identifying the key industry influencers. The data thus presented is comprehensive, reliable, and the result of extensive research, both primary and secondary.

                      INFORMATION SOURCES

                      Primary sources

                      • Manufacturers and suppliers
                      • Channel partners
                      • Industry experts
                      • Strategic decision makers

                      Secondary sources

                      • Industry journals and periodicals
                      • Government data
                      • Financial reports of key industry players
                      • Historical data
                      • Press releases

                      DATA ANALYSIS

                      Data Synthesis

                      • Collation of data
                      • Estimation of key figures
                      • Analysis of derived insights

                      Data Validation

                      • Triangulation with data models
                      • Reference against proprietary databases
                      • Corroboration with industry experts

                      REPORT WRITING

                      Qualitative

                      • Market drivers
                      • Market challenges
                      • Market trends
                      • Five forces analysis

                      Quantitative

                      • Market size and forecast
                      • Market segmentation
                      • Geographical insights
                      • Competitive landscape

                      Interested in this report?

                      Get your sample now to see our research methodology and insights!

                      Download Now

                      Frequently Asked Questions

                      Smartphone Power Management IC market growth will increase by $ 887.02 mn during 2024-2028.

                      The Smartphone Power Management IC market is expected to grow at a CAGR of 6.07% during 2024-2028.

                      Smartphone Power Management IC market is segmented by Price( Premium range, Medium range, Low range) Type( Integrated ASSP power management ICs, Battery management ICs, Others, Middle East and Africa, South America)

                      Analog Devices Inc., Infineon Technologies AG, MagnaChip Semiconductor Corp., MediaTek Inc., Microchip Technology Inc., Nisshinbo Holdings Inc., NXP Semiconductors NV, ON Semiconductor Corp., Qorvo Inc., Qualcomm Inc., Renesas Electronics Corp., Richtek Technology Corp., ROHM Co. Ltd., Samsung Electronics Co. Ltd., Semtech Corp., STMicroelectronics International NV, Texas Instruments Inc., Toshiba Corp., Diodes Inc. are a few of the key vendors in the Smartphone Power Management IC market.

                      APAC will register the highest growth rate of 71% among the other regions. Therefore, the Smartphone Power Management IC market in APAC is expected to garner significant business opportunities for the vendors during the forecast period.

                      US, Canada, China, South Korea, Japan

                      • Growing internet penetration and data trafficSmartphones incorporate various mobile applications related to social media is the driving factor this market.
                      • online video streaming is the driving factor this market.
                      • and video gaming. These applications account for a large amount of mobile data traffic. The growing investments in 4G/5G networks have significantly increased data transfer speeds and are also resulting in high Internet penetration. The smartphone Internet user penetration has increased in recent years is the driving factor this market.
                      • with more than 5 billion active internet users in 2023. The increasing use of social networking sites is leading to high data traffic. Consumers prefer to stay connected to the Internet for multiple purposes is the driving factor this market.
                      • such as accessing social networking sites is the driving factor this market.
                      • data synchronization is the driving factor this market.
                      • web browsing is the driving factor this market.
                      • checking emails is the driving factor this market.
                      • and using global positioning system (GPS) applications for navigation. The use of apps such as Facebook is the driving factor this market.
                      • Instagram is the driving factor this market.
                      • WhatsApp is the driving factor this market.
                      • Snapchat is the driving factor this market.
                      • and Twitter has grown significantly among consumers. As of October 2020 is the driving factor this market.
                      • almost 5 billion people were active social media users. There is an increasing awareness of and desire for the conveniences provided by smartphones as Internet penetration expands to new demographics and geographic areas. These gadgets act as portals to the Internet is the driving factor this market.
                      • giving users immediate access to communication tools is the driving factor this market.
                      • entertainment is the driving factor this market.
                      • and information. The increased demand for the Internet is especially noticeable in areas where Internet infrastructure is growing quickly is the driving factor this market.
                      • giving users who have limited connectivity more options.  All these factors indicate that users are spending more time on their smartphones. This can be substantiated by the fact that users in the US spent five to six hours on their smartphones on a daily basis in 2021. The increasing use of high-bandwidth applications is resulting in the need for energy-efficient and optimized power management systems. This is compelling smartphone original equipment manufacturers (OEMs) to integrate high-performance power management ICs due to high battery power consumption. The growing investment in 5G networks is expected to increase mobile data traffic during the forecast period. Hence is the driving factor this market.
                      • it is expected that the increasing Internet penetration and data traffic will have a positive impact on the growth of the global smartphone power management IC market during the forecast period. is the driving factor this market.

                      The Smartphone Power Management IC market vendors should focus on grabbing business opportunities from the Premium range segment as it accounted for the largest market share in the base year.
                      RIA - Research AI Assistant
                      Ask RIA