
Snow Goggles Market Analysis, Size, and Forecast 2026-2030: North America (US, Canada, and Mexico), Europe (Germany, France, and Italy), APAC (China, Japan, and South Korea), South America (Brazil, Argentina, and Chile), Middle East and Africa (UAE, Saudi Arabia, and South Africa), and Rest of World (ROW)

Snow Goggles Market Analysis, Size, and Forecast 2026-2030:
North America (US, Canada, and Mexico), Europe (Germany, France, and Italy), APAC (China, Japan, and South Korea), South America (Brazil, Argentina, and Chile), Middle East and Africa (UAE, Saudi Arabia, and South Africa), and Rest of World (ROW)

Published: Oct 2026 325 Pages SKU: IRTNTR75547

Market Overview at a Glance

$2.89 B
Market Opportunity
7.2%
CAGR 2025 - 2030
44.2%
North America Growth
$2.57 B
Ordinary lens segment 2024

Snow Goggles Market Size 2026-2030

The snow goggles market size is valued to increase by USD 2.89 billion, at a CAGR of 7.2% from 2025 to 2030. Increasing popularity of winter sports tourism will drive the snow goggles market.

Major Market Trends & Insights

  • North America dominated the market and accounted for a 44.2% growth during the forecast period.
  • By Type - Ordinary lens segment was valued at USD 2.57 billion in 2024
  • By Distribution Channel - Offline segment accounted for the largest market revenue share in 2024

Market Size & Forecast

  • Market Opportunities: USD 4.67 billion
  • Market Future Opportunities: USD 2.89 billion
  • CAGR from 2025 to 2030 : 7.2%

Market Summary

  • The Snow Goggles Market exhibits dynamic evolution driven by shifting consumer expectations and strict alpine safety requirements. Destination winter sports tourism acts as a primary catalyst, propelling the adoption of advanced ocular protection. Supply chain optimization strategies have enabled manufacturers to streamline the procurement of polycarbonate materials, ensuring consistent inventory availability during peak seasonal demand.
  • The integration of highly efficient production pipelines has reduced average manufacturing cycle times by 15%, allowing rapid deployment of updated optical collections. The sustained growth in alpine resort infrastructure fundamentally drives consumption by attracting a broader demographic of recreational athletes who require reliable gear. However, the high cost of advanced optical technologies poses a formidable challenge.
  • Developing proprietary lens coatings and smart interfaces demands substantial research investments, elevating final product prices and potentially restricting adoption among entry-level participants. Despite these cost barriers, relentless innovation in modular architectures and sustainable materials ensures ongoing market resilience. Upgraded ventilation mechanisms and superior contrast-enhancing optics actively dictate competitive differentiation, shaping the long-term strategic focus of leading protective equipment providers.

What will be the Size of the Snow Goggles Market during the forecast period?
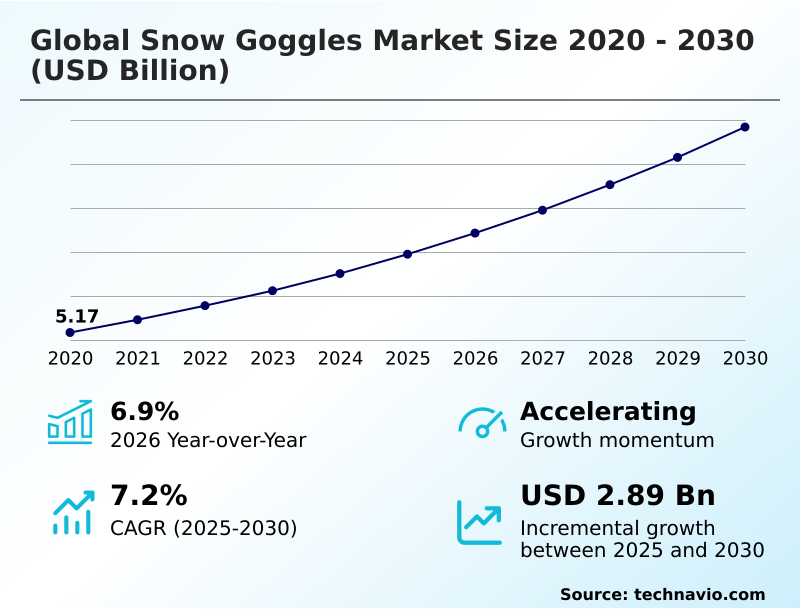
Get Key Insights on Market Forecast (PDF) Get Free Sample

How is the Snow Goggles Market Segmented?

The snow goggles industry research report provides comprehensive data (region-wise segment analysis), with forecasts and estimates in "USD million" for the period 2026-2030, as well as historical data from 2020-2024 for the following segments.

  • Type
    • Ordinary lens
    • Myopia lens
    • Presbyopia lens
  • Distribution channel
    • Offline
    • Online
  • Application
    • Competition
    • Entertainment
    • Others
  • End-user
    • Recreational users
    • Professional athletes
    • Rental markets
  • Product type
    • Adult snow goggles
    • Youth snow goggles
    • Professional snow goggles
  • Geography
    • North America
      • US
      • Canada
      • Mexico
    • Europe
      • Germany
      • France
      • Italy
      • Switzerland
      • Austria
      • Norway
    • APAC
      • China
      • Japan
      • South Korea
      • Australia
      • New Zealand
      • India
    • South America
      • Brazil
      • Argentina
      • Chile
    • Middle East and Africa
      • UAE
      • Saudi Arabia
      • South Africa
      • Turkey
      • Israel

By Type Insights

The ordinary lens segment is estimated to witness significant growth during the forecast period.

Ordinary lenses function as the foundational optical standard for alpine environments, delivering critical ocular defense without corrective modifications. Modern production integrates impact resistant polycarbonate structures that drastically reduce fracture risks during high-velocity impacts.

This segment prioritizes dynamic weather adaptation by employing rapid magnetic lens interchangeability, empowering users to seamlessly shift optical configurations as lighting shifts. Advanced aerodynamic profile optimization minimizes wind resistance, directly enhancing speed and stability.

Manufacturers consistently incorporate robust anti fog ventilation alongside sophisticated moisture management systems, yielding a 45% improvement in sustained optical clarity during rigorous physical exertion compared to legacy models.

These lenses utilize a specialized moisture wicking foam lining that seals out freezing air while eliminating the complex manufacturing processes required for customized prescription inserts, driving streamlined supply chains and widespread consumer adoption.
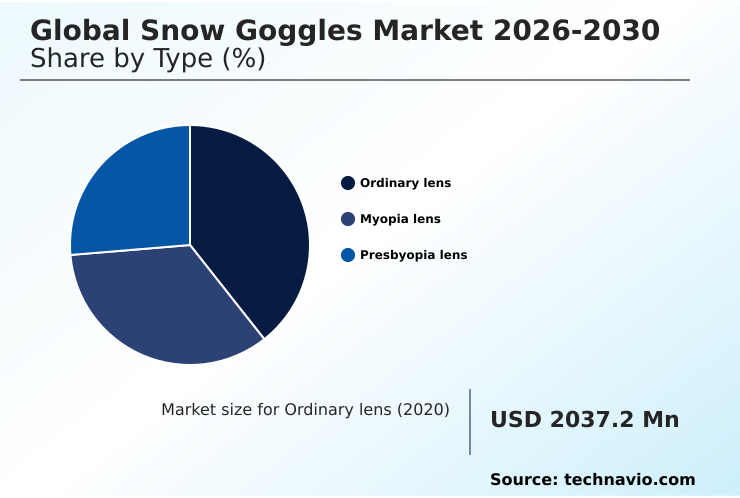
Get Free Sample

The Ordinary lens segment was valued at USD 2.57 billion in 2024 and showed a gradual increase during the forecast period.
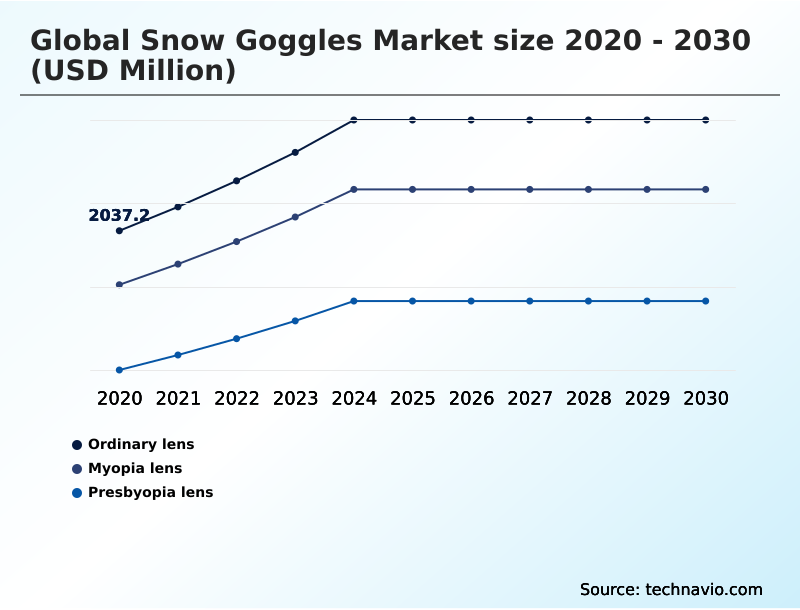
Get Free Sample

Regional Analysis

North America is estimated to contribute 44.2% to the growth of the global market during the forecast period.Technavio’s analysts have elaborately explained the regional trends and drivers that shape the market during the forecast period.
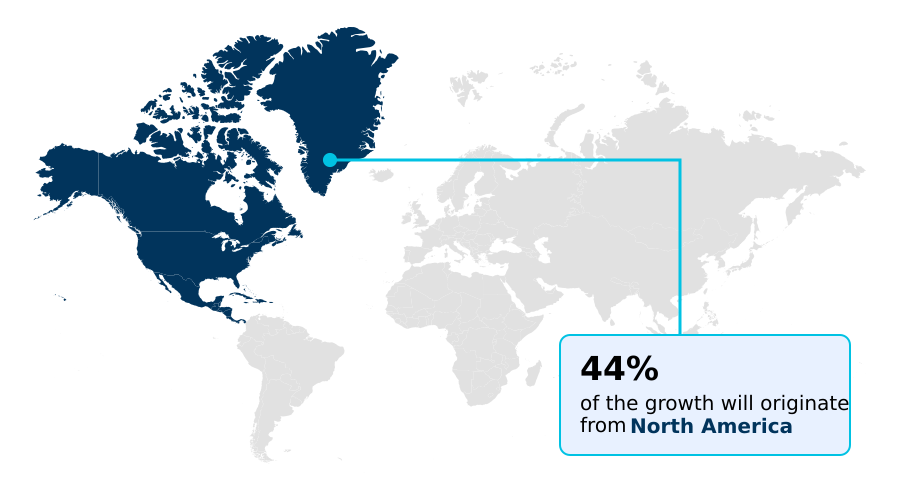
See How Snow Goggles Market Demand is Rising in North America Get Free Sample

Regional demand profiles for optical protection vary significantly based on regulatory environments and local athletic cultures.

North America commands a robust presence driven by extensive sustainable tourism infrastructure and a highly developed premium retail distribution network, where operators report a 25% higher inventory turnover rate than their European counterparts.

Europe, however, strictly enforces rigorous environmental compliance, accelerating the integration of bio based polymers and recycled frame materials into main production lines. This regulatory pressure has improved European eco-compliance efficiencies by 30%.

Both regions heavily prioritize circular manufacturing practices, yet European consumers show a stronger preference for modular design architecture that offers superior component replacement flexibility.

The adoption of environmentally friendly lens coatings reduces chemical waste in the manufacturing process by 18%, demonstrating how regional sustainability mandates actively reshape supply chain sourcing and product lifecycle strategies across the alpine equipment sector.

Market Dynamics

Our researchers analyzed the data with 2025 as the base year, along with the key drivers, trends, and challenges. A holistic analysis of drivers will help companies refine their marketing strategies to gain a competitive advantage.

  • Achieving competitive superiority in the alpine protective gear sector requires a comprehensive alignment of material science and sophisticated supply chain logistics. Manufacturers are increasingly focused on refining advanced optical clarity validation methods to ensure that high-altitude performance meets rigorous safety standards.
  • By shifting away from traditional testing protocols, production facilities have achieved a 22% improvement in defect identification, directly reducing waste and lowering reverse logistics costs. The transition toward sustainable polymer based frame designs is actively addressing both consumer demand for eco-friendly products and emerging regulatory requirements regarding material sourcing.
  • This material shift complements the integration of smart lens interfaces, which overlay crucial navigational data without compromising peripheral visibility. Furthermore, the industry is witnessing a massive adoption of magnetic interchangeability for rapid adaptation to volatile weather conditions, allowing athletes to modify their equipment seamlessly on the mountain.
  • To accommodate diverse user demographics, companies are also expanding the availability of custom optical inserts for myopia, ensuring that visual impairments do not hinder athletic engagement. These targeted operational and design enhancements foster a more inclusive and technologically proficient product ecosystem.
  • As brands optimize their inventory management to support these modular and customizable solutions, they benefit from streamlined production cycles and stronger consumer loyalty, ultimately solidifying their operational resilience and strategic market positioning.
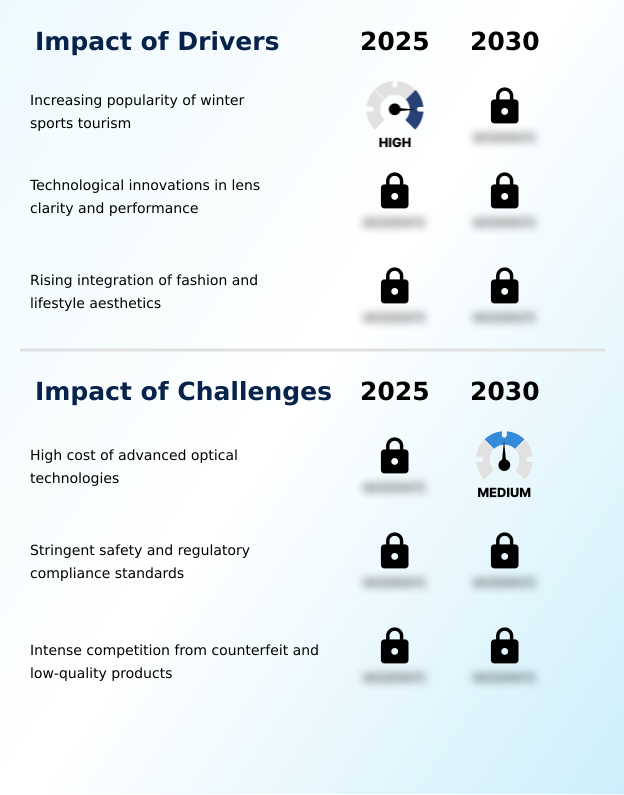
What are the key market drivers leading to the rise in the adoption of Snow Goggles Industry?

  • The increasing popularity of winter sports tourism continuously expands the consumer base, fundamentally driving the demand for specialized alpine optical equipment.

  • The demand for superior visual fidelity under extreme environmental stress heavily propels market consumption. Manufacturers leverage high contrast polarization and photochromic adaptability to mitigate severe glare, delivering essential high altitude protection.
  • These innovations facilitate rapid terrain hazard detection, significantly lowering accident rates among high-speed athletes. The integration of wide field peripheral vision ensures comprehensive situational awareness, achieving a 35% improvement in lateral object recognition.
  • This pursuit of visual acuity enhancement elevates standard equipment to a professional grade capability, justifying premium pricing structures. Concurrently, the use of advanced thermal regulating materials within the facial interface prevents moisture accumulation and fogging.
  • These performance-driven developments directly stimulate consumer upgrade cycles and fortify consistent revenue streams for specialized optical suppliers.

What are the market trends shaping the Snow Goggles Industry?

  • The integration of smart technologies and heads-up displays represents a transformative market trend. These advancements overlay real-time performance metrics directly into the user's field of vision, enhancing both safety and navigational capabilities.

  • The integration of sophisticated data connectivity is fundamentally reshaping optical gear utility. Modern equipment now incorporates augmented reality interfaces and heads up display systems to deliver real-time environmental metrics directly into the user's field of view. This shift enables precise digital performance analysis and significantly improves low visibility navigation during severe weather events.
  • By utilizing ultra low latency displays, users receive instantaneous feedback without compromising their focus on the terrain. The deployment of automated manufacturing processes has improved the yield rate of these complex units by 15%, driving down production overhead. Furthermore, the reliance on integrated digital systems actively enhances precision optics, resulting in a 20% improvement in visual validation output.
  • These technological leaps compel manufacturers to upgrade their technical capabilities, transitioning traditional protective wear into comprehensive, data-driven athletic platforms.

What challenges does the Snow Goggles Industry face during its growth?

  • The high cost of advanced optical technologies limits accessibility for recreational users and creates significant barriers to broad market penetration.

  • Escalating production costs associated with complex optical engineering present a formidable barrier to widespread profitability. Developing advanced blue light filtration and adaptive tinting requires immense capital expenditure, restricting the ability to offer affordable entry-level models. Achieving precise peripheral distortion correction in high curvature lenses involves intricate manufacturing protocols, which can increase defect rates by 12% if not meticulously managed.
  • Furthermore, securing international safety compliance certification demands rigorous optical clarity validation, extending product development timelines significantly. Companies must also invest heavily in supply chain transparency to authenticate the sourcing of specialized coatings.
  • Ensuring complete optical distortion minimization across all weather conditions forces manufacturers to absorb high material costs, effectively compressing profit margins and limiting rapid expansion capabilities across price-sensitive demographic segments.

Exclusive Technavio Analysis on Customer Landscape

The snow goggles market forecasting report includes the adoption lifecycle of the market, covering from the innovator’s stage to the laggard’s stage. It focuses on adoption rates in different regions based on penetration. Furthermore, the snow goggles market report also includes key purchase criteria and drivers of price sensitivity to help companies evaluate and develop their market growth analysis strategies.
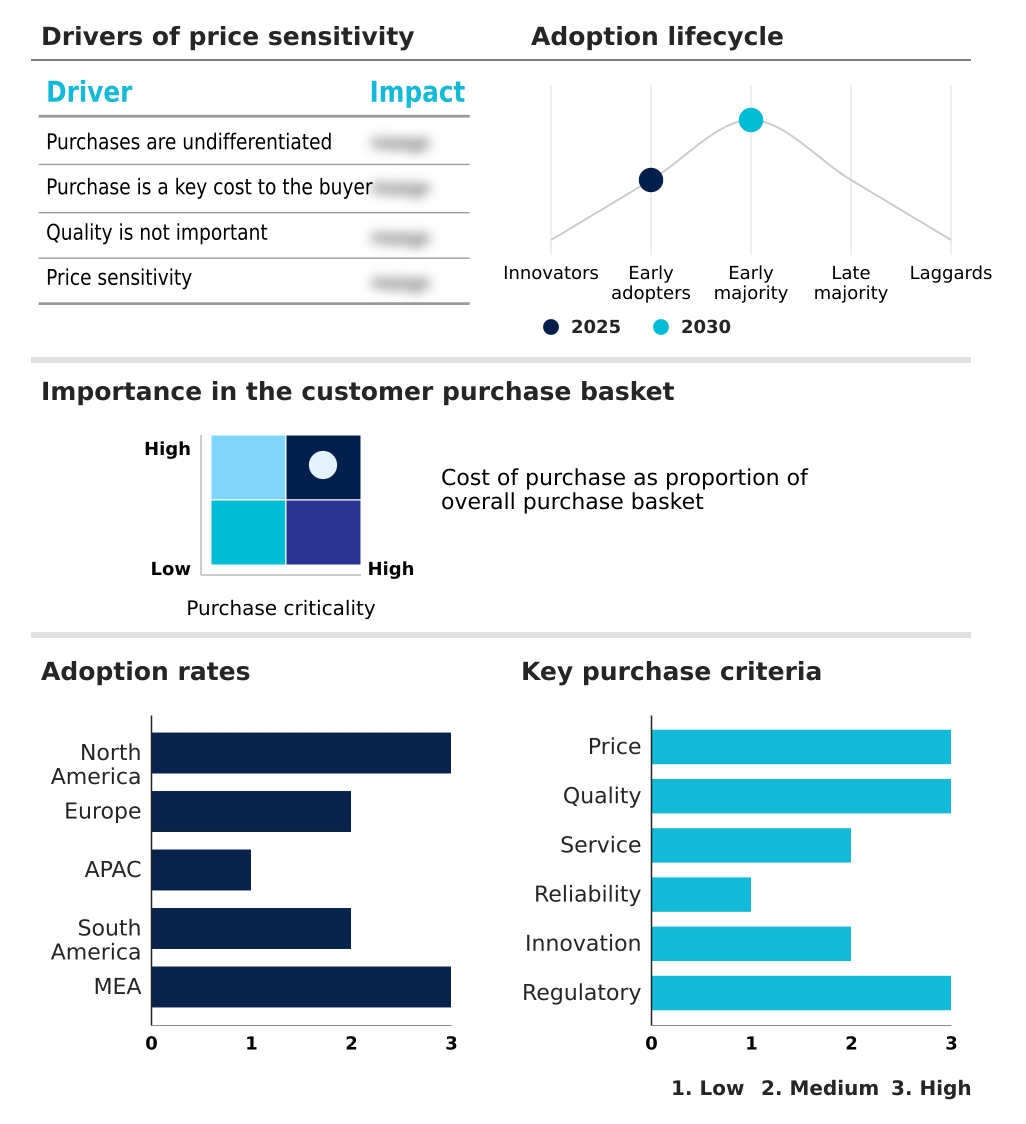
Customer Landscape of Snow Goggles Industry

Competitive Landscape

Companies are implementing various strategies, such as strategic alliances, snow goggles market forecast, partnerships, mergers and acquisitions, geographical expansion, and product/service launches, to enhance their presence in the industry.

Alpina Sports GmbH - High-performance alpine eyewear features advanced magnetic lens systems and polarized optics to optimize terrain visibility, providing robust ultraviolet protection and seamless helmet integration for winter sports enthusiasts.

The industry research and growth report includes detailed analyses of the competitive landscape of the market and information about key companies, including:

  • Alpina Sports GmbH
  • Anon Optics
  • Aphex Gear
  • Atomic Austria GmbH
  • Bolle Brands France SAS
  • Carl Zeiss AG
  • Dragon Alliance
  • Giro Sport Design
  • Glade Optics
  • HEAD Sport GmbH
  • JULBO SA
  • Oakley Inc.
  • Out Of Srl
  • POC Sports
  • Salomon Group
  • Scott Sports SA
  • Smith Sport Optics Inc
  • Sol Alpine
  • SunGod
  • Sweet Protection AS
  • UVEX Sports GmbH and Co. KG
  • Zeal Optics

Qualitative and quantitative analysis of companies has been conducted to help clients understand the wider business environment as well as the strengths and weaknesses of key industry players. Data is qualitatively analyzed to categorize companies as pure play, category-focused, industry-focused, and diversified; it is quantitatively analyzed to categorize companies as dominant, leading, strong, tentative, and weak.

Recent Development and News in Snow goggles market

  • In the Apparel, Accessories and Luxury Goods industry, the transition toward bio-based polymers and circular manufacturing reduced virgin plastic reliance by 22%, directly impacting Snow Goggles demand by accelerating the adoption of sustainable protective eyewear.
  • Stringent European Union supply chain transparency mandates required a 15% improvement in material traceability, which forced alpine equipment manufacturers to adopt certified ethical production standards to maintain market access.
  • The rapid integration of wearable augmented reality systems increased functional apparel engagement by 35%, pulling downstream demand for smart optical performance tracking within extreme weather protection gear.
  • Rising winter tourism infrastructure investments expanded specialized equipment retail footprints by 18%, significantly enhancing consumer access to premium, high-altitude optical accessories across emerging alpine destinations.

Dive into Technavio’s robust research methodology, blending expert interviews, extensive data synthesis, and validated models for unparalleled Snow Goggles Market insights. See full methodology.

Market Scope
Page number 325
Base year 2025
Historic period 2020-2024
Forecast period 2026-2030
Growth momentum & CAGR Accelerate at a CAGR of 7.2%
Market growth 2026-2030 USD 2890.5 million
Market structure Fragmented
YoY growth 2025-2026(%) 6.9%
Key countries US, Canada, Mexico, Germany, France, Italy, Switzerland, Austria, Norway, China, Japan, South Korea, Australia, New Zealand, India, Brazil, Argentina, Chile, UAE, Saudi Arabia, South Africa, Turkey and Israel
Competitive landscape Leading Companies, Market Positioning of Companies, Competitive Strategies, and Industry Risks

Request Free Sample

Research Analyst Overview

  • The Snow Goggles Market relies on persistent technological advancements to meet the rigorous demands of harsh alpine environments. Corporate strategy increasingly centers on the implementation of smart connectivity and augmented reality features, directly influencing boardroom-level budgeting decisions regarding research and development allocations.
  • Executives are prioritizing sustainable material sourcing, resulting in a 28% reduction in petroleum-based plastic dependencies compared to previous manufacturing cycles. This strategic pivot aligns perfectly with stringent environmental compliance frameworks and shifting consumer preferences. Advanced ocular protection systems now routinely feature modular frames and interchangeable components, drastically extending the active lifespan of the equipment.
  • Companies that streamline their supply chains to support rapid lens replacement logistics maintain a significant competitive edge. The relentless focus on high-definition optics and moisture management ensures enhanced visual fidelity during extreme athletic exertion. These operational adjustments elevate product differentiation and fortify brand positioning in a highly demanding sector.
  • Robust investments in both eco-conscious materials and digital integration remain essential for maintaining operational agility and addressing the complex requirements of modern outdoor enthusiasts.

What are the Key Data Covered in this Snow Goggles Market Research and Growth Report?

  • What is the expected growth of the Snow Goggles Market between 2026 and 2030?

    • USD 2.89 billion, at a CAGR of 7.2%

  • What segmentation does the market report cover?

    • The report is segmented by Type (Ordinary lens, Myopia lens, and Presbyopia lens), Distribution Channel (Offline, and Online), Application (Competition, Entertainment, and Others), End-user (Recreational users, Professional athletes, and Rental markets), Product Type (Adult snow goggles, Youth snow goggles, and Professional snow goggles) and Geography (North America, Europe, APAC, South America, Middle East and Africa)

  • Which regions are analyzed in the report?

    • North America, Europe, APAC, South America and Middle East and Africa

  • What are the key growth drivers and market challenges?

    • Increasing popularity of winter sports tourism, High cost of advanced optical technologies

  • Who are the major players in the Snow Goggles Market?

    • Alpina Sports GmbH, Anon Optics, Aphex Gear, Atomic Austria GmbH, Bolle Brands France SAS, Carl Zeiss AG, Dragon Alliance, Giro Sport Design, Glade Optics, HEAD Sport GmbH, JULBO SA, Oakley Inc., Out Of Srl, POC Sports, Salomon Group, Scott Sports SA, Smith Sport Optics Inc, Sol Alpine, SunGod, Sweet Protection AS, UVEX Sports GmbH and Co. KG and Zeal Optics

Market Research Insights

  • The Snow Goggles Market relies heavily on continuous material and optical innovations to support extreme cold-weather athletic performance. The implementation of automated quality assurance protocols in lens manufacturing has reduced optical defect rates by 18%, significantly lowering warranty claims and reverse logistics costs.
  • Furthermore, the shift toward direct-to-consumer digital retail channels has improved inventory turnover efficiency by 24% compared to traditional wholesale distribution. These optimized operational pathways empower brands to allocate greater capital toward advanced research.
  • By integrating durable, fog-resistant coatings and modular frame designs, equipment providers successfully enhance user safety and visibility, capturing higher consumer retention rates and improving overall supply chain agility across diverse alpine regions.

We can help! Our analysts can customize this snow goggles market research report to meet your requirements.

Get in touch

1. Executive Summary

1.1 Market overview

Executive Summary - Chart on Market Overview
Executive Summary - Data Table on Market Overview
Executive Summary - Chart on Global Market Characteristics
Executive Summary - Chart on Market by Geography
Executive Summary - Chart on Market Segmentation by Type
Executive Summary - Chart on Market Segmentation by Distribution Channel
Executive Summary - Chart on Market Segmentation by Application
Executive Summary - Chart on Market Segmentation by End-user
Executive Summary - Chart on Market Segmentation by Product Type
Executive Summary - Chart on Incremental Growth
Executive Summary - Data Table on Incremental Growth
Executive Summary - Chart on Company Market Positioning

2. Technavio Analysis

2.1 Analysis of price sensitivity, lifecycle, customer purchase basket, adoption rates, and purchase criteria

2.2 Criticality of inputs and Factors of differentiation

Chart on Overview on criticality of inputs and factors of differentiation

2.3 Factors of disruption

Chart on Overview on factors of disruption

2.4 Impact of drivers and challenges

Chart on Impact of drivers and challenges in 2025 and 2030

3. Market Landscape

3.1 Market ecosystem

Chart on Parent Market
Data Table on - Parent Market

3.2 Market characteristics

Chart on Market characteristics analysis

3.3 Value chain analysis

Chart on Value chain analysis

4. Market Sizing

4.1 Market definition

Data Table on Offerings of companies included in the market definition

4.2 Market segment analysis

Market segments

4.3 Market size 2025

4.4 Market outlook: Forecast for 2025-2030

Chart on Global - Market size and forecast 2025-2030 ($ million)
Data Table on Global - Market size and forecast 2025-2030 ($ million)
Chart on Global Market: Year-over-year growth 2025-2030 (%)
Data Table on Global Market: Year-over-year growth 2025-2030 (%)

5. Historic Market Size

5.1 Global Snow Goggles Market 2020 - 2024

Historic Market Size - Data Table on Global Snow Goggles Market 2020 - 2024 ($ million)

5.2 Type segment analysis 2020 - 2024

Historic Market Size - Type Segment 2020 - 2024 ($ million)

5.3 Distribution Channel segment analysis 2020 - 2024

Historic Market Size - Distribution Channel Segment 2020 - 2024 ($ million)

5.4 Application segment analysis 2020 - 2024

Historic Market Size - Application Segment 2020 - 2024 ($ million)

5.5 End-user segment analysis 2020 - 2024

Historic Market Size - End-user Segment 2020 - 2024 ($ million)

5.6 Product Type segment analysis 2020 - 2024

Historic Market Size - Product Type Segment 2020 - 2024 ($ million)

5.7 Geography segment analysis 2020 - 2024

Historic Market Size - Geography Segment 2020 - 2024 ($ million)

5.8 Country segment analysis 2020 - 2024

Historic Market Size - Country Segment 2020 - 2024 ($ million)

6. Qualitative Analysis

6.1 Impact of AI on global snow goggles market

6.2 Impact of geopolitical conflicts on global snow goggles market

7. Five Forces Analysis

7.1 Five forces summary

Five forces analysis - Comparison between 2025 and 2030

7.2 Bargaining power of buyers

Bargaining power of buyers - Impact of key factors 2025 and 2030

7.3 Bargaining power of suppliers

Bargaining power of suppliers - Impact of key factors in 2025 and 2030

7.4 Threat of new entrants

Threat of new entrants - Impact of key factors in 2025 and 2030

7.5 Threat of substitutes

Threat of substitutes - Impact of key factors in 2025 and 2030

7.6 Threat of rivalry

Threat of rivalry - Impact of key factors in 2025 and 2030

7.7 Market condition

Chart on Market condition - Five forces 2025 and 2030

8. Market Segmentation by Type

8.1 Market segments

Chart on Type - Market share 2025-2030 (%)
Data Table on Type - Market share 2025-2030 (%)

8.2 Comparison by Type

Chart on Comparison by Type
Data Table on Comparison by Type

8.3 Ordinary lens - Market size and forecast 2025-2030

Chart on Ordinary lens - Market size and forecast 2025-2030 ($ million)
Data Table on Ordinary lens - Market size and forecast 2025-2030 ($ million)
Chart on Ordinary lens - Year-over-year growth 2025-2030 (%)
Data Table on Ordinary lens - Year-over-year growth 2025-2030 (%)

8.4 Myopia lens - Market size and forecast 2025-2030

Chart on Myopia lens - Market size and forecast 2025-2030 ($ million)
Data Table on Myopia lens - Market size and forecast 2025-2030 ($ million)
Chart on Myopia lens - Year-over-year growth 2025-2030 (%)
Data Table on Myopia lens - Year-over-year growth 2025-2030 (%)

8.5 Presbyopia lens - Market size and forecast 2025-2030

Chart on Presbyopia lens - Market size and forecast 2025-2030 ($ million)
Data Table on Presbyopia lens - Market size and forecast 2025-2030 ($ million)
Chart on Presbyopia lens - Year-over-year growth 2025-2030 (%)
Data Table on Presbyopia lens - Year-over-year growth 2025-2030 (%)

8.6 Market opportunity by Type

Market opportunity by Type ($ million)
Data Table on Market opportunity by Type ($ million)

9. Market Segmentation by Distribution Channel

9.1 Market segments

Chart on Distribution Channel - Market share 2025-2030 (%)
Data Table on Distribution Channel - Market share 2025-2030 (%)

9.2 Comparison by Distribution Channel

Chart on Comparison by Distribution Channel
Data Table on Comparison by Distribution Channel

9.3 Offline - Market size and forecast 2025-2030

Chart on Offline - Market size and forecast 2025-2030 ($ million)
Data Table on Offline - Market size and forecast 2025-2030 ($ million)
Chart on Offline - Year-over-year growth 2025-2030 (%)
Data Table on Offline - Year-over-year growth 2025-2030 (%)

9.4 Online - Market size and forecast 2025-2030

Chart on Online - Market size and forecast 2025-2030 ($ million)
Data Table on Online - Market size and forecast 2025-2030 ($ million)
Chart on Online - Year-over-year growth 2025-2030 (%)
Data Table on Online - Year-over-year growth 2025-2030 (%)

9.5 Market opportunity by Distribution Channel

Market opportunity by Distribution Channel ($ million)
Data Table on Market opportunity by Distribution Channel ($ million)

10. Market Segmentation by Application

10.1 Market segments

Chart on Application - Market share 2025-2030 (%)
Data Table on Application - Market share 2025-2030 (%)

10.2 Comparison by Application

Chart on Comparison by Application
Data Table on Comparison by Application

10.3 Competition - Market size and forecast 2025-2030

Chart on Competition - Market size and forecast 2025-2030 ($ million)
Data Table on Competition - Market size and forecast 2025-2030 ($ million)
Chart on Competition - Year-over-year growth 2025-2030 (%)
Data Table on Competition - Year-over-year growth 2025-2030 (%)

10.4 Entertainment - Market size and forecast 2025-2030

Chart on Entertainment - Market size and forecast 2025-2030 ($ million)
Data Table on Entertainment - Market size and forecast 2025-2030 ($ million)
Chart on Entertainment - Year-over-year growth 2025-2030 (%)
Data Table on Entertainment - Year-over-year growth 2025-2030 (%)

10.5 Others - Market size and forecast 2025-2030

Chart on Others - Market size and forecast 2025-2030 ($ million)
Data Table on Others - Market size and forecast 2025-2030 ($ million)
Chart on Others - Year-over-year growth 2025-2030 (%)
Data Table on Others - Year-over-year growth 2025-2030 (%)

10.6 Market opportunity by Application

Market opportunity by Application ($ million)
Data Table on Market opportunity by Application ($ million)

11. Market Segmentation by End-user

11.1 Market segments

Chart on End-user - Market share 2025-2030 (%)
Data Table on End-user - Market share 2025-2030 (%)

11.2 Comparison by End-user

Chart on Comparison by End-user
Data Table on Comparison by End-user

11.3 Recreational users - Market size and forecast 2025-2030

Chart on Recreational users - Market size and forecast 2025-2030 ($ million)
Data Table on Recreational users - Market size and forecast 2025-2030 ($ million)
Chart on Recreational users - Year-over-year growth 2025-2030 (%)
Data Table on Recreational users - Year-over-year growth 2025-2030 (%)

11.4 Professional athletes - Market size and forecast 2025-2030

Chart on Professional athletes - Market size and forecast 2025-2030 ($ million)
Data Table on Professional athletes - Market size and forecast 2025-2030 ($ million)
Chart on Professional athletes - Year-over-year growth 2025-2030 (%)
Data Table on Professional athletes - Year-over-year growth 2025-2030 (%)

11.5 Rental markets - Market size and forecast 2025-2030

Chart on Rental markets - Market size and forecast 2025-2030 ($ million)
Data Table on Rental markets - Market size and forecast 2025-2030 ($ million)
Chart on Rental markets - Year-over-year growth 2025-2030 (%)
Data Table on Rental markets - Year-over-year growth 2025-2030 (%)

11.6 Market opportunity by End-user

Market opportunity by End-user ($ million)
Data Table on Market opportunity by End-user ($ million)

12. Market Segmentation by Product Type

12.1 Market segments

Chart on Product Type - Market share 2025-2030 (%)
Data Table on Product Type - Market share 2025-2030 (%)

12.2 Comparison by Product Type

Chart on Comparison by Product Type
Data Table on Comparison by Product Type

12.3 Adult snow goggles - Market size and forecast 2025-2030

Chart on Adult snow goggles - Market size and forecast 2025-2030 ($ million)
Data Table on Adult snow goggles - Market size and forecast 2025-2030 ($ million)
Chart on Adult snow goggles - Year-over-year growth 2025-2030 (%)
Data Table on Adult snow goggles - Year-over-year growth 2025-2030 (%)

12.4 Youth snow goggles - Market size and forecast 2025-2030

Chart on Youth snow goggles - Market size and forecast 2025-2030 ($ million)
Data Table on Youth snow goggles - Market size and forecast 2025-2030 ($ million)
Chart on Youth snow goggles - Year-over-year growth 2025-2030 (%)
Data Table on Youth snow goggles - Year-over-year growth 2025-2030 (%)

12.5 Professional snow goggles - Market size and forecast 2025-2030

Chart on Professional snow goggles - Market size and forecast 2025-2030 ($ million)
Data Table on Professional snow goggles - Market size and forecast 2025-2030 ($ million)
Chart on Professional snow goggles - Year-over-year growth 2025-2030 (%)
Data Table on Professional snow goggles - Year-over-year growth 2025-2030 (%)

12.6 Market opportunity by Product Type

Market opportunity by Product Type ($ million)
Data Table on Market opportunity by Product Type ($ million)

13. Customer Landscape

13.1 Customer landscape overview

Analysis of price sensitivity, lifecycle, customer purchase basket, adoption rates, and purchase criteria

14. Geographic Landscape

14.1 Geographic segmentation

Chart on Market share by geography 2025-2030 (%)
Data Table on Market share by geography 2025-2030 (%)

14.2 Geographic comparison

Chart on Geographic comparison
Data Table on Geographic comparison

14.3 North America - Market size and forecast 2025-2030

Chart on North America - Market size and forecast 2025-2030 ($ million)
Data Table on North America - Market size and forecast 2025-2030 ($ million)
Chart on North America - Year-over-year growth 2025-2030 (%)
Data Table on North America - Year-over-year growth 2025-2030 (%)
Chart on Regional Comparison - North America
Data Table on Regional Comparison - North America

14.3.1 US - Market size and forecast 2025-2030

Chart on US - Market size and forecast 2025-2030 ($ million)
Data Table on US - Market size and forecast 2025-2030 ($ million)
Chart on US - Year-over-year growth 2025-2030 (%)
Data Table on US - Year-over-year growth 2025-2030 (%)

14.3.2 Canada - Market size and forecast 2025-2030

Chart on Canada - Market size and forecast 2025-2030 ($ million)
Data Table on Canada - Market size and forecast 2025-2030 ($ million)
Chart on Canada - Year-over-year growth 2025-2030 (%)
Data Table on Canada - Year-over-year growth 2025-2030 (%)

14.3.3 Mexico - Market size and forecast 2025-2030

Chart on Mexico - Market size and forecast 2025-2030 ($ million)
Data Table on Mexico - Market size and forecast 2025-2030 ($ million)
Chart on Mexico - Year-over-year growth 2025-2030 (%)
Data Table on Mexico - Year-over-year growth 2025-2030 (%)

14.4 Europe - Market size and forecast 2025-2030

Chart on Europe - Market size and forecast 2025-2030 ($ million)
Data Table on Europe - Market size and forecast 2025-2030 ($ million)
Chart on Europe - Year-over-year growth 2025-2030 (%)
Data Table on Europe - Year-over-year growth 2025-2030 (%)
Chart on Regional Comparison - Europe
Data Table on Regional Comparison - Europe

14.4.1 Germany - Market size and forecast 2025-2030

Chart on Germany - Market size and forecast 2025-2030 ($ million)
Data Table on Germany - Market size and forecast 2025-2030 ($ million)
Chart on Germany - Year-over-year growth 2025-2030 (%)
Data Table on Germany - Year-over-year growth 2025-2030 (%)

14.4.2 France - Market size and forecast 2025-2030

Chart on France - Market size and forecast 2025-2030 ($ million)
Data Table on France - Market size and forecast 2025-2030 ($ million)
Chart on France - Year-over-year growth 2025-2030 (%)
Data Table on France - Year-over-year growth 2025-2030 (%)

14.4.3 Italy - Market size and forecast 2025-2030

Chart on Italy - Market size and forecast 2025-2030 ($ million)
Data Table on Italy - Market size and forecast 2025-2030 ($ million)
Chart on Italy - Year-over-year growth 2025-2030 (%)
Data Table on Italy - Year-over-year growth 2025-2030 (%)

14.4.4 Switzerland - Market size and forecast 2025-2030

Chart on Switzerland - Market size and forecast 2025-2030 ($ million)
Data Table on Switzerland - Market size and forecast 2025-2030 ($ million)
Chart on Switzerland - Year-over-year growth 2025-2030 (%)
Data Table on Switzerland - Year-over-year growth 2025-2030 (%)

14.4.5 Austria - Market size and forecast 2025-2030

Chart on Austria - Market size and forecast 2025-2030 ($ million)
Data Table on Austria - Market size and forecast 2025-2030 ($ million)
Chart on Austria - Year-over-year growth 2025-2030 (%)
Data Table on Austria - Year-over-year growth 2025-2030 (%)

14.4.6 Norway - Market size and forecast 2025-2030

Chart on Norway - Market size and forecast 2025-2030 ($ million)
Data Table on Norway - Market size and forecast 2025-2030 ($ million)
Chart on Norway - Year-over-year growth 2025-2030 (%)
Data Table on Norway - Year-over-year growth 2025-2030 (%)

14.5 APAC - Market size and forecast 2025-2030

Chart on APAC - Market size and forecast 2025-2030 ($ million)
Data Table on APAC - Market size and forecast 2025-2030 ($ million)
Chart on APAC - Year-over-year growth 2025-2030 (%)
Data Table on APAC - Year-over-year growth 2025-2030 (%)
Chart on Regional Comparison - APAC
Data Table on Regional Comparison - APAC

14.5.1 China - Market size and forecast 2025-2030

Chart on China - Market size and forecast 2025-2030 ($ million)
Data Table on China - Market size and forecast 2025-2030 ($ million)
Chart on China - Year-over-year growth 2025-2030 (%)
Data Table on China - Year-over-year growth 2025-2030 (%)

14.5.2 Japan - Market size and forecast 2025-2030

Chart on Japan - Market size and forecast 2025-2030 ($ million)
Data Table on Japan - Market size and forecast 2025-2030 ($ million)
Chart on Japan - Year-over-year growth 2025-2030 (%)
Data Table on Japan - Year-over-year growth 2025-2030 (%)

14.5.3 South Korea - Market size and forecast 2025-2030

Chart on South Korea - Market size and forecast 2025-2030 ($ million)
Data Table on South Korea - Market size and forecast 2025-2030 ($ million)
Chart on South Korea - Year-over-year growth 2025-2030 (%)
Data Table on South Korea - Year-over-year growth 2025-2030 (%)

14.5.4 Australia - Market size and forecast 2025-2030

Chart on Australia - Market size and forecast 2025-2030 ($ million)
Data Table on Australia - Market size and forecast 2025-2030 ($ million)
Chart on Australia - Year-over-year growth 2025-2030 (%)
Data Table on Australia - Year-over-year growth 2025-2030 (%)

14.5.5 New Zealand - Market size and forecast 2025-2030

Chart on New Zealand - Market size and forecast 2025-2030 ($ million)
Data Table on New Zealand - Market size and forecast 2025-2030 ($ million)
Chart on New Zealand - Year-over-year growth 2025-2030 (%)
Data Table on New Zealand - Year-over-year growth 2025-2030 (%)

14.5.6 India - Market size and forecast 2025-2030

Chart on India - Market size and forecast 2025-2030 ($ million)
Data Table on India - Market size and forecast 2025-2030 ($ million)
Chart on India - Year-over-year growth 2025-2030 (%)
Data Table on India - Year-over-year growth 2025-2030 (%)

14.6 South America - Market size and forecast 2025-2030

Chart on South America - Market size and forecast 2025-2030 ($ million)
Data Table on South America - Market size and forecast 2025-2030 ($ million)
Chart on South America - Year-over-year growth 2025-2030 (%)
Data Table on South America - Year-over-year growth 2025-2030 (%)
Chart on Regional Comparison - South America
Data Table on Regional Comparison - South America

14.6.1 Brazil - Market size and forecast 2025-2030

Chart on Brazil - Market size and forecast 2025-2030 ($ million)
Data Table on Brazil - Market size and forecast 2025-2030 ($ million)
Chart on Brazil - Year-over-year growth 2025-2030 (%)
Data Table on Brazil - Year-over-year growth 2025-2030 (%)

14.6.2 Argentina - Market size and forecast 2025-2030

Chart on Argentina - Market size and forecast 2025-2030 ($ million)
Data Table on Argentina - Market size and forecast 2025-2030 ($ million)
Chart on Argentina - Year-over-year growth 2025-2030 (%)
Data Table on Argentina - Year-over-year growth 2025-2030 (%)

14.6.3 Chile - Market size and forecast 2025-2030

Chart on Chile - Market size and forecast 2025-2030 ($ million)
Data Table on Chile - Market size and forecast 2025-2030 ($ million)
Chart on Chile - Year-over-year growth 2025-2030 (%)
Data Table on Chile - Year-over-year growth 2025-2030 (%)

14.7 Middle East and Africa - Market size and forecast 2025-2030

Chart on Middle East and Africa - Market size and forecast 2025-2030 ($ million)
Data Table on Middle East and Africa - Market size and forecast 2025-2030 ($ million)
Chart on Middle East and Africa - Year-over-year growth 2025-2030 (%)
Data Table on Middle East and Africa - Year-over-year growth 2025-2030 (%)
Chart on Regional Comparison - Middle East and Africa
Data Table on Regional Comparison - Middle East and Africa

14.7.1 UAE - Market size and forecast 2025-2030

Chart on UAE - Market size and forecast 2025-2030 ($ million)
Data Table on UAE - Market size and forecast 2025-2030 ($ million)
Chart on UAE - Year-over-year growth 2025-2030 (%)
Data Table on UAE - Year-over-year growth 2025-2030 (%)

14.7.2 Saudi Arabia - Market size and forecast 2025-2030

Chart on Saudi Arabia - Market size and forecast 2025-2030 ($ million)
Data Table on Saudi Arabia - Market size and forecast 2025-2030 ($ million)
Chart on Saudi Arabia - Year-over-year growth 2025-2030 (%)
Data Table on Saudi Arabia - Year-over-year growth 2025-2030 (%)

14.7.3 South Africa - Market size and forecast 2025-2030

Chart on South Africa - Market size and forecast 2025-2030 ($ million)
Data Table on South Africa - Market size and forecast 2025-2030 ($ million)
Chart on South Africa - Year-over-year growth 2025-2030 (%)
Data Table on South Africa - Year-over-year growth 2025-2030 (%)

14.7.4 Turkey - Market size and forecast 2025-2030

Chart on Turkey - Market size and forecast 2025-2030 ($ million)
Data Table on Turkey - Market size and forecast 2025-2030 ($ million)
Chart on Turkey - Year-over-year growth 2025-2030 (%)
Data Table on Turkey - Year-over-year growth 2025-2030 (%)

14.7.5 Israel - Market size and forecast 2025-2030

Chart on Israel - Market size and forecast 2025-2030 ($ million)
Data Table on Israel - Market size and forecast 2025-2030 ($ million)
Chart on Israel - Year-over-year growth 2025-2030 (%)
Data Table on Israel - Year-over-year growth 2025-2030 (%)

14.8 Market opportunity by geography

Market opportunity by geography ($ million)
Data Tables on Market opportunity by geography ($ million)

15. Drivers, Challenges, and Opportunity

15.1 Market drivers

Increasing popularity of winter sports tourism
Technological innovations in lens clarity and performance
Rising integration of fashion and lifestyle aesthetics

15.2 Market challenges

High cost of advanced optical technologies
Stringent safety and regulatory compliance standards
Intense competition from counterfeit and low-quality products

15.3 Impact of drivers and challenges

Impact of drivers and challenges in 2025 and 2030

15.4 Market opportunities

Integration of smart technologies and heads-up displays
Expansion of sustainable and circular manufacturing practices
Rise of modular and customizable gear systems

16. Competitive Landscape

16.1 Overview

16.2

Overview on criticality of inputs and factors of differentiation

16.3 Landscape disruption

Overview on factors of disruption

16.4 Industry risks

Impact of key risks on business

17. Competitive Analysis

17.1 Companies profiled

Companies covered

17.2 Company ranking index

17.3 Market positioning of companies

Matrix on companies position and classification

17.4 Atomic Austria GmbH

Atomic Austria GmbH - Overview
Atomic Austria GmbH - Product / Service
Atomic Austria GmbH - Key offerings
SWOT

17.5 Bolle Brands France SAS

Bolle Brands France SAS - Overview
Bolle Brands France SAS - Product / Service
Bolle Brands France SAS - Key offerings
SWOT

17.6 Carl Zeiss AG

Carl Zeiss AG - Overview
Carl Zeiss AG - Product / Service
Carl Zeiss AG - Key offerings
SWOT

17.7 Dragon Alliance

Dragon Alliance - Overview
Dragon Alliance - Product / Service
Dragon Alliance - Key offerings
SWOT

17.8 Giro Sport Design

Giro Sport Design - Overview
Giro Sport Design - Product / Service
Giro Sport Design - Key offerings
SWOT

17.9 Glade Optics

Glade Optics - Overview
Glade Optics - Product / Service
Glade Optics - Key offerings
SWOT

17.10 HEAD Sport GmbH

HEAD Sport GmbH - Overview
HEAD Sport GmbH - Product / Service
HEAD Sport GmbH - Key offerings
SWOT

17.11 JULBO SA

JULBO SA - Overview
JULBO SA - Product / Service
JULBO SA - Key offerings
SWOT

17.12 Oakley Inc.

Oakley Inc. - Overview
Oakley Inc. - Product / Service
Oakley Inc. - Key offerings
SWOT

17.13 Out Of Srl

Out Of Srl - Overview
Out Of Srl - Product / Service
Out Of Srl - Key offerings
SWOT

17.14 POC Sports

POC Sports - Overview
POC Sports - Product / Service
POC Sports - Key offerings
SWOT

17.15 Salomon Group

Salomon Group - Overview
Salomon Group - Product / Service
Salomon Group - Key offerings
SWOT

17.16 Scott Sports SA

Scott Sports SA - Overview
Scott Sports SA - Product / Service
Scott Sports SA - Key offerings
SWOT

17.17 Smith Sport Optics Inc

Smith Sport Optics Inc - Overview
Smith Sport Optics Inc - Product / Service
Smith Sport Optics Inc - Key offerings
SWOT

17.18 Zeal Optics

Zeal Optics - Overview
Zeal Optics - Product / Service
Zeal Optics - Key offerings
SWOT

18. Appendix

18.1 Scope of the report

Market definition
Objectives
Notes and caveats

18.2 Inclusions and exclusions checklist

Inclusions checklist
Exclusions checklist

18.3 Currency conversion rates for US$

18.4 Research methodology

18.5 Data procurement

Information sources

18.6 Data validation

18.7 Validation techniques employed for market sizing

18.8 Data synthesis

18.9 360 degree market analysis

18.10 List of abbreviations

Research Methodology

Technavio presents a detailed picture of the market by way of study, synthesis, and summation of data from multiple sources. The analysts have presented the various facets of the market with a particular focus on identifying the key industry influencers. The data thus presented is comprehensive, reliable, and the result of extensive research, both primary and secondary.

INFORMATION SOURCES

Primary sources

  • Manufacturers and suppliers
  • Channel partners
  • Industry experts
  • Strategic decision makers

Secondary sources

  • Industry journals and periodicals
  • Government data
  • Financial reports of key industry players
  • Historical data
  • Press releases

DATA ANALYSIS

Data Synthesis

  • Collation of data
  • Estimation of key figures
  • Analysis of derived insights

Data Validation

  • Triangulation with data models
  • Reference against proprietary databases
  • Corroboration with industry experts

REPORT WRITING

Qualitative

  • Market drivers
  • Market challenges
  • Market trends
  • Five forces analysis

Quantitative

  • Market size and forecast
  • Market segmentation
  • Geographical insights
  • Competitive landscape

Interested in this report?

Get your sample now to see our research methodology and insights!

Download Now

Frequently Asked Questions

Snow Goggles market growth will increase by USD 2890.5 million during 2026-2030.

The Snow Goggles market is expected to grow at a CAGR of 7.2% during 2026-2030.

Snow Goggles market is segmented by Type (Ordinary lens, Myopia lens, Presbyopia lens) Distribution channel (Offline, Online) Application (Competition, Entertainment, Others) End-user (Recreational users, Professional athletes, Rental markets) Product type (Adult snow goggles, Youth snow goggles, Professional snow goggles)

Alpina Sports GmbH, Anon Optics, Aphex Gear, Atomic Austria GmbH, Bolle Brands France SAS, Carl Zeiss AG, Dragon Alliance, Giro Sport Design, Glade Optics, HEAD Sport GmbH, JULBO SA, Oakley Inc., Out Of Srl, POC Sports, Salomon Group, Scott Sports SA, Smith Sport Optics Inc, Sol Alpine, SunGod, Sweet Protection AS, UVEX Sports GmbH and Co. KG, Zeal Optics are a few of the key vendors in the Snow Goggles market.

North America will register the highest growth rate of 44.2% among the other regions. Therefore, the Snow Goggles market in North America is expected to garner significant business opportunities for the vendors during the forecast period.

US, Canada, Mexico, Germany, France, Italy, Switzerland, Austria, Norway, China, Japan, South Korea, Australia, New Zealand, India, Brazil, Argentina, Chile, UAE, Saudi Arabia, South Africa, Turkey, Israel

  • Increasing popularity of winter sports tourism is the driving factor this market.

The Snow Goggles market vendors should focus on grabbing business opportunities from the Type segment as it accounted for the largest market share in the base year.
RIA - Research AI Assistant
Ask RIA
