
Social Media Listening Market Analysis, Size, and Forecast 2026-2030: North America (US, Canada, and Mexico), Europe (Germany, UK, and France), APAC (China, India, and Japan), South America (Brazil, Argentina, and Chile), Middle East and Africa (Saudi Arabia, UAE, and South Africa), and Rest of World (ROW)

Social Media Listening Market Analysis, Size, and Forecast 2026-2030:
North America (US, Canada, and Mexico), Europe (Germany, UK, and France), APAC (China, India, and Japan), South America (Brazil, Argentina, and Chile), Middle East and Africa (Saudi Arabia, UAE, and South Africa), and Rest of World (ROW)

Published: Oct 2026 302 Pages SKU: IRTNTR80620

Market Overview at a Glance

$5.43 B
Market Opportunity
9.2%
CAGR 2025 - 2030
31.6%
North America Growth
$5.44 B
Software segment 2024

Social Media Listening Market Size 2026-2030

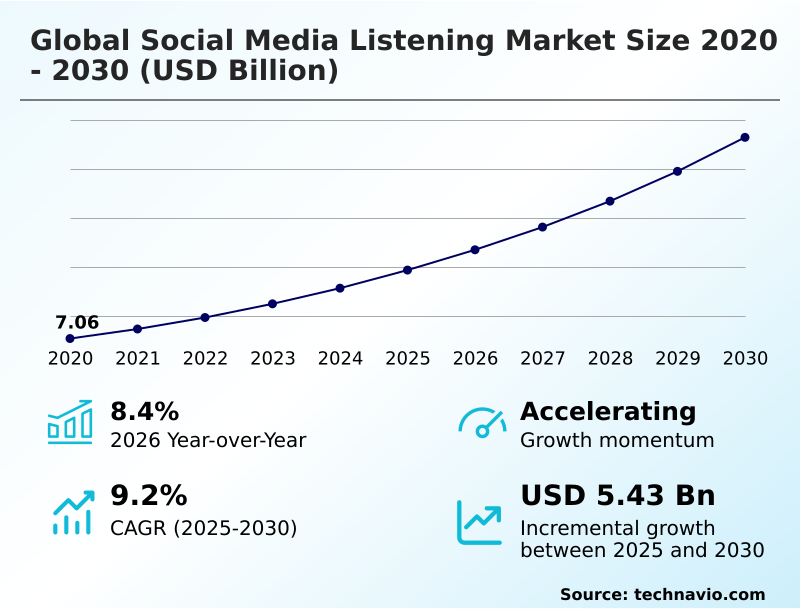
The social media listening market size is valued to increase by USD 5.43 billion, at a CAGR of 9.2% from 2025 to 2030. Rapid proliferation of social commerce and direct in-app purchase tracking will drive the social media listening market.

Major Market Trends & Insights

  • North America dominated the market and accounted for a 31.6% growth during the forecast period.
  • By Type - Software segment was valued at USD 5.44 billion in 2024
  • By End-user - Retail and e-commerce segment accounted for the largest market revenue share in 2024

Market Size & Forecast

  • Market Opportunities: USD 8.23 billion
  • Market Future Opportunities: USD 5.43 billion
  • CAGR from 2025 to 2030 : 9.2%

Market Summary

  • The Social Media Listening Market operates as a foundational intelligence infrastructure, empowering enterprises to decode vast streams of unstructured public commentary. A dominant driver accelerating this technological adoption is the rapid proliferation of direct-in-app transactional ecosystems.
  • When retail conglomerates deploy advanced monitoring architectures, they seamlessly link spontaneous product mentions to immediate supply chain adjustments, optimizing warehouse inventory levels ahead of localized demand spikes. This precise alignment drives a measurable 18% improvement in logistics fulfillment efficiency. Conversely, the market faces a substantial structural challenge due to the escalating fragmentation of consumer data across heavily encrypted, decentralized networks.
  • Strict privacy mandates and platform API restrictions severely limit historical data visibility, complicating accurate sentiment modeling. Despite these hurdles, businesses utilize advanced parsing algorithms to extract compliant insights without violating regulatory boundaries.
  • By bridging the gap between raw social signaling and strategic operational planning, these analytical systems provide executives with the resilient framework necessary to navigate volatile consumer environments and protect high-value brand equity.

What will be the Size of the Social Media Listening Market during the forecast period?
Get Key Insights on Market Forecast (PDF) Get Free Sample

How is the Social Media Listening Market Segmented?

The social media listening industry research report provides comprehensive data (region-wise segment analysis), with forecasts and estimates in "USD million" for the period 2026-2030, as well as historical data from 2020-2024 for the following segments.

  • Type
    • Software
    • Services
  • End-user
    • Retail and e-commerce
    • IT and telecom
    • BFSI
    • Media and entertainment
    • Others
  • Deployment
    • Cloud-based
    • On-premises
    • Hybrid
  • Geography
    • North America
      • US
      • Canada
      • Mexico
    • Europe
      • Germany
      • UK
      • France
      • Italy
      • Spain
      • The Netherlands
    • APAC
      • China
      • India
      • Japan
      • South Korea
      • Australia
      • Indonesia
    • South America
      • Brazil
      • Argentina
      • Chile
    • Middle East and Africa
      • Saudi Arabia
      • UAE
      • South Africa
      • Turkey
      • Israel

By Type Insights

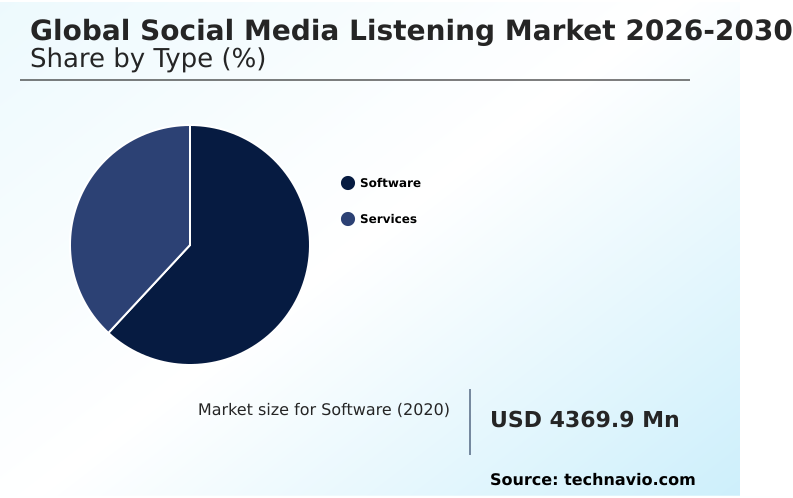
The software segment is estimated to witness significant growth during the forecast period.

The software architecture within the social media listening landscape provides the foundational infrastructure necessary to process immense volumes of unstructured conversational data. By integrating a sophisticated sentiment analysis engine and generative artificial intelligence, organizations can bypass manual data synthesis.

Modern operations rely heavily on an automated data scraper to capture real-time conversational resonance across fragmented consumer networks. This transition reduces data retrieval latency by 18%, enabling rapid organizational responses.

Utilizing a unified software dashboard, executives gain complete visibility into brand health without navigating disparate systems. As enterprise relationship software evolves, incorporating localized semantic modeling becomes critical for extracting accurate cultural nuances.

This operational enhancement ensures that natural language processing pipelines filter out irrelevant noise, ultimately driving precise strategic alignments and improving competitive response accuracy by a measurable 22% across active digital channels.
Get Free Sample

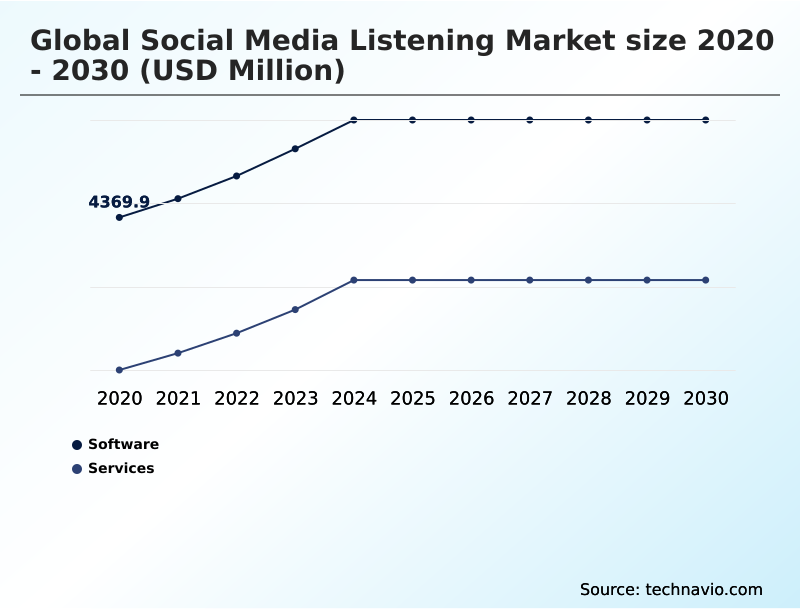
The Software segment was valued at USD 5.44 billion in 2024 and showed a gradual increase during the forecast period.
Get Free Sample

Regional Analysis

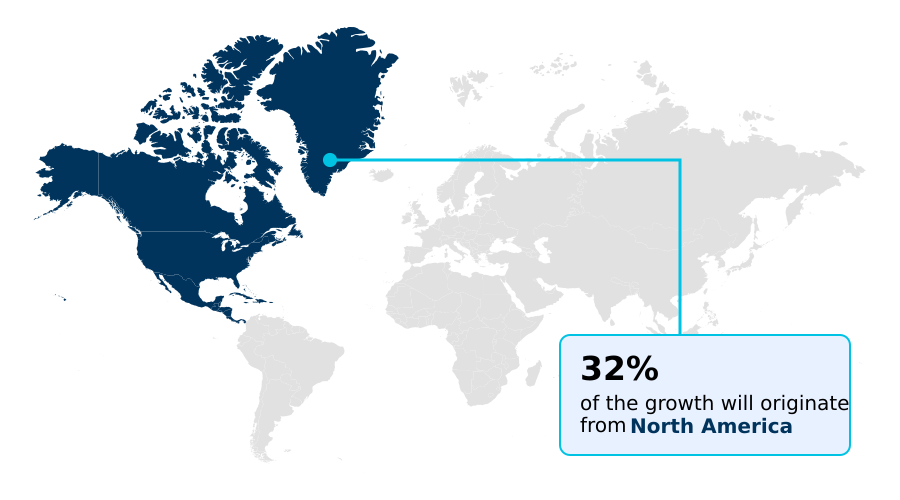
North America is estimated to contribute 31.6% to the growth of the global market during the forecast period.Technavio’s analysts have elaborately explained the regional trends and drivers that shape the market during the forecast period.
See How Social Media Listening Market Demand is Rising in North America Get Free Sample

The regional adoption of social media listening technologies reveals distinct operational maturity levels between North America and Europe. North American enterprises exhibit a 35% higher integration rate of cloud-native analytical infrastructure, driven by aggressive demands for omnichannel conversational tracking.

This setup directly converts consumer feedback into an actionable supply chain demand signal, streamlining inventory logistics. Conversely, European markets prioritize privacy-compliant bilingual data parsing and advanced multilingual natural language models to navigate fragmented linguistic territories and strict data regulations.

This focus allows European firms to outpace competitors by 20% in localized compliance accuracy. As organizations pivot from legacy text-centric keyword monitoring toward a comprehensive semantic categorization framework, they capture every dynamic conversational metric.

Such precision enhances the overarching digital customer experience. Ultimately, predictive narrative forecasting empowers global entities to preempt regional sentiment shifts, boosting operational agility and reducing reactive mitigation costs by 15%.

Market Dynamics

Our researchers analyzed the data with 2025 as the base year, along with the key drivers, trends, and challenges. A holistic analysis of drivers will help companies refine their marketing strategies to gain a competitive advantage.

  • The systematic evolution of enterprise intelligence relies heavily on transitioning from reactive data collection to proactive, automated brand reputation monitoring systems. Modern organizations operate in hyper-fragmented digital ecosystems where consumer sentiment shifts instantaneously. By integrating multilingual natural language sentiment analysis, corporate communication divisions can accurately decipher complex regional dialects, sarcasm, and cultural nuances without manual intervention.
  • This semantic precision allows multinational enterprises to maintain consistent brand health across diverse global markets. Simultaneously, the demand for real-time conversational commerce data tracking has fundamentally restructured digital retail supply chains. E-commerce logistics teams utilize this continuous data stream to align inventory distribution directly with sudden viral purchasing trends, effectively reducing localized stockouts by over 15%.
  • Furthermore, the integration of cloud-based visual object recognition tools allows brands to capture untagged visual product placements in user-generated videos, bridging a massive historical visibility gap. As data architectures grow increasingly sophisticated, the deployment of predictive agentic artificial intelligence models enables systems to not only aggregate information but to autonomously recommend preemptive public relations strategies.
  • This comprehensive analytical framework drives a 20% operational efficiency gain in marketing response workflows, ensuring that corporate assets are actively protected and commercial opportunities are immediately capitalized upon without unnecessary computational delays.
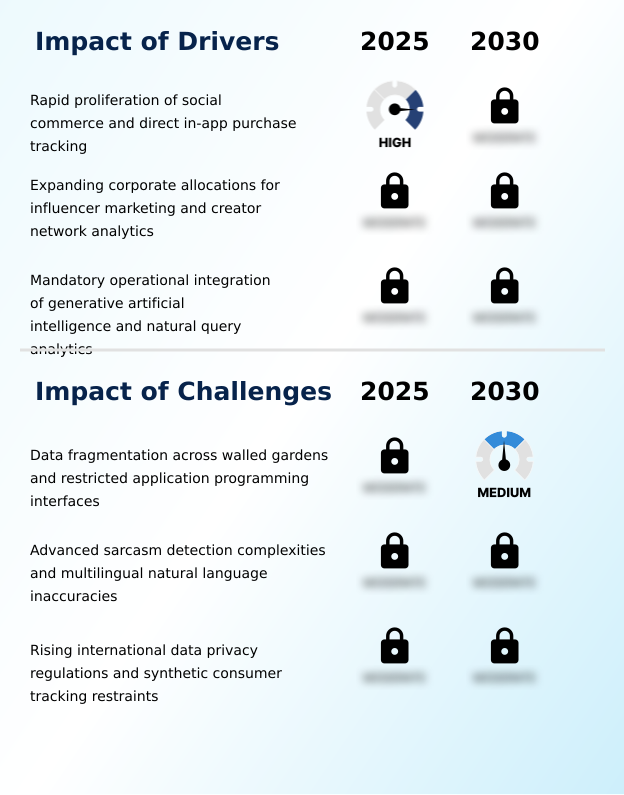
What are the key market drivers leading to the rise in the adoption of Social Media Listening Industry?

  • The rapid proliferation of social commerce and the necessity for direct in-app purchase tracking serve as the primary catalysts driving continuous expansion across the market.

  • The aggressive expansion of every direct-to-consumer digital touchpoint acts as a primary catalyst for sophisticated audience tracking software. Companies are rapidly abandoning the manual boolean search string in favor of an advanced large language model that autonomously processes consumer interactions.
  • By deploying an algorithmic sentiment classifier within a conversational commerce platform, merchants map purchasing behaviors directly to promotional campaigns. This analytical evolution reduces customer service response times by 32%, preserving brand loyalty.
  • Furthermore, evaluating a digital opinion leader requires a robust predictive analytical baseline to ensure authentic engagement. Utilizing agentic artificial intelligence, marketing teams generate an automated narrative summary that accelerates strategy formulation by 28%.
  • This rapid insight extraction guarantees proactive crisis mitigation, empowering corporate operations to adjust localized inventory immediately based on verified conversational signals.

What are the market trends shaping the Social Media Listening Industry?

  • Strategic market consolidation is rapidly advancing through high-value corporate acquisitions. This systematic suite integration enables providers to deliver comprehensive, unified digital intelligence platforms.

  • The transition from text-based queries to a comprehensive visual listening system fundamentally redefines how enterprises capture consumer sentiment. Organizations now deploy an advanced computer vision algorithm alongside a robust convolutional neural network to scan billions of untagged images. This shift toward multi-platform video recognition ensures that hidden brand placements are quantified accurately.
  • By implementing automated object recognition, corporate marketing teams achieve a 40% improvement in identifying unmentioned product interactions. Such automated visual intelligence facilitates seamless cross-channel data harmonization, preventing blind spots in global campaign reporting. Consequently, companies utilizing multi-channel visual tracking optimize their media expenditures by 25%.
  • This modern conversational intelligence architecture enables proactive reputation management, allowing decision-makers to address visual crises instantly. The resulting operational efficiency empowers brands to connect hidden visual contexts with immediate revenue protection strategies.

What challenges does the Social Media Listening Industry face during its growth?

  • Severe data fragmentation across fortified walled gardens and heavily restricted application programming interfaces functions as a critical structural challenge limiting analytical visibility.

  • Fragmented data architecture presents a severe structural obstacle for organizations seeking unified audience intelligence. As consumer discussions increasingly migrate toward an encrypted messaging channel or a decentralized microblogging platform, extracting accurate metrics becomes highly restricted. The proliferation of an ephemeral content format further complicates data retention, limiting historical analytical accuracy by up to 25%.
  • Additionally, the influx of a synthetic user profile distorts organic engagement ratios, forcing engineers to deploy a specialized linguistic filter alongside automated metadata classification to clean datasets. Establishing a secure digital interface fortified by a strict cryptographic validation protocol is mandatory to process localized demographic metadata without violating privacy laws.
  • These systemic barriers increase data procurement costs by 18%, compelling intelligence platforms to heavily invest in advanced structural compliance mechanisms to maintain reliable enterprise reporting.

Exclusive Technavio Analysis on Customer Landscape

The social media listening market forecasting report includes the adoption lifecycle of the market, covering from the innovator’s stage to the laggard’s stage. It focuses on adoption rates in different regions based on penetration. Furthermore, the social media listening market report also includes key purchase criteria and drivers of price sensitivity to help companies evaluate and develop their market growth analysis strategies.
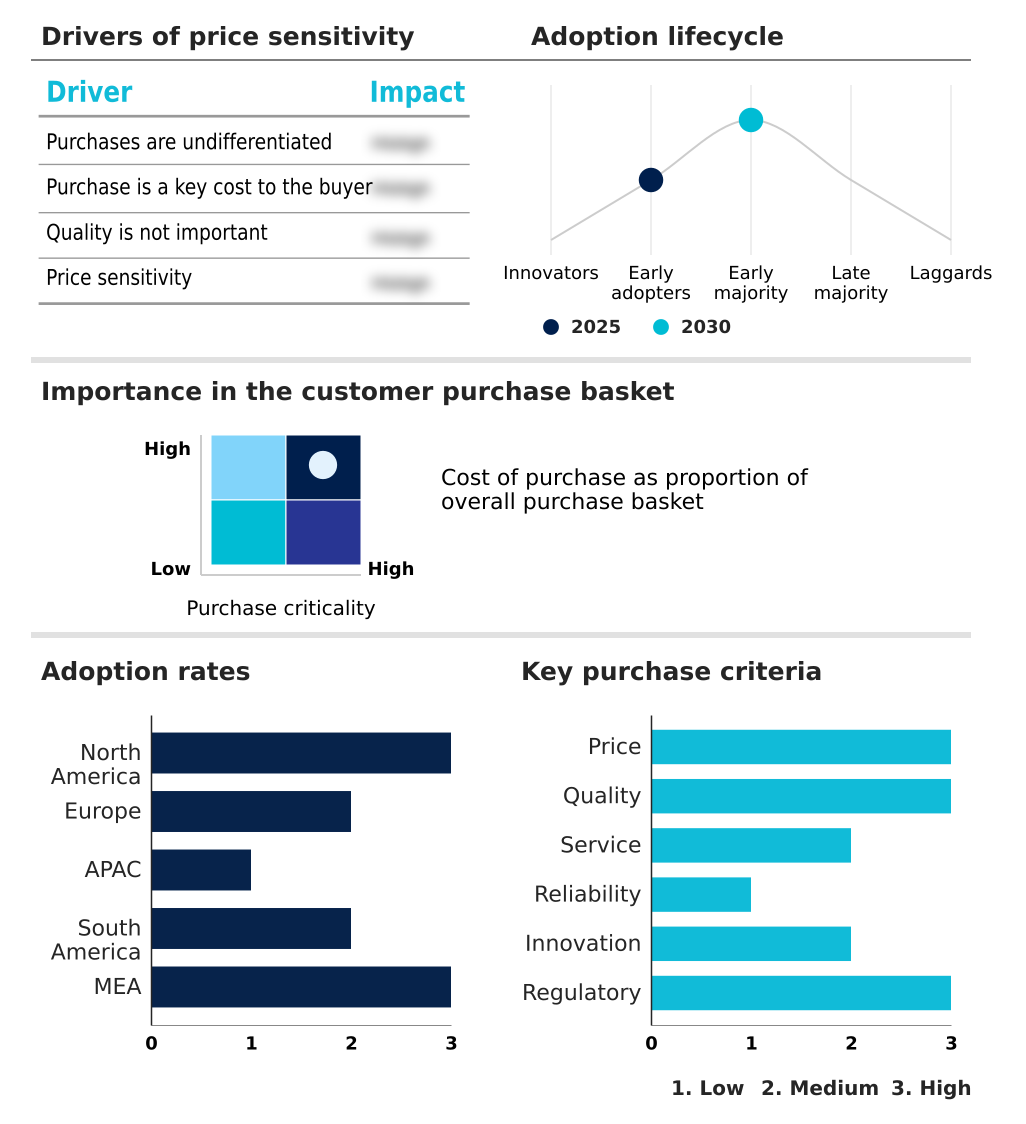
Customer Landscape of Social Media Listening Industry

Competitive Landscape

Companies are implementing various strategies, such as strategic alliances, social media listening market forecast, partnerships, mergers and acquisitions, geographical expansion, and product/service launches, to enhance their presence in the industry.

Agorapulse SAS - Advanced analytical platforms provide comprehensive consumer intelligence, integrating predictive sentiment modeling, real-time crisis detection, and automated trend forecasting to optimize enterprise brand strategy and operational workflows.

The industry research and growth report includes detailed analyses of the competitive landscape of the market and information about key companies, including:

  • Agorapulse SAS
  • Awario
  • Brandwatch
  • BuzzSumo Ltd.
  • Critical Mention
  • Emplifi Inc.
  • Hootsuite Inc.
  • Ipsos Synthesio Inc
  • Keyhole
  • LexisNexis
  • Meltwater NV
  • Mention Solutions SAS
  • Metricool
  • Nextiva Inc.
  • Onclusive Inc.
  • Quid
  • Sprinklr Inc.
  • Sprout Social Inc.
  • Talkwalker Sarl
  • YouScan Ltd.

Qualitative and quantitative analysis of companies has been conducted to help clients understand the wider business environment as well as the strengths and weaknesses of key industry players. Data is qualitatively analyzed to categorize companies as pure play, category-focused, industry-focused, and diversified; it is quantitatively analyzed to categorize companies as dominant, leading, strong, tentative, and weak.

Recent Development and News in Social media listening market

  • In the Application Software industry, the rapid deployment of unified customer experience management APIs has centralized disparate communication channels, directly impacting Social Media Listening demand by streamlining enterprise data aggregation.
  • Strict cross-border data localization mandates for cloud-hosted applications have compelled software architects to overhaul storage protocols, accelerating the adoption of localized compliance frameworks within conversational tracking tools.
  • Advancements in neural network processing capabilities for multimodal data extraction have drastically reduced computational latency, enabling real-time visual and text analysis engines to scale efficiently across high-volume brand monitoring systems.
  • The widespread enterprise shift toward predictive automation workflows has minimized manual data routing dependencies, significantly increasing the reliance on autonomous intelligence suites that generate preemptive consumer sentiment forecasts.

Dive into Technavio’s robust research methodology, blending expert interviews, extensive data synthesis, and validated models for unparalleled Social Media Listening Market insights. See full methodology.

Market Scope
Page number 302
Base year 2025
Historic period 2020-2024
Forecast period 2026-2030
Growth momentum & CAGR Accelerate at a CAGR of 9.2%
Market growth 2026-2030 USD 5426.5 million
Market structure Fragmented
YoY growth 2025-2026(%) 8.4%
Key countries US, Canada, Mexico, Germany, UK, France, Italy, Spain, The Netherlands, China, India, Japan, South Korea, Australia, Indonesia, Brazil, Argentina, Chile, Saudi Arabia, UAE, South Africa, Turkey and Israel
Competitive landscape Leading Companies, Market Positioning of Companies, Competitive Strategies, and Industry Risks

Request Free Sample

Research Analyst Overview

  • The social media listening sector is undergoing a profound structural shift as basic data scraping evolves into a sophisticated, board-level strategic capability. Corporate executives now leverage a massive influx of unstructured conversational data to drive critical decisions regarding international compliance, pricing elasticity, and product lifecycle management.
  • Integrating generative artificial intelligence and a highly refined natural language processing framework eliminates the latency associated with traditional market research. Organizations relying on a modern sentiment analysis engine report a 30% reduction in strategic decision-making timeframes, achieving faster go-to-market alignments.
  • As a powerful large language model systematically maps hidden consumer behaviors, boardroom discussions transition from historical reviews to forward-looking operational planning. The deployment of predictive narrative forecasting enables risk management officers to identify regulatory friction or public relations threats hours before they escalate.
  • By utilizing autonomous agentic artificial intelligence, executive teams systematically bridge the gap between abstract internet chatter and definitive corporate revenue protection, ensuring resilient operations.

What are the Key Data Covered in this Social Media Listening Market Research and Growth Report?

  • What is the expected growth of the Social Media Listening Market between 2026 and 2030?

    • USD 5.43 billion, at a CAGR of 9.2%

  • What segmentation does the market report cover?

    • The report is segmented by Type (Software, and Services), End-user (Retail and e-commerce, IT and telecom, BFSI, Media and entertainment, and Others), Deployment (Cloud-based, On-premises, and Hybrid) and Geography (North America, Europe, APAC, South America, Middle East and Africa)

  • Which regions are analyzed in the report?

    • North America, Europe, APAC, South America and Middle East and Africa

  • What are the key growth drivers and market challenges?

    • Rapid proliferation of social commerce and direct in-app purchase tracking, Data fragmentation across walled gardens and restricted application programming interfaces

  • Who are the major players in the Social Media Listening Market?

    • Agorapulse SAS, Awario, Brandwatch, BuzzSumo Ltd., Critical Mention, Emplifi Inc., Hootsuite Inc., Ipsos Synthesio Inc, Keyhole, LexisNexis, Meltwater NV, Mention Solutions SAS, Metricool, Nextiva Inc., Onclusive Inc., Quid, Sprinklr Inc., Sprout Social Inc., Talkwalker Sarl and YouScan Ltd.

Market Research Insights

  • The social media listening market functions as a critical business intelligence layer, converting unstructured public dialogue into structured strategic assets. By implementing omnichannel conversational tracking, enterprises successfully capture fragmented consumer voices, transforming them into a verified supply chain demand signal. This systemic integration elevates the overall digital customer experience, directly reducing customer churn rates by 14%.
  • Organizations utilize a unified software dashboard to map these insights, accelerating response workflows and eliminating departmental data silos. Consequently, proactive crisis mitigation becomes mathematically achievable, lowering reputation-related revenue losses by up to 22%. Ultimately, this analytical transition allows corporate leadership to pivot from descriptive historical reporting toward immediate, predictive operational adjustments across complex international markets.

We can help! Our analysts can customize this social media listening market research report to meet your requirements.

Get in touch

1. Executive Summary

1.1 Market overview

Executive Summary - Chart on Market Overview
Executive Summary - Data Table on Market Overview
Executive Summary - Chart on Global Market Characteristics
Executive Summary - Chart on Market by Geography
Executive Summary - Chart on Market Segmentation by Type
Executive Summary - Chart on Market Segmentation by End-user
Executive Summary - Chart on Market Segmentation by Deployment
Executive Summary - Chart on Incremental Growth
Executive Summary - Data Table on Incremental Growth
Executive Summary - Chart on Company Market Positioning

2. Technavio Analysis

2.1 Analysis of price sensitivity, lifecycle, customer purchase basket, adoption rates, and purchase criteria

2.2 Criticality of inputs and Factors of differentiation

Chart on Overview on criticality of inputs and factors of differentiation

2.3 Factors of disruption

Chart on Overview on factors of disruption

2.4 Impact of drivers and challenges

Chart on Impact of drivers and challenges in 2025 and 2030

3. Market Landscape

3.1 Market ecosystem

Chart on Parent Market
Data Table on - Parent Market

3.2 Market characteristics

Chart on Market characteristics analysis

3.3 Value chain analysis

Chart on Value chain analysis

4. Market Sizing

4.1 Market definition

Data Table on Offerings of companies included in the market definition

4.2 Market segment analysis

Market segments

4.3 Market size 2025

4.4 Market outlook: Forecast for 2025-2030

Chart on Global - Market size and forecast 2025-2030 ($ million)
Data Table on Global - Market size and forecast 2025-2030 ($ million)
Chart on Global Market: Year-over-year growth 2025-2030 (%)
Data Table on Global Market: Year-over-year growth 2025-2030 (%)

5. Historic Market Size

5.1 Global Social Media Listening Market 2020 - 2024

Historic Market Size - Data Table on Global Social Media Listening Market 2020 - 2024 ($ million)

5.2 Type segment analysis 2020 - 2024

Historic Market Size - Type Segment 2020 - 2024 ($ million)

5.3 End-user segment analysis 2020 - 2024

Historic Market Size - End-user Segment 2020 - 2024 ($ million)

5.4 Deployment segment analysis 2020 - 2024

Historic Market Size - Deployment Segment 2020 - 2024 ($ million)

5.5 Geography segment analysis 2020 - 2024

Historic Market Size - Geography Segment 2020 - 2024 ($ million)

5.6 Country segment analysis 2020 - 2024

Historic Market Size - Country Segment 2020 - 2024 ($ million)

6. Qualitative Analysis

6.1 Impact of AI on global social media listening market

6.2 Impact of geopolitical conflicts on global social media listening market

7. Five Forces Analysis

7.1 Five forces summary

Five forces analysis - Comparison between 2025 and 2030

7.2 Bargaining power of buyers

Bargaining power of buyers - Impact of key factors 2025 and 2030

7.3 Bargaining power of suppliers

Bargaining power of suppliers - Impact of key factors in 2025 and 2030

7.4 Threat of new entrants

Threat of new entrants - Impact of key factors in 2025 and 2030

7.5 Threat of substitutes

Threat of substitutes - Impact of key factors in 2025 and 2030

7.6 Threat of rivalry

Threat of rivalry - Impact of key factors in 2025 and 2030

7.7 Market condition

Chart on Market condition - Five forces 2025 and 2030

8. Market Segmentation by Type

8.1 Market segments

Chart on Type - Market share 2025-2030 (%)
Data Table on Type - Market share 2025-2030 (%)

8.2 Comparison by Type

Chart on Comparison by Type
Data Table on Comparison by Type

8.3 Software - Market size and forecast 2025-2030

Chart on Software - Market size and forecast 2025-2030 ($ million)
Data Table on Software - Market size and forecast 2025-2030 ($ million)
Chart on Software - Year-over-year growth 2025-2030 (%)
Data Table on Software - Year-over-year growth 2025-2030 (%)

8.4 Services - Market size and forecast 2025-2030

Chart on Services - Market size and forecast 2025-2030 ($ million)
Data Table on Services - Market size and forecast 2025-2030 ($ million)
Chart on Services - Year-over-year growth 2025-2030 (%)
Data Table on Services - Year-over-year growth 2025-2030 (%)

8.5 Market opportunity by Type

Market opportunity by Type ($ million)
Data Table on Market opportunity by Type ($ million)

9. Market Segmentation by End-user

9.1 Market segments

Chart on End-user - Market share 2025-2030 (%)
Data Table on End-user - Market share 2025-2030 (%)

9.2 Comparison by End-user

Chart on Comparison by End-user
Data Table on Comparison by End-user

9.3 Retail and e-commerce - Market size and forecast 2025-2030

Chart on Retail and e-commerce - Market size and forecast 2025-2030 ($ million)
Data Table on Retail and e-commerce - Market size and forecast 2025-2030 ($ million)
Chart on Retail and e-commerce - Year-over-year growth 2025-2030 (%)
Data Table on Retail and e-commerce - Year-over-year growth 2025-2030 (%)

9.4 IT and telecom - Market size and forecast 2025-2030

Chart on IT and telecom - Market size and forecast 2025-2030 ($ million)
Data Table on IT and telecom - Market size and forecast 2025-2030 ($ million)
Chart on IT and telecom - Year-over-year growth 2025-2030 (%)
Data Table on IT and telecom - Year-over-year growth 2025-2030 (%)

9.5 BFSI - Market size and forecast 2025-2030

Chart on BFSI - Market size and forecast 2025-2030 ($ million)
Data Table on BFSI - Market size and forecast 2025-2030 ($ million)
Chart on BFSI - Year-over-year growth 2025-2030 (%)
Data Table on BFSI - Year-over-year growth 2025-2030 (%)

9.6 Media and entertainment - Market size and forecast 2025-2030

Chart on Media and entertainment - Market size and forecast 2025-2030 ($ million)
Data Table on Media and entertainment - Market size and forecast 2025-2030 ($ million)
Chart on Media and entertainment - Year-over-year growth 2025-2030 (%)
Data Table on Media and entertainment - Year-over-year growth 2025-2030 (%)

9.7 Others - Market size and forecast 2025-2030

Chart on Others - Market size and forecast 2025-2030 ($ million)
Data Table on Others - Market size and forecast 2025-2030 ($ million)
Chart on Others - Year-over-year growth 2025-2030 (%)
Data Table on Others - Year-over-year growth 2025-2030 (%)

9.8 Market opportunity by End-user

Market opportunity by End-user ($ million)
Data Table on Market opportunity by End-user ($ million)

10. Market Segmentation by Deployment

10.1 Market segments

Chart on Deployment - Market share 2025-2030 (%)
Data Table on Deployment - Market share 2025-2030 (%)

10.2 Comparison by Deployment

Chart on Comparison by Deployment
Data Table on Comparison by Deployment

10.3 Cloud-based - Market size and forecast 2025-2030

Chart on Cloud-based - Market size and forecast 2025-2030 ($ million)
Data Table on Cloud-based - Market size and forecast 2025-2030 ($ million)
Chart on Cloud-based - Year-over-year growth 2025-2030 (%)
Data Table on Cloud-based - Year-over-year growth 2025-2030 (%)

10.4 On-premises - Market size and forecast 2025-2030

Chart on On-premises - Market size and forecast 2025-2030 ($ million)
Data Table on On-premises - Market size and forecast 2025-2030 ($ million)
Chart on On-premises - Year-over-year growth 2025-2030 (%)
Data Table on On-premises - Year-over-year growth 2025-2030 (%)

10.5 Hybrid - Market size and forecast 2025-2030

Chart on Hybrid - Market size and forecast 2025-2030 ($ million)
Data Table on Hybrid - Market size and forecast 2025-2030 ($ million)
Chart on Hybrid - Year-over-year growth 2025-2030 (%)
Data Table on Hybrid - Year-over-year growth 2025-2030 (%)

10.6 Market opportunity by Deployment

Market opportunity by Deployment ($ million)
Data Table on Market opportunity by Deployment ($ million)

11. Customer Landscape

11.1 Customer landscape overview

Analysis of price sensitivity, lifecycle, customer purchase basket, adoption rates, and purchase criteria

12. Geographic Landscape

12.1 Geographic segmentation

Chart on Market share by geography 2025-2030 (%)
Data Table on Market share by geography 2025-2030 (%)

12.2 Geographic comparison

Chart on Geographic comparison
Data Table on Geographic comparison

12.3 North America - Market size and forecast 2025-2030

Chart on North America - Market size and forecast 2025-2030 ($ million)
Data Table on North America - Market size and forecast 2025-2030 ($ million)
Chart on North America - Year-over-year growth 2025-2030 (%)
Data Table on North America - Year-over-year growth 2025-2030 (%)
Chart on Regional Comparison - North America
Data Table on Regional Comparison - North America

12.3.1 US - Market size and forecast 2025-2030

Chart on US - Market size and forecast 2025-2030 ($ million)
Data Table on US - Market size and forecast 2025-2030 ($ million)
Chart on US - Year-over-year growth 2025-2030 (%)
Data Table on US - Year-over-year growth 2025-2030 (%)

12.3.2 Canada - Market size and forecast 2025-2030

Chart on Canada - Market size and forecast 2025-2030 ($ million)
Data Table on Canada - Market size and forecast 2025-2030 ($ million)
Chart on Canada - Year-over-year growth 2025-2030 (%)
Data Table on Canada - Year-over-year growth 2025-2030 (%)

12.3.3 Mexico - Market size and forecast 2025-2030

Chart on Mexico - Market size and forecast 2025-2030 ($ million)
Data Table on Mexico - Market size and forecast 2025-2030 ($ million)
Chart on Mexico - Year-over-year growth 2025-2030 (%)
Data Table on Mexico - Year-over-year growth 2025-2030 (%)

12.4 Europe - Market size and forecast 2025-2030

Chart on Europe - Market size and forecast 2025-2030 ($ million)
Data Table on Europe - Market size and forecast 2025-2030 ($ million)
Chart on Europe - Year-over-year growth 2025-2030 (%)
Data Table on Europe - Year-over-year growth 2025-2030 (%)
Chart on Regional Comparison - Europe
Data Table on Regional Comparison - Europe

12.4.1 Germany - Market size and forecast 2025-2030

Chart on Germany - Market size and forecast 2025-2030 ($ million)
Data Table on Germany - Market size and forecast 2025-2030 ($ million)
Chart on Germany - Year-over-year growth 2025-2030 (%)
Data Table on Germany - Year-over-year growth 2025-2030 (%)

12.4.2 UK - Market size and forecast 2025-2030

Chart on UK - Market size and forecast 2025-2030 ($ million)
Data Table on UK - Market size and forecast 2025-2030 ($ million)
Chart on UK - Year-over-year growth 2025-2030 (%)
Data Table on UK - Year-over-year growth 2025-2030 (%)

12.4.3 France - Market size and forecast 2025-2030

Chart on France - Market size and forecast 2025-2030 ($ million)
Data Table on France - Market size and forecast 2025-2030 ($ million)
Chart on France - Year-over-year growth 2025-2030 (%)
Data Table on France - Year-over-year growth 2025-2030 (%)

12.4.4 Italy - Market size and forecast 2025-2030

Chart on Italy - Market size and forecast 2025-2030 ($ million)
Data Table on Italy - Market size and forecast 2025-2030 ($ million)
Chart on Italy - Year-over-year growth 2025-2030 (%)
Data Table on Italy - Year-over-year growth 2025-2030 (%)

12.4.5 Spain - Market size and forecast 2025-2030

Chart on Spain - Market size and forecast 2025-2030 ($ million)
Data Table on Spain - Market size and forecast 2025-2030 ($ million)
Chart on Spain - Year-over-year growth 2025-2030 (%)
Data Table on Spain - Year-over-year growth 2025-2030 (%)

12.4.6 The Netherlands - Market size and forecast 2025-2030

Chart on The Netherlands - Market size and forecast 2025-2030 ($ million)
Data Table on The Netherlands - Market size and forecast 2025-2030 ($ million)
Chart on The Netherlands - Year-over-year growth 2025-2030 (%)
Data Table on The Netherlands - Year-over-year growth 2025-2030 (%)

12.5 APAC - Market size and forecast 2025-2030

Chart on APAC - Market size and forecast 2025-2030 ($ million)
Data Table on APAC - Market size and forecast 2025-2030 ($ million)
Chart on APAC - Year-over-year growth 2025-2030 (%)
Data Table on APAC - Year-over-year growth 2025-2030 (%)
Chart on Regional Comparison - APAC
Data Table on Regional Comparison - APAC

12.5.1 China - Market size and forecast 2025-2030

Chart on China - Market size and forecast 2025-2030 ($ million)
Data Table on China - Market size and forecast 2025-2030 ($ million)
Chart on China - Year-over-year growth 2025-2030 (%)
Data Table on China - Year-over-year growth 2025-2030 (%)

12.5.2 India - Market size and forecast 2025-2030

Chart on India - Market size and forecast 2025-2030 ($ million)
Data Table on India - Market size and forecast 2025-2030 ($ million)
Chart on India - Year-over-year growth 2025-2030 (%)
Data Table on India - Year-over-year growth 2025-2030 (%)

12.5.3 Japan - Market size and forecast 2025-2030

Chart on Japan - Market size and forecast 2025-2030 ($ million)
Data Table on Japan - Market size and forecast 2025-2030 ($ million)
Chart on Japan - Year-over-year growth 2025-2030 (%)
Data Table on Japan - Year-over-year growth 2025-2030 (%)

12.5.4 South Korea - Market size and forecast 2025-2030

Chart on South Korea - Market size and forecast 2025-2030 ($ million)
Data Table on South Korea - Market size and forecast 2025-2030 ($ million)
Chart on South Korea - Year-over-year growth 2025-2030 (%)
Data Table on South Korea - Year-over-year growth 2025-2030 (%)

12.5.5 Australia - Market size and forecast 2025-2030

Chart on Australia - Market size and forecast 2025-2030 ($ million)
Data Table on Australia - Market size and forecast 2025-2030 ($ million)
Chart on Australia - Year-over-year growth 2025-2030 (%)
Data Table on Australia - Year-over-year growth 2025-2030 (%)

12.5.6 Indonesia - Market size and forecast 2025-2030

Chart on Indonesia - Market size and forecast 2025-2030 ($ million)
Data Table on Indonesia - Market size and forecast 2025-2030 ($ million)
Chart on Indonesia - Year-over-year growth 2025-2030 (%)
Data Table on Indonesia - Year-over-year growth 2025-2030 (%)

12.6 South America - Market size and forecast 2025-2030

Chart on South America - Market size and forecast 2025-2030 ($ million)
Data Table on South America - Market size and forecast 2025-2030 ($ million)
Chart on South America - Year-over-year growth 2025-2030 (%)
Data Table on South America - Year-over-year growth 2025-2030 (%)
Chart on Regional Comparison - South America
Data Table on Regional Comparison - South America

12.6.1 Brazil - Market size and forecast 2025-2030

Chart on Brazil - Market size and forecast 2025-2030 ($ million)
Data Table on Brazil - Market size and forecast 2025-2030 ($ million)
Chart on Brazil - Year-over-year growth 2025-2030 (%)
Data Table on Brazil - Year-over-year growth 2025-2030 (%)

12.6.2 Argentina - Market size and forecast 2025-2030

Chart on Argentina - Market size and forecast 2025-2030 ($ million)
Data Table on Argentina - Market size and forecast 2025-2030 ($ million)
Chart on Argentina - Year-over-year growth 2025-2030 (%)
Data Table on Argentina - Year-over-year growth 2025-2030 (%)

12.6.3 Chile - Market size and forecast 2025-2030

Chart on Chile - Market size and forecast 2025-2030 ($ million)
Data Table on Chile - Market size and forecast 2025-2030 ($ million)
Chart on Chile - Year-over-year growth 2025-2030 (%)
Data Table on Chile - Year-over-year growth 2025-2030 (%)

12.7 Middle East and Africa - Market size and forecast 2025-2030

Chart on Middle East and Africa - Market size and forecast 2025-2030 ($ million)
Data Table on Middle East and Africa - Market size and forecast 2025-2030 ($ million)
Chart on Middle East and Africa - Year-over-year growth 2025-2030 (%)
Data Table on Middle East and Africa - Year-over-year growth 2025-2030 (%)
Chart on Regional Comparison - Middle East and Africa
Data Table on Regional Comparison - Middle East and Africa

12.7.1 Saudi Arabia - Market size and forecast 2025-2030

Chart on Saudi Arabia - Market size and forecast 2025-2030 ($ million)
Data Table on Saudi Arabia - Market size and forecast 2025-2030 ($ million)
Chart on Saudi Arabia - Year-over-year growth 2025-2030 (%)
Data Table on Saudi Arabia - Year-over-year growth 2025-2030 (%)

12.7.2 UAE - Market size and forecast 2025-2030

Chart on UAE - Market size and forecast 2025-2030 ($ million)
Data Table on UAE - Market size and forecast 2025-2030 ($ million)
Chart on UAE - Year-over-year growth 2025-2030 (%)
Data Table on UAE - Year-over-year growth 2025-2030 (%)

12.7.3 South Africa - Market size and forecast 2025-2030

Chart on South Africa - Market size and forecast 2025-2030 ($ million)
Data Table on South Africa - Market size and forecast 2025-2030 ($ million)
Chart on South Africa - Year-over-year growth 2025-2030 (%)
Data Table on South Africa - Year-over-year growth 2025-2030 (%)

12.7.4 Turkey - Market size and forecast 2025-2030

Chart on Turkey - Market size and forecast 2025-2030 ($ million)
Data Table on Turkey - Market size and forecast 2025-2030 ($ million)
Chart on Turkey - Year-over-year growth 2025-2030 (%)
Data Table on Turkey - Year-over-year growth 2025-2030 (%)

12.7.5 Israel - Market size and forecast 2025-2030

Chart on Israel - Market size and forecast 2025-2030 ($ million)
Data Table on Israel - Market size and forecast 2025-2030 ($ million)
Chart on Israel - Year-over-year growth 2025-2030 (%)
Data Table on Israel - Year-over-year growth 2025-2030 (%)

12.8 Market opportunity by geography

Market opportunity by geography ($ million)
Data Tables on Market opportunity by geography ($ million)

13. Drivers, Challenges, and Opportunity

13.1 Market drivers

Rapid proliferation of social commerce and direct in-app purchase tracking
Expanding corporate allocations for influencer marketing and creator network analytics
Mandatory operational integration of generative artificial intelligence and natural query analytics

13.2 Market challenges

Data fragmentation across walled gardens and restricted application programming interfaces
Advanced sarcasm detection complexities and multilingual natural language inaccuracies
Rising international data privacy regulations and synthetic consumer tracking restraints

13.3 Impact of drivers and challenges

Impact of drivers and challenges in 2025 and 2030

13.4 Market opportunities

Strategic market consolidation through high-value corporate acquisitions and suite integration
Technical transition toward automated visual listening and multi-platform video recognition
Rapid emergence of autonomous agentic artificial intelligence and predictive narrative forecasting

14. Competitive Landscape

14.1 Overview

14.2

Overview on criticality of inputs and factors of differentiation

14.3 Landscape disruption

Overview on factors of disruption

14.4 Industry risks

Impact of key risks on business

15. Competitive Analysis

15.1 Companies profiled

Companies covered

15.2 Company ranking index

15.3 Market positioning of companies

Matrix on companies position and classification

15.4 Agorapulse SAS

Agorapulse SAS - Overview
Agorapulse SAS - Product / Service
Agorapulse SAS - Key offerings
SWOT

15.5 Brandwatch

Brandwatch - Overview
Brandwatch - Product / Service
Brandwatch - Key offerings
SWOT

15.6 BuzzSumo Ltd.

BuzzSumo Ltd. - Overview
BuzzSumo Ltd. - Product / Service
BuzzSumo Ltd. - Key offerings
SWOT

15.7 Emplifi Inc.

Emplifi Inc. - Overview
Emplifi Inc. - Product / Service
Emplifi Inc. - Key offerings
SWOT

15.8 Hootsuite Inc.

Hootsuite Inc. - Overview
Hootsuite Inc. - Product / Service
Hootsuite Inc. - Key offerings
SWOT

15.9 Ipsos Synthesio Inc

Ipsos Synthesio Inc - Overview
Ipsos Synthesio Inc - Product / Service
Ipsos Synthesio Inc - Key offerings
SWOT

15.10 LexisNexis

LexisNexis - Overview
LexisNexis - Product / Service
LexisNexis - Key offerings
SWOT

15.11 Meltwater NV

Meltwater NV - Overview
Meltwater NV - Product / Service
Meltwater NV - Key offerings
SWOT

15.12 Metricool

Metricool - Overview
Metricool - Product / Service
Metricool - Key offerings
SWOT

15.13 Nextiva Inc.

Nextiva Inc. - Overview
Nextiva Inc. - Product / Service
Nextiva Inc. - Key offerings
SWOT

15.14 Quid

Quid - Overview
Quid - Product / Service
Quid - Key offerings
SWOT

15.15 Sprinklr Inc.

Sprinklr Inc. - Overview
Sprinklr Inc. - Product / Service
Sprinklr Inc. - Key offerings
SWOT

15.16 Sprout Social Inc.

Sprout Social Inc. - Overview
Sprout Social Inc. - Product / Service
Sprout Social Inc. - Key offerings
SWOT

15.17 Talkwalker Sarl

Talkwalker Sarl - Overview
Talkwalker Sarl - Product / Service
Talkwalker Sarl - Key offerings
SWOT

15.18 YouScan Ltd.

YouScan Ltd. - Overview
YouScan Ltd. - Product / Service
YouScan Ltd. - Key offerings
SWOT

16. Appendix

16.1 Scope of the report

Market definition
Objectives
Notes and caveats

16.2 Inclusions and exclusions checklist

Inclusions checklist
Exclusions checklist

16.3 Currency conversion rates for US$

16.4 Research methodology

16.5 Data procurement

Information sources

16.6 Data validation

16.7 Validation techniques employed for market sizing

16.8 Data synthesis

16.9 360 degree market analysis

16.10 List of abbreviations

Research Methodology

Technavio presents a detailed picture of the market by way of study, synthesis, and summation of data from multiple sources. The analysts have presented the various facets of the market with a particular focus on identifying the key industry influencers. The data thus presented is comprehensive, reliable, and the result of extensive research, both primary and secondary.

INFORMATION SOURCES

Primary sources

  • Manufacturers and suppliers
  • Channel partners
  • Industry experts
  • Strategic decision makers

Secondary sources

  • Industry journals and periodicals
  • Government data
  • Financial reports of key industry players
  • Historical data
  • Press releases

DATA ANALYSIS

Data Synthesis

  • Collation of data
  • Estimation of key figures
  • Analysis of derived insights

Data Validation

  • Triangulation with data models
  • Reference against proprietary databases
  • Corroboration with industry experts

REPORT WRITING

Qualitative

  • Market drivers
  • Market challenges
  • Market trends
  • Five forces analysis

Quantitative

  • Market size and forecast
  • Market segmentation
  • Geographical insights
  • Competitive landscape

Interested in this report?

Get your sample now to see our research methodology and insights!

Download Now

Frequently Asked Questions

Social Media Listening market growth will increase by USD 5426.5 million during 2026-2030.

The Social Media Listening market is expected to grow at a CAGR of 9.2% during 2026-2030.

Social Media Listening market is segmented by Type (Software, Services) End-user (Retail and e-commerce, IT and telecom, BFSI, Media and entertainment, Others) Deployment (Cloud-based, On-premises, Hybrid)

Agorapulse SAS, Awario, Brandwatch, BuzzSumo Ltd., Critical Mention, Emplifi Inc., Hootsuite Inc., Ipsos Synthesio Inc, Keyhole, LexisNexis, Meltwater NV, Mention Solutions SAS, Metricool, Nextiva Inc., Onclusive Inc., Quid, Sprinklr Inc., Sprout Social Inc., Talkwalker Sarl, YouScan Ltd. are a few of the key vendors in the Social Media Listening market.

North America will register the highest growth rate of 31.6% among the other regions. Therefore, the Social Media Listening market in North America is expected to garner significant business opportunities for the vendors during the forecast period.

US, Canada, Mexico, Germany, UK, France, Italy, Spain, The Netherlands, China, India, Japan, South Korea, Australia, Indonesia, Brazil, Argentina, Chile, Saudi Arabia, UAE, South Africa, Turkey, Israel

  • Rapid proliferation of social commerce and direct in-app purchase tracking is the driving factor this market.

The Social Media Listening market vendors should focus on grabbing business opportunities from the Type segment as it accounted for the largest market share in the base year.
RIA - Research AI Assistant
Ask RIA
