Soda Ash Market Size 2025-2029
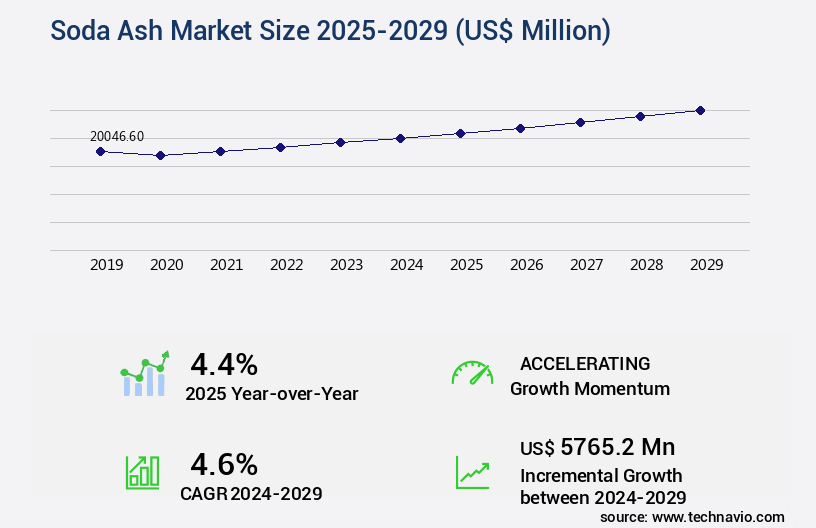
The soda ash market size is valued to increase by USD 5.77 billion, at a CAGR of 4.6% from 2024 to 2029. Increase in demand for soda ash from glass industry will drive the soda ash market.
Major Market Trends & Insights
- APAC dominated the market and accounted for a 65% growth during the forecast period.
- By Application - Glass segment was valued at USD 7.42 billion in 2023
- By Type - Light segment accounted for the largest market revenue share in 2023
Market Size & Forecast
- Market Opportunities: USD 41.79 million
- Market Future Opportunities: USD 5765.20 million
- CAGR from 2024 to 2029 : 4.6%
Market Summary
- Soda ash, a critical raw material in various industries, including glass, detergents, and chemical manufacturing, has witnessed significant market dynamics in recent years. The glass industry, in particular, has experienced a surge in demand for soda ash due to the increasing production of flat glass and container glass. This trend is driven by the growing construction sector, particularly in emerging economies, and the expanding beverage industry. Meanwhile, the manufacturing sector has responded by expanding capacities of soda ash production plants to meet the escalating demand. For instance, in 2020, a leading soda ash manufacturer announced an expansion of its production facility, aiming to increase its annual capacity by 25%.
- However, the market faces challenges due to the volatility in prices of raw materials, such as natural sodium carbonate and natural gas, which significantly impact the production costs. A real-world business scenario illustrates the importance of supply chain optimization in managing these market dynamics. A large glass manufacturing company faced operational inefficiencies due to inconsistent soda ash supply, leading to production delays and increased costs. By implementing a strategic sourcing approach, the company was able to secure long-term contracts with multiple soda ash suppliers, ensuring a stable supply and reducing the risk of price volatility. This proactive strategy resulted in a 15% reduction in production downtime and a 10% decrease in raw material costs.
What will be the Size of the Soda Ash Market during the forecast period?
Get Key Insights on Market Forecast (PDF) Request Free Sample
How is the Soda Ash Market Segmented ?
The soda ash industry research report provides comprehensive data (region-wise segment analysis), with forecasts and estimates in "USD million" for the period 2025-2029, as well as historical data from 2019-2023 for the following segments.
- Application
- Glass
- Soaps and detergents
- Chemicals
- Others
- Type
- Light
- Dense
- Product Type
- Synthetic
- Natural
- Geography
- North America
- US
- Europe
- France
- Germany
- Italy
- UK
- APAC
- Australia
- China
- India
- Japan
- South Korea
- Rest of World (ROW)
- North America
By Application Insights
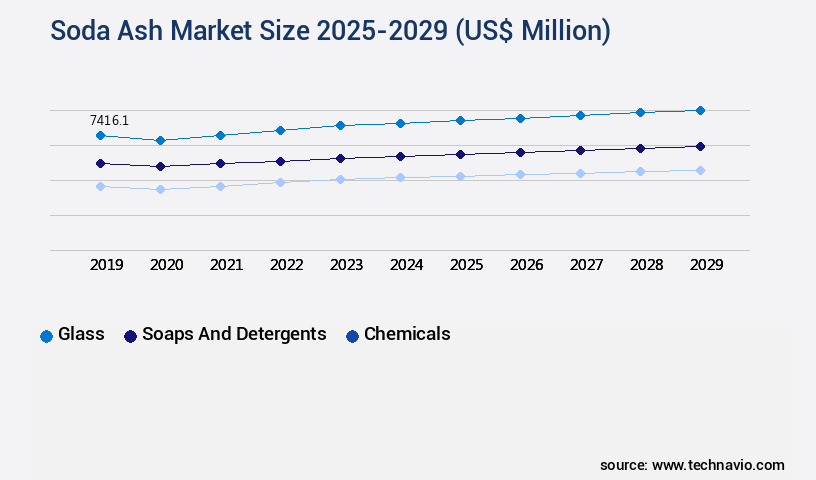
The glass segment is estimated to witness significant growth during the forecast period.
Soda ash, a crucial ingredient in the production of flat glass and container glass, plays a significant role in reducing energy consumption by 5-10% in the glass manufacturing process. The global glass industry is experiencing robust growth, driven by the escalating demand for high-performance glass from various sectors, including construction, automotive, and packaging. Flat glass, primarily used in windows and doors, is the major consumption segment, with the automotive and construction industries being the primary contributors. In 2020, US exports of glass and glassware amounted to USD6.3 billion. To cater to this expanding market, manufacturers are focusing on optimizing their supply chains, improving production yields, and enhancing safety protocols.
Technological advancements in process automation systems, filtration technology, and material handling systems are being adopted to ensure product quality and environmental compliance. Additionally, the integration of process monitoring systems, byproduct recovery, and wastewater treatment facilitates resource efficiency improvements and environmental impact assessment. The Sodium Carbonate industry is continually evolving, with ongoing research in crystallization process control, thermal decomposition, and the Solvay process efficiency to further reduce energy consumption and improve production yield.
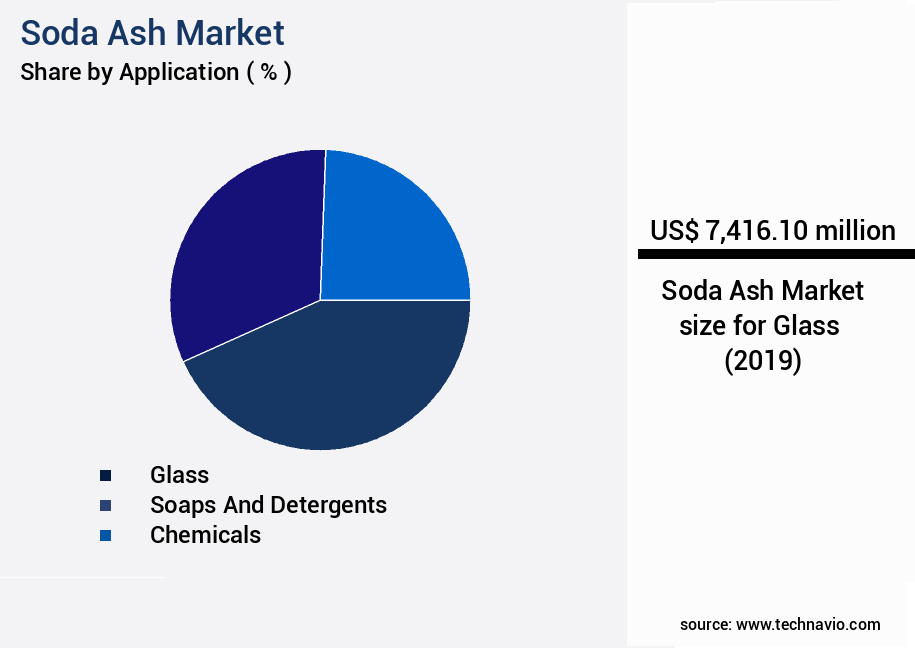
The Glass segment was valued at USD 7.42 billion in 2019 and showed a gradual increase during the forecast period.
Regional Analysis
APAC is estimated to contribute 65% to the growth of the global market during the forecast period.Technavio’s analysts have elaborately explained the regional trends and drivers that shape the market during the forecast period.

See How Soda Ash Market Demand is Rising in APAC Request Free Sample
The market is experiencing significant evolution, with the Asia-Pacific region spearheading its growth. This dynamic is driven by the region's expansive industrial base and sustained demand across key end-use sectors, such as glass production, detergents, and chemical processing. The manufacturing intensity in these industries ensures a stable consumption pattern for soda ash. Urbanization and infrastructure development further reinforce demand, as these activities necessitate materials that rely on soda ash as a critical input. Moreover, the presence of integrated production facilities and access to raw materials in the Asia-Pacific region support supply chain efficiency. This reduces dependency on imports and enhances cost competitiveness.
According to industry reports, the region accounted for approximately 55% of the global soda ash consumption in 2020. The operational landscape of soda ash production and distribution in the Asia-Pacific is influenced by government policies. For instance, China, the world's largest soda ash producer, implemented production capacity cuts in 2020 to address environmental concerns, impacting the market's supply-demand balance. In conclusion, the Asia-Pacific region's robust industrial base, sustained demand, and government policies create a favorable environment for the market. The region's manufacturing intensity and supply chain efficiency contribute to operational efficiency gains and cost reductions, making it a significant player in the global market.
Market Dynamics
Our researchers analyzed the data with 2024 as the base year, along with the key drivers, trends, and challenges. A holistic analysis of drivers will help companies refine their marketing strategies to gain a competitive advantage.
The market is a significant player in the chemical industry, with applications ranging from glass and detergent manufacturing to the production of baking soda and chemical intermediates. To remain competitive, companies in this market are continually seeking ways to optimize sodium carbonate production yield and improve energy efficiency in processes such as the ammonia-soda method. One area of focus is industrial-grade sodium carbonate purification, which involves advanced filtration techniques and salt brine purification to ensure high-quality product. Wastewater treatment is another critical aspect, with strategies to reduce carbon dioxide emissions and minimize waste generation being essential for sustainable production. Safety protocols are also a priority in soda ash production, with a focus on equipment reliability and process control for optimal crystal size distribution. Lime production and its impact on soda ash quality are closely monitored, with byproduct recovery and resource efficiency being key considerations. Environmental impact assessments are essential in the soda ash industry, with a focus on reducing energy consumption in the Solvay process and minimizing waste generation. Chemical reaction kinetics play a significant role in soda ash synthesis, with quality control metrics ensuring consistent product output. Material handling systems in soda ash facilities are optimized for efficiency and safety, with process optimization using data analytics becoming increasingly common. Improving equipment reliability and reducing energy consumption are ongoing priorities, as is minimizing waste generation through salt brine recycling and other innovative techniques. In conclusion, the market is a dynamic and evolving industry, with a focus on optimizing production yield, improving energy efficiency, ensuring product quality, and minimizing environmental impact. Companies that can effectively navigate these challenges will be well-positioned for success in this competitive market.
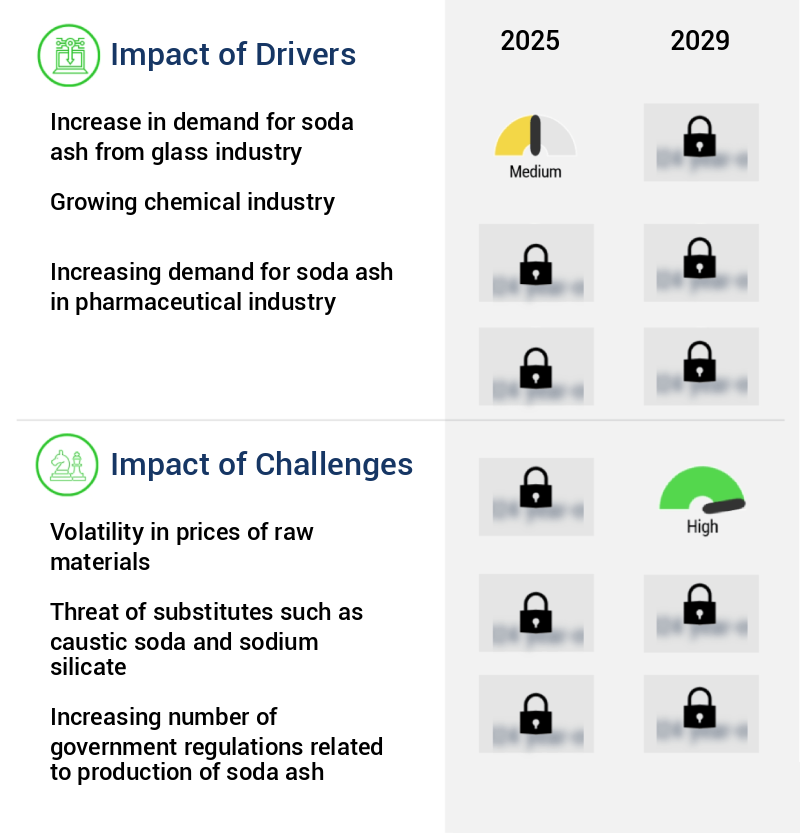
What are the key market drivers leading to the rise in the adoption of Soda Ash Industry?
- The glass industry's rising demand for soda ash serves as the primary market driver.
- The market is significantly influenced by the glass industry, which accounts for over half of the global soda ash consumption. With the expanding glass industry, driven by growing demand from the automotive and construction sectors, major glass manufacturers like Saint-Gobain, BGF Glass Co., and Sisecam have increased their production capacities. This industry growth positively impacts the market, as it is a crucial fluxing agent in glass production.
- Furthermore, the global population is projected to reach 9.8 billion by 2050, leading to increased infrastructure development and construction activities, thereby boosting the demand for soda ash. These trends contribute to the market's continuous growth and improved business outcomes, including increased production efficiency and reduced downtime for glass manufacturers.
What are the market trends shaping the Soda Ash Industry?
- Soda ash manufacturing plants are experiencing expansion in their capacities, representing a current market trend.
- The market is experiencing significant growth, driven primarily by its applications in glass and detergent manufacturing sectors. In response to this increasing demand, leading producers like Tata Chemicals, Solvay, Genesis Energy, and GHCL are expanding their soda ash production capacities. For example, Tata Chemicals has announced an investment of approximately USD96.4 million to boost its capacity by 1 million tonnes, reaching a total of 5.3 million tonnes annually.
- Similarly, GHCL has secured environmental clearance for a new soda ash complex in Gujarat, India, with an initial capacity of 1 million tonnes. These investments underscore the market's evolving nature and the commitment of key players to meet the growing demand for soda ash.
What challenges does the Soda Ash Industry face during its growth?
- The volatility in the prices of raw materials poses a significant challenge and impedes the growth of the industry.
- The market has experienced significant fluctuations due to the evolving nature of raw material prices, primarily coal and natural gas. The global surge in demand for these energy resources, coupled with geopolitical uncertainties and trade disputes, has resulted in price volatility. For instance, the ongoing trade war between China and the US has negatively impacted the prices of coking coal and natural gas, which are essential feedstocks in soda ash production. Moreover, the rising costs of furnace fuel used in the manufacturing process have further hampered market growth.
- Major soda ash producers, such as BASF and GHCL, have been affected by these volatile prices, leading to operational challenges. Despite these hurdles, the market continues to serve essential applications, including the production of glass, detergent, and chemical industries. The market's resilience underscores its strategic importance in various industries, making it a vital component of the global industrial landscape.
Exclusive Technavio Analysis on Customer Landscape
The soda ash market forecasting report includes the adoption lifecycle of the market, covering from the innovator’s stage to the laggard’s stage. It focuses on adoption rates in different regions based on penetration. Furthermore, the soda ash market report also includes key purchase criteria and drivers of price sensitivity to help companies evaluate and develop their market growth analysis strategies.
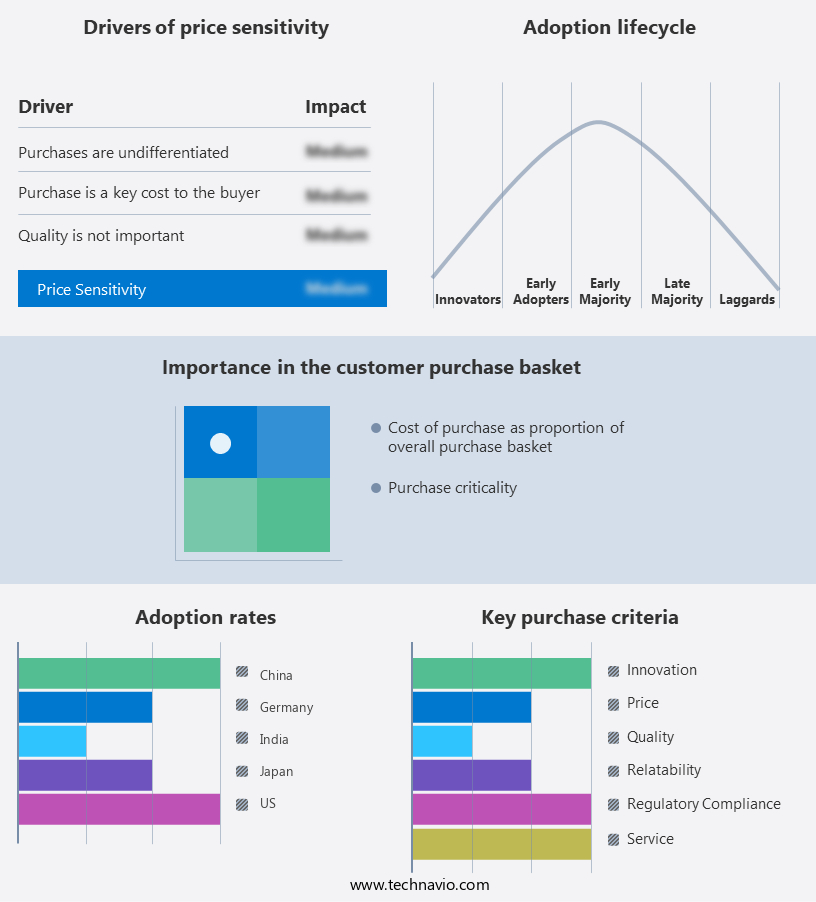
Customer Landscape of Soda Ash Industry
Competitive Landscape
Companies are implementing various strategies, such as strategic alliances, soda ash market forecast, partnerships, mergers and acquisitions, geographical expansion, and product/service launches, to enhance their presence in the industry.
BASF SE - Soda ash, a vital ingredient in diverse industries, serves essential functions in various applications. In the paper and textile sectors, it facilitates bleaching processes. Simultaneously, it plays a crucial role in the glass and silicate industry and diverse chemical processes. The versatile nature of soda ash extends its use across multiple industries, enhancing their production processes.
The industry research and growth report includes detailed analyses of the competitive landscape of the market and information about key companies, including:
- BASF SE
- Ciech SA
- Ciner Group
- DCW Ltd.
- Destiny Chemicals
- Genesis Energy LP
- GHCL Ltd.
- Hydrite Chemical Co.
- Lianyungang Soda Ash Co. Ltd.
- Nirma Ltd.
- OCI Co. Ltd.
- Solvay SA
- TANGSHAN SANYOU CHEMICAL INDUSTRIES CO. LTD.
- Tata Chemicals Ltd.
- Telford Industries
- The Chemical Co.
- Tokuyama Corp.
- TURKIYE SISE VE CAM FABRIKALARI A.S.
Qualitative and quantitative analysis of companies has been conducted to help clients understand the wider business environment as well as the strengths and weaknesses of key industry players. Data is qualitatively analyzed to categorize companies as pure play, category-focused, industry-focused, and diversified; it is quantitatively analyzed to categorize companies as dominant, leading, strong, tentative, and weak.
Recent Development and News in Soda Ash Market
- In August 2024, Solvay, a leading global chemical company, announced the expansion of its soda ash production capacity at its European site in France. The €100 million investment aims to increase production by 25%, making Solvay the largest soda ash producer in Europe (Solvay press release, 2024).
- In November 2024, OCI NV, a global producer of fertilizers and industrial chemicals, signed a strategic partnership with Nouryon, a specialty chemicals company. The collaboration focused on the production and marketing of soda ash derivatives, expanding their product offerings and strengthening their market position (OCI NV press release, 2024).
- In February 2025, Tata Chemicals, an Indian multinational, completed the acquisition of the US-based soda ash business of Chemtrade Logistics Income Fund. The deal, valued at approximately USD330 million, significantly increased Tata Chemicals' global soda ash capacity and market share (Tata Chemicals press release, 2025).
- In May 2025, the European Union announced the approval of a new regulatory framework for the soda ash industry. The framework aims to reduce greenhouse gas emissions by 40% by 2030 and includes incentives for the adoption of low-carbon production technologies (European Commission press release, 2025).
Dive into Technavio’s robust research methodology, blending expert interviews, extensive data synthesis, and validated models for unparalleled Soda Ash Market insights. See full methodology.
|
Market Scope |
|
|
Report Coverage |
Details |
|
Page number |
219 |
|
Base year |
2024 |
|
Historic period |
2019-2023 |
|
Forecast period |
2025-2029 |
|
Growth momentum & CAGR |
Accelerate at a CAGR of 4.6% |
|
Market growth 2025-2029 |
USD 5765.2 million |
|
Market structure |
Fragmented |
|
YoY growth 2024-2025(%) |
4.4 |
|
Key countries |
China, India, US, Japan, South Korea, Australia, Germany, UK, France, and Italy |
|
Competitive landscape |
Leading Companies, Market Positioning of Companies, Competitive Strategies, and Industry Risks |
Research Analyst Overview
- The market continues to evolve, driven by advancements in purification techniques and process automation systems. Industrial-grade sodium carbonate, a key component of soda ash, is essential in various sectors, including glass manufacturing and lime production methods. Wastewater treatment applications are also gaining traction, with sodium carbonate playing a crucial role in material handling systems and filtration technology. Supply chain optimization and chemical reaction kinetics are critical areas of focus for market participants. For instance, a leading glass manufacturer improved production yield by 10% through optimized ammonia-soda process efficiency and energy consumption reduction. Furthermore, the industry anticipates a 5% annual growth rate, driven by demand for byproduct recovery in detergent manufacturing and the solvay process efficiency.
- Storage and handling, safety protocols implementation, and environmental compliance are other key areas of concern. Thermal decomposition and drying techniques are undergoing continuous improvement to enhance process monitoring systems and crystallization process control. Additionally, distribution network efficiency and product quality control are essential for maintaining customer satisfaction and market competitiveness. Environmental impact assessment and quality assurance protocols are becoming increasingly important, with process safety management and resource efficiency improvements at the forefront of market activities. Byproduct recovery and salt brine purification are also gaining significance, as market participants strive for sustainability and cost savings.
What are the Key Data Covered in this Soda Ash Market Research and Growth Report?
-
What is the expected growth of the Soda Ash Market between 2025 and 2029?
-
USD 5.77 billion, at a CAGR of 4.6%
-
-
What segmentation does the market report cover?
-
The report is segmented by Application (Glass, Soaps and detergents, Chemicals, and Others), Type (Light and Dense), Product Type (Synthetic and Natural), and Geography (APAC, Europe, North America, Middle East and Africa, and South America)
-
-
Which regions are analyzed in the report?
-
APAC, Europe, North America, Middle East and Africa, and South America
-
-
What are the key growth drivers and market challenges?
-
Increase in demand for soda ash from glass industry, Volatility in prices of raw materials
-
-
Who are the major players in the Soda Ash Market?
-
BASF SE, Ciech SA, Ciner Group, DCW Ltd., Destiny Chemicals, Genesis Energy LP, GHCL Ltd., Hydrite Chemical Co., Lianyungang Soda Ash Co. Ltd., Nirma Ltd., OCI Co. Ltd., Solvay SA, TANGSHAN SANYOU CHEMICAL INDUSTRIES CO. LTD., Tata Chemicals Ltd., Telford Industries, The Chemical Co., Tokuyama Corp., and TURKIYE SISE VE CAM FABRIKALARI A.S.
-
Market Research Insights
- The market for soda ash is a dynamic and ever-evolving industry that plays a crucial role in various sectors, including glass manufacturing and water treatment. According to industry reports, The market size was valued at over 20 million metric tons in 2020, with a significant growth expectation of more than 3% annually. One notable trend in the market is the continuous focus on cost reduction and efficiency improvement. For instance, a leading glass manufacturer successfully increased its production capacity by 15% through the implementation of batch processing optimization and energy-efficient technologies. Furthermore, the industry is witnessing a growing emphasis on emission control and environmental monitoring to minimize the environmental impact of production processes.
- These efforts are essential as the demand for soda ash continues to expand, driven by the increasing need for high-quality glass products and water treatment applications. With the ongoing advancements in technology and the commitment to sustainability, the future of the market remains promising.
We can help! Our analysts can customize this soda ash market research report to meet your requirements.
 RIA -
RIA - 
