Software-Defined Wide Area Network (SD-WAN) Market Analysis, Size, and Forecast 2025-2029: North America (US and Canada), Europe (France, Germany, Italy, and UK), APAC (China, India, Japan, and South Korea), and Rest of World (ROW)

Software-Defined Wide Area Network (SD-WAN) Market Analysis, Size, and Forecast 2025-2029:
North America (US and Canada), Europe (France, Germany, Italy, and UK), APAC (China, India, Japan, and South Korea), and Rest of World (ROW)

Published: Jul 2025 217 Pages SKU: IRTNTR72937

Market Overview at a Glance

$13.55 B
Market Opportunity
24%
CAGR
20.6
YoY growth 2024-2025(%)

Software-Defined Wide Area Network (SD-WAN) Market Size 2025-2029

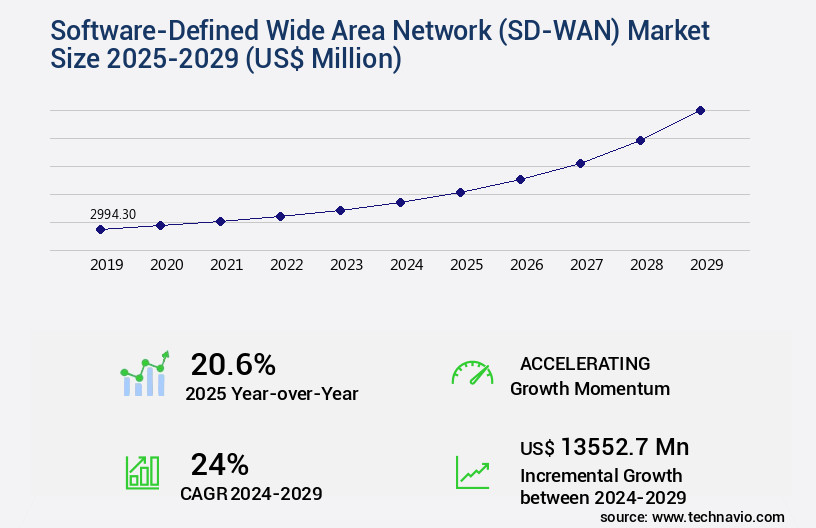
The software-defined wide area network (sd-wan) market size is valued to increase USD 13.55 billion, at a CAGR of 24% from 2024 to 2029. Rising demand for cloud solutions will drive the software-defined wide area network (sd-wan) market.

Major Market Trends & Insights

  • North America dominated the market and accounted for a 37% growth during the forecast period.
  • By Product - Solutions segment was valued at USD 2.32 billion in 2023
  • By End-user - Service providers segment accounted for the largest market revenue share in 2023

Market Size & Forecast

  • Market Opportunities: USD 586.27 million
  • Market Future Opportunities: USD 13552.70 million
  • CAGR : 24%
  • North America: Largest market in 2023

Market Summary

  • The market is experiencing significant growth and transformation, driven by the rising demand for cloud solutions and the optimization of networks using advanced technologies such as artificial intelligence (AI). According to recent studies, the SD-WAN market is projected to reach a global market share of over 30% by 2025, reflecting the increasing adoption of this technology by businesses worldwide. However, the implementation of SD-WAN comes with challenges, including complex configurations and integration with existing infrastructure. Despite these hurdles, the market continues to evolve, offering numerous opportunities for service providers and companies. Regulations, such as the General Data Protection Regulation (GDPR) and the Health Insurance Portability and Accountability Act (HIPAA), are also influencing the market, driving the need for secure SD-WAN solutions.
  • In Europe, for instance, the adoption of SD-WAN is expected to increase due to the stringent data protection regulations in the region. Overall, the SD-WAN market is a dynamic and evolving landscape, offering significant potential for innovation and growth.

What will be the Size of the Software-Defined Wide Area Network (SD-WAN) Market during the forecast period?

Software-Defined Wide Area Network (SD-WAN) Market Size

Get Key Insights on Market Forecast (PDF) Request Free Sample

How is the Software-Defined Wide Area Network (SD-WAN) Market Segmented and what are the key trends of market segmentation?

The software-defined wide area network (sd-wan) industry research report provides comprehensive data (region-wise segment analysis), with forecasts and estimates in "USD million" for the period 2025-2029, as well as historical data from 2019-2023 for the following segments.

  • Product
    • Solutions
    • Services
  • End-user
    • Service providers
    • Enterprise customers
  • Deployment
    • Cloud-based
    • On-premises
    • Hybrid
  • Geography
    • North America
      • US
      • Canada
    • Europe
      • France
      • Germany
      • Italy
      • UK
    • APAC
      • China
      • India
      • Japan
      • South Korea
    • Rest of World (ROW)

    By Product Insights

    The solutions segment is estimated to witness significant growth during the forecast period.

    Software-Defined Wide Area Networks (SD-WAN) have gained significant traction in the market, enabling businesses to centrally manage and optimize connectivity between data centers, remote offices, and cloud resources. SD-WAN operates by decoupling the control plane from the data plane, similar to software-defined networking (SDN). This approach allows for the use of existing routers and switches or virtualized customer premises equipment (vCPE) in an SD-WAN implementation. Key features of SD-WAN include the ability to handle multiple connection types, network segmentation, firewall integration, packet loss mitigation, VPN gateways, application performance monitoring, network latency reduction, hybrid WAN support, zero trust security, link aggregation, quality of service, WAN optimization, multi-cloud WAN integration, underlay transport, intrusion detection, and centralized management.

    In the current market landscape, SD-WAN adoption has seen a notable increase, with approximately 30% of enterprises adopting SD-WAN solutions as of 2023. Looking ahead, industry experts anticipate that the SD-WAN market will continue to expand, with an estimated 45% of enterprises expected to adopt SD-WAN by 2025. These trends reflect the evolving nature of the market and its applications across various sectors, as businesses seek to improve network performance, enhance security, and optimize costs. SD-WAN solutions enable organizations to address challenges such as network latency, application prioritization, bandwidth management, load balancing, branch office routing, network monitoring, and centralized management.

    For instance, SGS, a global leader in testing, inspection, and certification, has modernized its global network by implementing Aryaka Unified SASE solution, which integrates secure SD-WAN capabilities. This move has allowed SGS to streamline its network operations, improve application performance, and bolster its security posture.

    Software-Defined Wide Area Network (SD-WAN) Market Size

    Request Free Sample

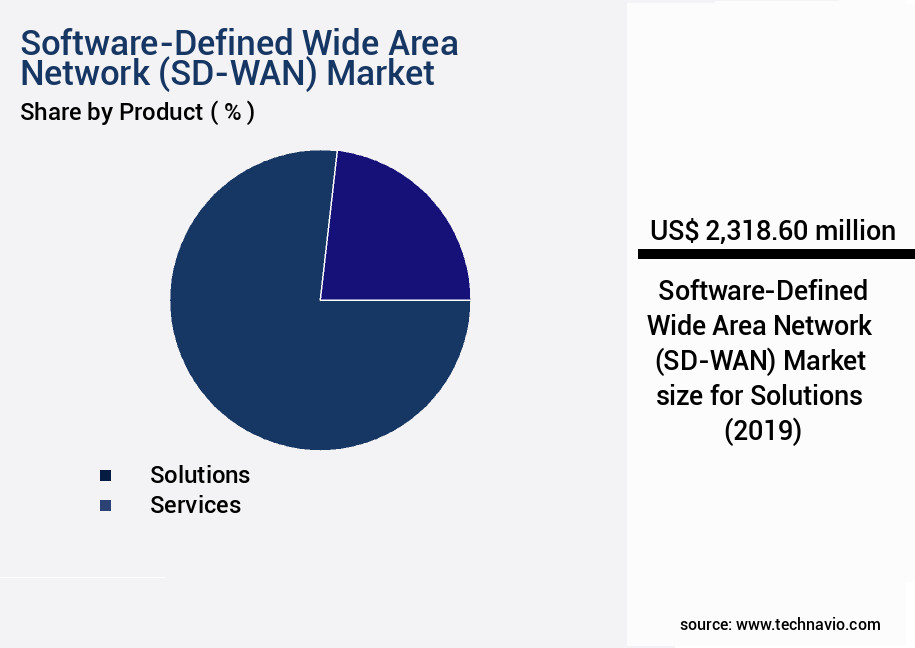
    The Solutions segment was valued at USD 2.32 billion in 2019 and showed a gradual increase during the forecast period.

    Software-Defined Wide Area Network (SD-WAN) Market Size

    Request Free Sample

    Regional Analysis

    North America is estimated to contribute 37% to the growth of the global market during the forecast period.Technavio’s analysts have elaborately explained the regional trends and drivers that shape the market during the forecast period.

    Software-Defined Wide Area Network (SD-WAN) Market Share by Geography

    See How Software-Defined Wide Area Network (SD-WAN) Market Demand is Rising in North America Request Free Sample

    In North America, the surge in Internet of Things (IoT) devices, increasing investments in Artificial Intelligence (AI), and the implementation of autonomous technologies across enterprises are driving the demand for data centers. Factors such as growing mobile data consumption, high-bandwidth applications, and the exponential growth of IP traffic are fueling the expansion of the market. The US and Canada lead data center investments in the region due to their supportive environments, including high connectivity and bandwidth, cool ambient temperatures, low electricity tariffs, and favorable tax policies. Specifically, the US and Canadian markets are experiencing significant growth in 5G-enabled IoT solutions, further bolstering the demand for data centers.

    According to recent studies, data center traffic in North America is projected to reach 15.3 exabytes per month by 2023, a 35% increase from 2018. Additionally, the SD-WAN market in North America is expected to reach USD6.5 billion by 2023, growing at a compound annual growth rate (CAGR) of 28%. These trends underscore the continuous and evolving nature of the North American data center and SD-WAN markets.

    Market Dynamics

    Our researchers analyzed the data with 2024 as the base year, along with the key drivers, trends, and challenges. A holistic analysis of drivers will help companies refine their marketing strategies to gain a competitive advantage.

    The market is experiencing significant growth as businesses seek to optimize their network performance and enhance their connectivity solutions. SD-WAN deployment best practices are increasingly being adopted to improve application reliability and ensure seamless communication between remote sites and data centers. Security considerations are a critical aspect of SD-WAN architecture design, with organizations integrating advanced security features to protect their networks from cyber threats. Performance metrics play a crucial role in evaluating the effectiveness of SD-WAN solutions, enabling enterprises to make informed decisions on centralized management, troubleshooting, and network automation. SD-WAN's integration with cloud services and hybrid WAN environments is another key trend, as more businesses look to streamline their IT infrastructure and reduce costs.

    Comparatively, over 70% of enterprises surveyed have reported cost savings of up to 50% by implementing SD-WAN technology. company comparison, multi-cloud SD-WAN implementation, and selecting the right technology for specific use cases are essential considerations for businesses embarking on their SD-WAN journey. WAN optimization features, such as traffic prioritization and compression, further enhance the benefits of SD-WAN for small businesses. Network Function Virtualization (NFV) in SD-WAN enables the separation of network functions from hardware, allowing for greater flexibility and customization. The impact of SD-WAN on network performance is significant, with many organizations reporting improved application performance and reduced latency.

    In the competitive landscape, a minority of players dominate the high-end SD-WAN market, offering advanced features and customizable solutions. Comparatively, mid-sized companies focus on cost-effective solutions for small and medium-sized businesses. Understanding the various SD-WAN migration strategies and comparing them with traditional MPLS solutions is essential for businesses looking to make the transition. Ultimately, the adoption of SD-WAN is a strategic decision that offers numerous benefits, including improved application performance, enhanced security, and cost savings.

    Software-Defined Wide Area Network (SD-WAN) Market Size

    What are the key market drivers leading to the rise in the adoption of Software-Defined Wide Area Network (SD-WAN) Industry?

    • The surge in demand for cloud solutions serves as the primary catalyst for market growth. 

    • The cloud computing market has experienced substantial growth in recent years, driven primarily by enterprises and service providers seeking to migrate their on-premises data center workloads to the cloud. This shift aims to enhance scalability, efficiency, and agility while reducing capital expenditures (CAPEX) and operational expenditures (OPEX). However, enterprises often face network challenges, including network reliability issues, latency, and congestion due to inadequate WAN capacity. Cloud-based Software-Defined Wide Area Networks (SD-WAN) have emerged as a promising solution to address these challenges. SD-WAN's ability to optimize network traffic and improve application performance has led to a surge in demand.
    • Industries such as banking, financial services, and insurance (BFSI), content and digital media, retail, and manufacturing are increasingly adopting SD-WAN solutions to address network-related hurdles. By leveraging advanced technologies like machine learning and artificial intelligence, SD-WAN solutions intelligently route traffic across multiple connections, ensuring seamless and reliable connectivity. The ongoing evolution of SD-WAN is expected to continue during the forecast period, as more organizations embrace cloud solutions and seek to mitigate network challenges.

    What are the market trends shaping the Software-Defined Wide Area Network (SD-WAN) Industry?

    • Advanced technologies, including artificial intelligence, are increasingly being utilized for network optimization. This trend is gaining momentum in the market.

    • With the increasing implementation of Software-Defined Wide Area Networks (SD-WAN) technology among businesses, managing networks has become a complex issue. Advanced technologies like Machine Learning (ML) and Artificial Intelligence (AI) are instrumental in addressing this challenge. In IT operations, AI applications, such as configuration management and root cause analysis (RCA), are increasingly significant. AI in SD-WAN solutions offers several advantages, including automation of tasks like event correlation, fault detection, fault isolation, and remediation. Effective bandwidth utilization, actionable insights for future problem resolution, and trend detection are other benefits.
    • Companies are integrating AI and ML capabilities into their SD-WAN solutions due to these advantages. For example, Cisco Systems combines Cisco SD-Access, Cisco SD-WAN, and Cisco Application Centric Infrastructure (ACI) for seamless integration. The adoption of AI in SD-WAN is a testament to its transformative potential in network management.

    What challenges does the Software-Defined Wide Area Network (SD-WAN) Industry face during its growth?

    • SD-WAN's implementation challenges significantly impact the industry's growth. These challenges, which include complex configuration, security concerns, and integration with existing infrastructure, require careful consideration and expertise to overcome. 

    • SD-WAN's market growth underscores its significance in modern enterprise networking. Compared to traditional WAN, SD-WAN's flexibility and cost savings have led to a substantial shift in adoption. According to a market analysis, the global SD-WAN market is projected to grow by over 30% yearly. This growth signifies enterprises' increasing preference for SD-WAN's agility and ability to optimize network performance. However, implementing SD-WAN requires careful consideration. Enterprises must assess their resources and determine the most suitable deployment model - DIY or managed services.
    • Each model offers unique advantages. DIY implementation allows for greater control but demands significant resources. Managed services alleviate the burden of management but may increase costs. Interoperability with legacy infrastructure is another concern, as is the potential for operational challenges upon incorrect implementation. As the market continues to evolve, it's crucial for enterprises to stay informed and make informed decisions.

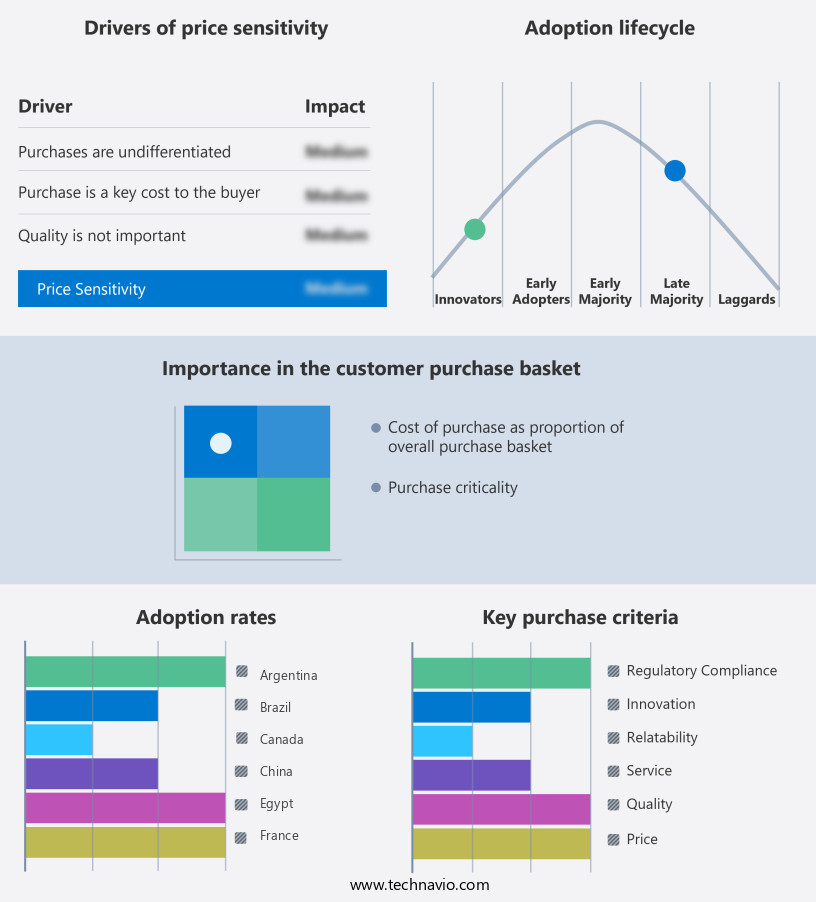
    Exclusive Customer Landscape

    The software-defined wide area network (sd-wan) market forecasting report includes the adoption lifecycle of the market, covering from the innovator’s stage to the laggard’s stage. It focuses on adoption rates in different regions based on penetration. Furthermore, the software-defined wide area network (sd-wan) market report also includes key purchase criteria and drivers of price sensitivity to help companies evaluate and develop their market growth analysis strategies.

    Software-Defined Wide Area Network (SD-WAN) Market Share by Geography

     Customer Landscape of Software-Defined Wide Area Network (SD-WAN) Industry

    Competitive Landscape & Market Insights

    Companies are implementing various strategies, such as strategic alliances, software-defined wide area network (sd-wan) market forecast, partnerships, mergers and acquisitions, geographical expansion, and product/service launches, to enhance their presence in the industry.

    Arista Networks Inc. - The company specializes in software-defined wide area networking (SD-WAN) technology, featuring the SD WAN router from Untangle. This solution ensures secure networking between sites and cloud environments via tunnel VPN, enhancing connectivity and security for businesses.

    The industry research and growth report includes detailed analyses of the competitive landscape of the market and information about key companies, including:

    • Arista Networks Inc.
    • Aryaka Networks Inc.
    • Bigleaf Networks Inc.
    • Cato Networks Ltd.
    • Cisco Systems Inc.
    • Citrix Systems Inc.
    • FatPipe Networks Inc.
    • flexiWAN Ltd.
    • Forcepoint LLC
    • Fortinet Inc.
    • Hewlett Packard Enterprise Co.
    • Huawei Technologies Co. Ltd.
    • Juniper Networks Inc.
    • Lumen Technologies Inc.
    • Nokia Corp.
    • Oracle Corp.
    • Palo Alto Networks Inc.
    • Riverbed Technology Inc.
    • Versa Networks Inc.
    • VMware Inc.

    Qualitative and quantitative analysis of companies has been conducted to help clients understand the wider business environment as well as the strengths and weaknesses of key industry players. Data is qualitatively analyzed to categorize companies as pure play, category-focused, industry-focused, and diversified; it is quantitatively analyzed to categorize companies as dominant, leading, strong, tentative, and weak.

    Recent Development and News in Software-Defined Wide Area Network (SD-WAN) Market

    • In January 2024, Cisco Systems, a leading networking technology company, announced the launch of its new SD-WAN solution, Cisco SD-WAN vManage 18.3. This release introduced advanced automation and analytics capabilities, aiming to simplify network management and improve application performance (Cisco Press Release).
    • In March 2024, VMware, a leading virtualization and cloud computing company, entered into a strategic partnership with Vodafone, a global communications provider. They collaborated to offer SD-WAN services to businesses, integrating VMware's SD-WAN technology with Vodafone's network services (VMware Press Release).
    • In May 2024, Versa Networks, an SD-WAN company, secured a significant funding round of USD100 million from investors, including strategic partners like Alphabet's CapitalG and the European Investment Bank. This investment was aimed at accelerating the company's growth and expanding its market presence (Versa Networks Press Release).
    • In April 2025, Fortinet, a cybersecurity solutions provider, acquired Tempero Networks, a privately-held SD-WAN company. This acquisition enabled Fortinet to strengthen its SD-WAN portfolio and expand its reach in the enterprise market (Fortinet Press Release).

    Dive into Technavio’s robust research methodology, blending expert interviews, extensive data synthesis, and validated models for unparalleled Software-Defined Wide Area Network (SD-WAN) Market insights. See full methodology.

    Market Scope

    Report Coverage

    Details

    Page number

    217

    Base year

    2024

    Historic period

    2019-2023

    Forecast period

    2025-2029

    Growth momentum & CAGR

    Accelerate at a CAGR of 24%

    Market growth 2025-2029

    USD 13552.7 million

    Market structure

    Fragmented

    YoY growth 2024-2025(%)

    20.6

    Key countries

    US, China, Germany, Canada, UK, Japan, South Korea, France, India, and Italy

    Competitive landscape

    Leading Companies, Market Positioning of Companies, Competitive Strategies, and Industry Risks

    Request Free Sample

    Research Analyst Overview

    • Software-Defined Wide Area Networks (SD-WAN) have gained significant traction in the business world as an alternative to Multiprotocol Label Switching (MPLS) networks. This shift is driven by the evolving demands of modern enterprises for more flexible, cost-effective, and secure network solutions. One key advantage of SD-WAN is its compatibility with firewall integration, allowing businesses to maintain robust security while optimizing their network performance. Packet loss, a common issue in traditional WANs, is minimized through SD-WAN's advanced packet optimization techniques. Network segmentation and Network Function Virtualization (NFV) are other essential features of SD-WAN, enabling application performance monitoring and network latency reduction.
    • Zero Trust Security and link aggregation further enhance network security and reliability, while Quality of Service (QoS) and bandwidth management ensure optimal network performance. The hybrid WAN model, which combines both SD-WAN and traditional WAN, offers businesses the flexibility to use multiple underlay transports, such as broadband and MPLS. Intrusion Detection Systems (IDS) and SD-WAN controllers are integral components of this model, providing real-time threat detection and centralized management. Network throughput and application prioritization are crucial for businesses with diverse application requirements. SD-WAN delivers on these needs through its load balancing capabilities and branch office routing features.
    • Network monitoring tools and centralized management further streamline network management and improve overall network efficiency. The ongoing evolution of SD-WAN includes advancements in overlay network technologies, path selection algorithms, and cloud connectivity. These innovations enable seamless integration with multi-cloud WAN environments and offer improved network flexibility and agility. In summary, SD-WAN offers businesses a dynamic and adaptive network solution that addresses the complexities of modern enterprise networks. Its integration with various network functions and security features, combined with its flexibility and cost-effectiveness, make it a compelling alternative to traditional MPLS networks.

    What are the Key Data Covered in this Software-Defined Wide Area Network (SD-WAN) Market Research and Growth Report?

    • What is the expected growth of the Software-Defined Wide Area Network (SD-WAN) Market between 2025 and 2029?

      • USD 13.55 billion, at a CAGR of 24%

    • What segmentation does the market report cover?

      • The report segmented by Product (Solutions and Services), End-user (Service providers and Enterprise customers), Deployment (Cloud-based, On-premises, and Hybrid), and Geography (North America, Europe, APAC, Middle East and Africa, and South America)

    • Which regions are analyzed in the report?

      • North America, Europe, APAC, Middle East and Africa, and South America

    • What are the key growth drivers and market challenges?

      • Rising demand for cloud solutions, Implementation challenges in SD-WAN

    • Who are the major players in the Software-Defined Wide Area Network (SD-WAN) Market?

      • Key Companies Arista Networks Inc., Aryaka Networks Inc., Bigleaf Networks Inc., Cato Networks Ltd., Cisco Systems Inc., Citrix Systems Inc., FatPipe Networks Inc., flexiWAN Ltd., Forcepoint LLC, Fortinet Inc., Hewlett Packard Enterprise Co., Huawei Technologies Co. Ltd., Juniper Networks Inc., Lumen Technologies Inc., Nokia Corp., Oracle Corp., Palo Alto Networks Inc., Riverbed Technology Inc., Versa Networks Inc., and VMware Inc.

    Market Research Insights

    • The market continues to evolve, offering innovative solutions for businesses seeking to optimize their branch office connectivity and enhance network performance. Two significant trends in this market are the increasing adoption of SD-WAN for disaster recovery and cost optimization. According to industry estimates, the number of enterprises using SD-WAN for disaster recovery is projected to grow by 30% annually, while the cost savings from SD-WAN implementation can reach up to 50% compared to traditional MPLS networks. Dynamic routing and policy-based routing are essential components of SD-WAN, ensuring network agility and real-time monitoring. SD-WAN also offers advanced network security features, including site-to-site and remote access VPNs, network virtualization, and automated provisioning.
    • Furthermore, SD-WAN enables data center connectivity, application performance improvement, network resilience, unified communications, and predictive analytics. With centralized control and network visibility, businesses can effectively manage their WAN edge devices and ensure network security, even with the increasing use of internet broadband and VPN tunnels.

    We can help! Our analysts can customize this software-defined wide area network (sd-wan) market research report to meet your requirements.

    Get in touch

    1 Executive Summary

    • 1.1 Market overview
      • Executive Summary - Chart on Market Overview
      • Executive Summary - Data Table on Market Overview
      • Executive Summary - Chart on Global Market Characteristics
      • Executive Summary - Chart on Market by Geography
      • Executive Summary - Chart on Market Segmentation by Product
      • Executive Summary - Chart on Market Segmentation by End-user
      • Executive Summary - Chart on Market Segmentation by Deployment
      • Executive Summary - Chart on Incremental Growth
      • Executive Summary - Data Table on Incremental Growth
      • Executive Summary - Chart on Company Market Positioning

    2 Technavio Analysis

    • 2.1 Analysis of price sensitivity, lifecycle, customer purchase basket, adoption rates, and purchase criteria
      • Analysis of price sensitivity, lifecycle, customer purchase basket, adoption rates, and purchase criteria
    • 2.2 Criticality of inputs and Factors of differentiation
      • Overview on criticality of inputs and factors of differentiation
    • 2.3 Factors of disruption
      • Overview on factors of disruption
    • 2.4 Impact of drivers and challenges
      • Impact of drivers and challenges in 2024 and 2029

    3 Market Landscape

    • 3.1 Market ecosystem
      • Parent Market
      • Data Table on - Parent Market
    • 3.2 Market characteristics
      • Market characteristics analysis
    • 3.3 Value chain analysis
      • Value chain analysis

    4 Market Sizing

    • 4.1 Market definition
      • Offerings of companies included in the market definition
    • 4.2 Market segment analysis
      • Market segments
    • 4.3 Market size 2024
      • 4.4 Market outlook: Forecast for 2024-2029
        • Chart on Global - Market size and forecast 2024-2029 ($ million)
        • Data Table on Global - Market size and forecast 2024-2029 ($ million)
        • Chart on Global Market: Year-over-year growth 2024-2029 (%)
        • Data Table on Global Market: Year-over-year growth 2024-2029 (%)

      5 Historic Market Size

      • 5.1 Global Software-Defined Wide Area Network (SD-WAN) Market 2019 - 2023
        • Historic Market Size - Data Table on Global Software-Defined Wide Area Network (SD-WAN) Market 2019 - 2023 ($ million)
      • 5.2 Product segment analysis 2019 - 2023
        • Historic Market Size - Product Segment 2019 - 2023 ($ million)
      • 5.3 End-user segment analysis 2019 - 2023
        • Historic Market Size - End-user Segment 2019 - 2023 ($ million)
      • 5.4 Deployment segment analysis 2019 - 2023
        • Historic Market Size - Deployment Segment 2019 - 2023 ($ million)
      • 5.5 Geography segment analysis 2019 - 2023
        • Historic Market Size - Geography Segment 2019 - 2023 ($ million)
      • 5.6 Country segment analysis 2019 - 2023
        • Historic Market Size - Country Segment 2019 - 2023 ($ million)

      6 Qualitative Analysis

      • 6.1 The impact of AI in the global software-defined wide area network (SD-WAN) market

        7 Five Forces Analysis

        • 7.1 Five forces summary
          • Five forces analysis - Comparison between 2024 and 2029
        • 7.2 Bargaining power of buyers
          • Bargaining power of buyers - Impact of key factors 2024 and 2029
        • 7.3 Bargaining power of suppliers
          • Bargaining power of suppliers - Impact of key factors in 2024 and 2029
        • 7.4 Threat of new entrants
          • Threat of new entrants - Impact of key factors in 2024 and 2029
        • 7.5 Threat of substitutes
          • Threat of substitutes - Impact of key factors in 2024 and 2029
        • 7.6 Threat of rivalry
          • Threat of rivalry - Impact of key factors in 2024 and 2029
        • 7.7 Market condition
          • Chart on Market condition - Five forces 2024 and 2029

        8 Market Segmentation by Product

        • 8.1 Market segments
          • Chart on Product - Market share 2024-2029 (%)
          • Data Table on Product - Market share 2024-2029 (%)
        • 8.2 Comparison by Product
          • Chart on Comparison by Product
          • Data Table on Comparison by Product
        • 8.3 Solutions - Market size and forecast 2024-2029
          • Chart on Solutions - Market size and forecast 2024-2029 ($ million)
          • Data Table on Solutions - Market size and forecast 2024-2029 ($ million)
          • Chart on Solutions - Year-over-year growth 2024-2029 (%)
          • Data Table on Solutions - Year-over-year growth 2024-2029 (%)
        • 8.4 Services - Market size and forecast 2024-2029
          • Chart on Services - Market size and forecast 2024-2029 ($ million)
          • Data Table on Services - Market size and forecast 2024-2029 ($ million)
          • Chart on Services - Year-over-year growth 2024-2029 (%)
          • Data Table on Services - Year-over-year growth 2024-2029 (%)
        • 8.5 Market opportunity by Product
          • Market opportunity by Product ($ million)
          • Data Table on Market opportunity by Product ($ million)

        9 Market Segmentation by End-user

        • 9.1 Market segments
          • Chart on End-user - Market share 2024-2029 (%)
          • Data Table on End-user - Market share 2024-2029 (%)
        • 9.2 Comparison by End-user
          • Chart on Comparison by End-user
          • Data Table on Comparison by End-user
        • 9.3 Service providers - Market size and forecast 2024-2029
          • Chart on Service providers - Market size and forecast 2024-2029 ($ million)
          • Data Table on Service providers - Market size and forecast 2024-2029 ($ million)
          • Chart on Service providers - Year-over-year growth 2024-2029 (%)
          • Data Table on Service providers - Year-over-year growth 2024-2029 (%)
        • 9.4 Enterprise customers - Market size and forecast 2024-2029
          • Chart on Enterprise customers - Market size and forecast 2024-2029 ($ million)
          • Data Table on Enterprise customers - Market size and forecast 2024-2029 ($ million)
          • Chart on Enterprise customers - Year-over-year growth 2024-2029 (%)
          • Data Table on Enterprise customers - Year-over-year growth 2024-2029 (%)
        • 9.5 Market opportunity by End-user
          • Market opportunity by End-user ($ million)
          • Data Table on Market opportunity by End-user ($ million)

        10 Market Segmentation by Deployment

        • 10.1 Market segments
          • Chart on Deployment - Market share 2024-2029 (%)
          • Data Table on Deployment - Market share 2024-2029 (%)
        • 10.2 Comparison by Deployment
          • Chart on Comparison by Deployment
          • Data Table on Comparison by Deployment
        • 10.3 Cloud-based - Market size and forecast 2024-2029
          • Chart on Cloud-based - Market size and forecast 2024-2029 ($ million)
          • Data Table on Cloud-based - Market size and forecast 2024-2029 ($ million)
          • Chart on Cloud-based - Year-over-year growth 2024-2029 (%)
          • Data Table on Cloud-based - Year-over-year growth 2024-2029 (%)
        • 10.4 On-premises - Market size and forecast 2024-2029
          • Chart on On-premises - Market size and forecast 2024-2029 ($ million)
          • Data Table on On-premises - Market size and forecast 2024-2029 ($ million)
          • Chart on On-premises - Year-over-year growth 2024-2029 (%)
          • Data Table on On-premises - Year-over-year growth 2024-2029 (%)
        • 10.5 Hybrid - Market size and forecast 2024-2029
          • Chart on Hybrid - Market size and forecast 2024-2029 ($ million)
          • Data Table on Hybrid - Market size and forecast 2024-2029 ($ million)
          • Chart on Hybrid - Year-over-year growth 2024-2029 (%)
          • Data Table on Hybrid - Year-over-year growth 2024-2029 (%)
        • 10.6 Market opportunity by Deployment
          • Market opportunity by Deployment ($ million)
          • Data Table on Market opportunity by Deployment ($ million)

        11 Customer Landscape

        • 11.1 Customer landscape overview
          • Analysis of price sensitivity, lifecycle, customer purchase basket, adoption rates, and purchase criteria

        12 Geographic Landscape

        • 12.1 Geographic segmentation
          • Chart on Market share by geography 2024-2029 (%)
          • Data Table on Market share by geography 2024-2029 (%)
        • 12.2 Geographic comparison
          • Chart on Geographic comparison
          • Data Table on Geographic comparison
        • 12.3 North America - Market size and forecast 2024-2029
          • Chart on North America - Market size and forecast 2024-2029 ($ million)
          • Data Table on North America - Market size and forecast 2024-2029 ($ million)
          • Chart on North America - Year-over-year growth 2024-2029 (%)
          • Data Table on North America - Year-over-year growth 2024-2029 (%)
        • 12.4 Europe - Market size and forecast 2024-2029
          • Chart on Europe - Market size and forecast 2024-2029 ($ million)
          • Data Table on Europe - Market size and forecast 2024-2029 ($ million)
          • Chart on Europe - Year-over-year growth 2024-2029 (%)
          • Data Table on Europe - Year-over-year growth 2024-2029 (%)
        • 12.5 APAC - Market size and forecast 2024-2029
          • Chart on APAC - Market size and forecast 2024-2029 ($ million)
          • Data Table on APAC - Market size and forecast 2024-2029 ($ million)
          • Chart on APAC - Year-over-year growth 2024-2029 (%)
          • Data Table on APAC - Year-over-year growth 2024-2029 (%)
        • 12.6 Middle East and Africa - Market size and forecast 2024-2029
          • Chart on Middle East and Africa - Market size and forecast 2024-2029 ($ million)
          • Data Table on Middle East and Africa - Market size and forecast 2024-2029 ($ million)
          • Chart on Middle East and Africa - Year-over-year growth 2024-2029 (%)
          • Data Table on Middle East and Africa - Year-over-year growth 2024-2029 (%)
        • 12.7 South America - Market size and forecast 2024-2029
          • Chart on South America - Market size and forecast 2024-2029 ($ million)
          • Data Table on South America - Market size and forecast 2024-2029 ($ million)
          • Chart on South America - Year-over-year growth 2024-2029 (%)
          • Data Table on South America - Year-over-year growth 2024-2029 (%)
        • 12.8 US - Market size and forecast 2024-2029
          • Chart on US - Market size and forecast 2024-2029 ($ million)
          • Data Table on US - Market size and forecast 2024-2029 ($ million)
          • Chart on US - Year-over-year growth 2024-2029 (%)
          • Data Table on US - Year-over-year growth 2024-2029 (%)
        • 12.9 China - Market size and forecast 2024-2029
          • Chart on China - Market size and forecast 2024-2029 ($ million)
          • Data Table on China - Market size and forecast 2024-2029 ($ million)
          • Chart on China - Year-over-year growth 2024-2029 (%)
          • Data Table on China - Year-over-year growth 2024-2029 (%)
        • 12.10 Canada - Market size and forecast 2024-2029
          • Chart on Canada - Market size and forecast 2024-2029 ($ million)
          • Data Table on Canada - Market size and forecast 2024-2029 ($ million)
          • Chart on Canada - Year-over-year growth 2024-2029 (%)
          • Data Table on Canada - Year-over-year growth 2024-2029 (%)
        • 12.11 Germany - Market size and forecast 2024-2029
          • Chart on Germany - Market size and forecast 2024-2029 ($ million)
          • Data Table on Germany - Market size and forecast 2024-2029 ($ million)
          • Chart on Germany - Year-over-year growth 2024-2029 (%)
          • Data Table on Germany - Year-over-year growth 2024-2029 (%)
        • 12.12 UK - Market size and forecast 2024-2029
          • Chart on UK - Market size and forecast 2024-2029 ($ million)
          • Data Table on UK - Market size and forecast 2024-2029 ($ million)
          • Chart on UK - Year-over-year growth 2024-2029 (%)
          • Data Table on UK - Year-over-year growth 2024-2029 (%)
        • 12.13 Japan - Market size and forecast 2024-2029
          • Chart on Japan - Market size and forecast 2024-2029 ($ million)
          • Data Table on Japan - Market size and forecast 2024-2029 ($ million)
          • Chart on Japan - Year-over-year growth 2024-2029 (%)
          • Data Table on Japan - Year-over-year growth 2024-2029 (%)
        • 12.14 South Korea - Market size and forecast 2024-2029
          • Chart on South Korea - Market size and forecast 2024-2029 ($ million)
          • Data Table on South Korea - Market size and forecast 2024-2029 ($ million)
          • Chart on South Korea - Year-over-year growth 2024-2029 (%)
          • Data Table on South Korea - Year-over-year growth 2024-2029 (%)
        • 12.15 France - Market size and forecast 2024-2029
          • Chart on France - Market size and forecast 2024-2029 ($ million)
          • Data Table on France - Market size and forecast 2024-2029 ($ million)
          • Chart on France - Year-over-year growth 2024-2029 (%)
          • Data Table on France - Year-over-year growth 2024-2029 (%)
        • 12.16 India - Market size and forecast 2024-2029
          • Chart on India - Market size and forecast 2024-2029 ($ million)
          • Data Table on India - Market size and forecast 2024-2029 ($ million)
          • Chart on India - Year-over-year growth 2024-2029 (%)
          • Data Table on India - Year-over-year growth 2024-2029 (%)
        • 12.17 Italy - Market size and forecast 2024-2029
          • Chart on Italy - Market size and forecast 2024-2029 ($ million)
          • Data Table on Italy - Market size and forecast 2024-2029 ($ million)
          • Chart on Italy - Year-over-year growth 2024-2029 (%)
          • Data Table on Italy - Year-over-year growth 2024-2029 (%)
        • 12.18 Market opportunity by geography
          • Market opportunity by geography ($ million)
          • Data Tables on Market opportunity by geography ($ million)

        13 Drivers, Challenges, and Opportunity/Restraints

        • 13.1 Market drivers
          • 13.2 Market challenges
            • 13.3 Impact of drivers and challenges
              • Impact of drivers and challenges in 2024 and 2029
            • 13.4 Market opportunities/restraints

              14 Competitive Landscape

              • 14.1 Overview
                • 14.2 Competitive Landscape
                  • Overview on criticality of inputs and factors of differentiation
                • 14.3 Landscape disruption
                  • Overview on factors of disruption
                • 14.4 Industry risks
                  • Impact of key risks on business

                15 Competitive Analysis

                • 15.1 Companies profiled
                  • Companies covered
                • 15.2 Company ranking index
                  • Company ranking index
                • 15.3 Market positioning of companies
                  • Matrix on companies position and classification
                • 15.4 Arista Networks Inc.
                  • Arista Networks Inc. - Overview
                  • Arista Networks Inc. - Product / Service
                  • Arista Networks Inc. - Key offerings
                  • SWOT
                • 15.5 Aryaka Networks Inc.
                  • Aryaka Networks Inc. - Overview
                  • Aryaka Networks Inc. - Product / Service
                  • Aryaka Networks Inc. - Key offerings
                  • SWOT
                • 15.6 Bigleaf Networks Inc.
                  • Bigleaf Networks Inc. - Overview
                  • Bigleaf Networks Inc. - Product / Service
                  • Bigleaf Networks Inc. - Key offerings
                  • SWOT
                • 15.7 Cato Networks Ltd.
                  • Cato Networks Ltd. - Overview
                  • Cato Networks Ltd. - Product / Service
                  • Cato Networks Ltd. - Key offerings
                  • SWOT
                • 15.8 Cisco Systems Inc.
                  • Cisco Systems Inc. - Overview
                  • Cisco Systems Inc. - Business segments
                  • Cisco Systems Inc. - Key news
                  • Cisco Systems Inc. - Key offerings
                  • Cisco Systems Inc. - Segment focus
                  • SWOT
                • 15.9 Citrix Systems Inc.
                  • Citrix Systems Inc. - Overview
                  • Citrix Systems Inc. - Product / Service
                  • Citrix Systems Inc. - Key news
                  • Citrix Systems Inc. - Key offerings
                  • SWOT
                • 15.10 FatPipe Networks Inc.
                  • FatPipe Networks Inc. - Overview
                  • FatPipe Networks Inc. - Product / Service
                  • FatPipe Networks Inc. - Key offerings
                  • SWOT
                • 15.11 Forcepoint LLC
                  • Forcepoint LLC - Overview
                  • Forcepoint LLC - Product / Service
                  • Forcepoint LLC - Key offerings
                  • SWOT
                • 15.12 Fortinet Inc.
                  • Fortinet Inc. - Overview
                  • Fortinet Inc. - Product / Service
                  • Fortinet Inc. - Key news
                  • Fortinet Inc. - Key offerings
                  • SWOT
                • 15.13 Huawei Technologies Co. Ltd.
                  • Huawei Technologies Co. Ltd. - Overview
                  • Huawei Technologies Co. Ltd. - Product / Service
                  • Huawei Technologies Co. Ltd. - Key news
                  • Huawei Technologies Co. Ltd. - Key offerings
                  • SWOT
                • 15.14 Juniper Networks Inc.
                  • Juniper Networks Inc. - Overview
                  • Juniper Networks Inc. - Product / Service
                  • Juniper Networks Inc. - Key news
                  • Juniper Networks Inc. - Key offerings
                  • SWOT
                • 15.15 Nokia Corp.
                  • Nokia Corp. - Overview
                  • Nokia Corp. - Business segments
                  • Nokia Corp. - Key news
                  • Nokia Corp. - Key offerings
                  • Nokia Corp. - Segment focus
                  • SWOT
                • 15.16 Oracle Corp.
                  • Oracle Corp. - Overview
                  • Oracle Corp. - Business segments
                  • Oracle Corp. - Key news
                  • Oracle Corp. - Key offerings
                  • Oracle Corp. - Segment focus
                  • SWOT
                • 15.17 Palo Alto Networks Inc.
                  • Palo Alto Networks Inc. - Overview
                  • Palo Alto Networks Inc. - Product / Service
                  • Palo Alto Networks Inc. - Key news
                  • Palo Alto Networks Inc. - Key offerings
                  • SWOT
                • 15.18 Riverbed Technology Inc.
                  • Riverbed Technology Inc. - Overview
                  • Riverbed Technology Inc. - Product / Service
                  • Riverbed Technology Inc. - Key offerings
                  • SWOT

                16 Appendix

                • 16.1 Scope of the report
                  • 16.2 Inclusions and exclusions checklist
                    • Inclusions checklist
                    • Exclusions checklist
                  • 16.3 Currency conversion rates for US$
                    • Currency conversion rates for US$
                  • 16.4 Research methodology
                    • Research methodology
                  • 16.5 Data procurement
                    • Information sources
                  • 16.6 Data validation
                    • Data validation
                  • 16.7 Validation techniques employed for market sizing
                    • Validation techniques employed for market sizing
                  • 16.8 Data synthesis
                    • Data synthesis
                  • 16.9 360 degree market analysis
                    • 360 degree market analysis
                  • 16.10 List of abbreviations
                    • List of abbreviations

                  Research Methodology

                  Technavio presents a detailed picture of the market by way of study, synthesis, and summation of data from multiple sources. The analysts have presented the various facets of the market with a particular focus on identifying the key industry influencers. The data thus presented is comprehensive, reliable, and the result of extensive research, both primary and secondary.

                  INFORMATION SOURCES

                  Primary sources

                  • Manufacturers and suppliers
                  • Channel partners
                  • Industry experts
                  • Strategic decision makers

                  Secondary sources

                  • Industry journals and periodicals
                  • Government data
                  • Financial reports of key industry players
                  • Historical data
                  • Press releases

                  DATA ANALYSIS

                  Data Synthesis

                  • Collation of data
                  • Estimation of key figures
                  • Analysis of derived insights

                  Data Validation

                  • Triangulation with data models
                  • Reference against proprietary databases
                  • Corroboration with industry experts

                  REPORT WRITING

                  Qualitative

                  • Market drivers
                  • Market challenges
                  • Market trends
                  • Five forces analysis

                  Quantitative

                  • Market size and forecast
                  • Market segmentation
                  • Geographical insights
                  • Competitive landscape

                  Interested in this report?

                  Get your sample now to see our research methodology and insights!

                  Download Now

                  Frequently Asked Questions

                  Software-Defined Wide Area Network (Sd-Wan) market growth will increase by $ 13552.7 mn during 2025-2029 .

                  The Software-Defined Wide Area Network (Sd-Wan) market is expected to grow at a CAGR of 24% during 2025-2029 .

                  Software-Defined Wide Area Network (Sd-Wan) market is segmented by Product( Solutions, Services) End-user( Service providers, Enterprise customers, Europe, South America, Middle East and Africa) Deployment( Cloud-based, On-premises, Hybrid, South America, Middle East and Africa)

                  Arista Networks Inc., Aryaka Networks Inc., Bigleaf Networks Inc., Cato Networks Ltd., Cisco Systems Inc., Citrix Systems Inc., FatPipe Networks Inc., flexiWAN Ltd., Forcepoint LLC, Fortinet Inc., Hewlett Packard Enterprise Co., Huawei Technologies Co. Ltd., Juniper Networks Inc., Lumen Technologies Inc., Nokia Corp., Oracle Corp., Palo Alto Networks Inc., Riverbed Technology Inc., Versa Networks Inc., VMware Inc. are a few of the key vendors in the Software-Defined Wide Area Network (Sd-Wan) market.

                  North America will register the highest growth rate of 37% among the other regions. Therefore, the Software-Defined Wide Area Network (Sd-Wan) market in North America is expected to garner significant business opportunities for the vendors during the forecast period.

                  US, China, Germany, Canada, UK, Japan, South Korea, France, India, Italy

                  • Rising demand for cloud solutionsThe demand for cloud solutions has grown significantly over the past few years. A major portion of this demand is generated by enterprises and service providers that are looking to shift their on-premises data center workloads to the cloud to improve their scalability is the driving factor this market.
                  • efficiency is the driving factor this market.
                  • and agility and reduce CAPEX and OPEX. However is the driving factor this market.
                  • the inadequate WAN capacity of such enterprises does not support such transition and results in network reliability issues is the driving factor this market.
                  • latency issues is the driving factor this market.
                  • and network congestion. As cloud-based SD-WAN overcomes such challenges is the driving factor this market.
                  • its demand is expected to increase during the forecast period with the rise in the adoption of cloud solutions. Enterprises across various industry sectors is the driving factor this market.
                  • such as banking is the driving factor this market.
                  • financial services is the driving factor this market.
                  • and insurance (BFSI) is the driving factor this market.
                  • content and digital media is the driving factor this market.
                  • retail is the driving factor this market.
                  • and manufacturing is the driving factor this market.
                  • are implementing SD-WAN solutions to overcome network-related challenges. Therefore is the driving factor this market.
                  • enterprises are increasingly adopting cloud-based SD-WAN solutions to overcome the challenges posed by traditional WAN. This trend is expected to continue during the forecast period with the rise in the adoption of cloud solutions by enterprises. Thus is the driving factor this market.
                  • the global software-defined wide area network (SD-WAN) market is expected to grow significantly during the forecast period. is the driving factor this market.

                  The Software-Defined Wide Area Network (Sd-Wan) market vendors should focus on grabbing business opportunities from the Solutions segment as it accounted for the largest market share in the base year.