
Solketal Market Size 2024-2028
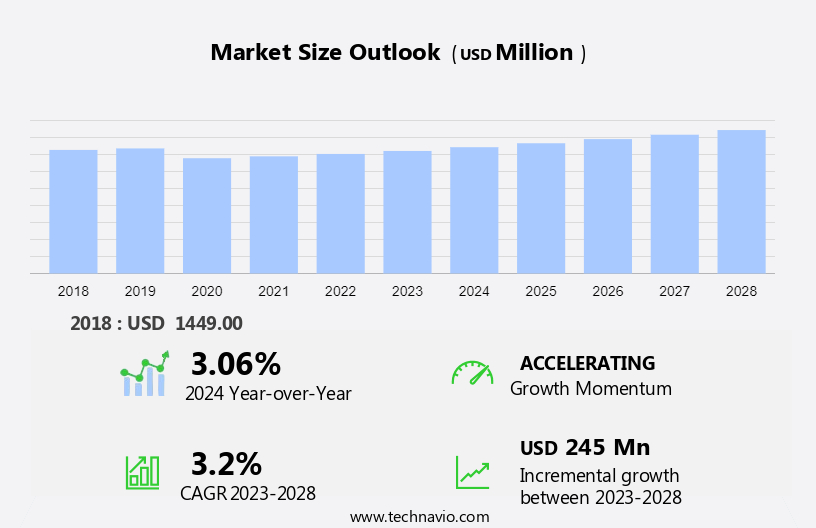
The solketal market size is forecast to increase by USD 245 million at a CAGR of 3.2% between 2023 and 2028. The market is experiencing significant growth due to increasing regulations on biofuels and the resulting demand for biodiesel production. Solketal, a key ingredient in the production of biodiesel, is in high demand due to its oxygen constancy and compatibility with various gum configurations. The market is also driven by advancements in solketal production technology, making processes more energy-efficient and cost-effective. However, the high production cost of solketal remains a challenge for market growth. Key trends include the use of solketal in petrochemical processes and the development of new applications in the production of acetone. To stay competitive, companies must focus on improving production methods and ensuring the highest purity levels in their solketal offerings.
What will the Size of the Solketal Market be during the Forecast Period?
Isopropylidene glycerin, a glycerin derivative, is gaining significant attention in various industries due to its unique properties and eco-friendly nature. This organic compound is an essential additive in the production of biodiesel and serves as a valuable chemical intermediate in organic synthesis. In the realm of biofuels, isopropylidene glycerin functions as a green industrial solvent. A pesticide intermediate is a chemical compound that is produced during the manufacturing process of pesticides and serves as a precursor to the final active ingredient. Its application in biodiesel production enhances flow properties, leading to improved fuel quality. In the agriculture sector, vertical integration in supply chain management allows for more efficient glycerol refining and the production of pesticide intermediates, while the adoption of renewable chemical technologies and carbon pricing helps drive sustainability in personal products manufacturing. Furthermore, it contributes to reducing particulate matter emissions, aligning with stringent biofuels regulations. Isopropylidene glycerin's role extends beyond biofuels, as it is an integral component in the production of various bio-based industries.
Furthermore, it is used in the manufacturing of bioplastics and bio-based chemicals, contributing to the sustainability movement by reducing reliance on fossil fuels. The chemical intermediate is also employed as a fuel additive in gasoline, enhancing octane number and improving combustion efficiency. In the context of green chemistry, isopropylidene glycerin is an eco-friendly solvent, making it an attractive alternative to traditional, less sustainable solvents. In the personal care industry, isopropylidene glycerin finds applications in skincare and haircare products due to its hydrating properties. In addition, it is used in technology advancements such as drug delivery systems and personalized medicine, highlighting its versatility and importance in various sectors.
Market Segmentation
The market research report provides comprehensive data (region-wise segment analysis), with forecasts and estimates in "USD million" for the period 2024-2028, as well as historical data from 2018-2022 for the following segments.
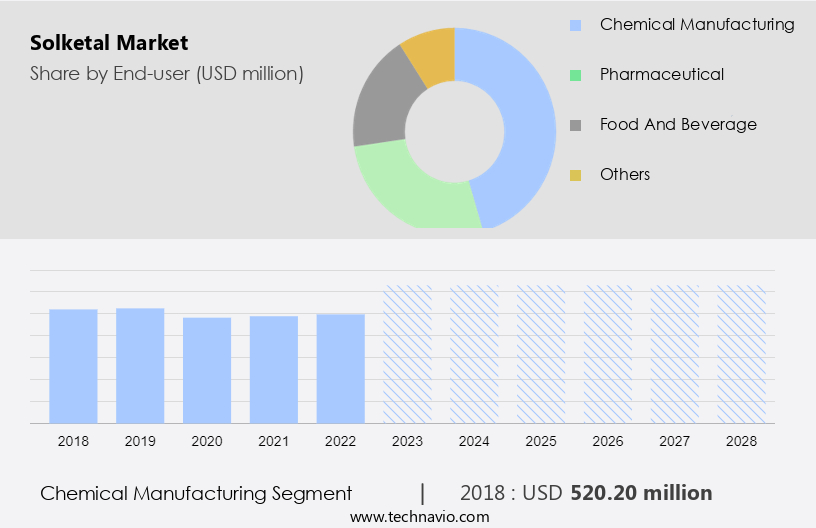
- End-user
- Chemical manufacturing
- Pharmaceutical
- Food and beverage
- Others
- Type
- 96-98 percent
- 98 percent
- Greater than 98 percent
- Geography
- North America
- Canada
- US
- Europe
- Germany
- UK
- APAC
- China
- South America
- Middle East and Africa
- North America
By End-user Insights
The chemical manufacturing segment is estimated to witness significant growth during the forecast period. Solketal, a versatile chemical compound, plays a significant role in various applications within the chemical manufacturing industry. This bio-based chemical is derived from renewable resources and is gaining popularity in the context of sustainability and reducing reliance on fossil fuels. In the realm of cosmetics, solketal is employed as a solvent and reagent due to its unique chemical properties. As a solvent, solketal is effective for both polar and non-polar compounds, making it a valuable asset in the production of polymers, resins, coatings, and pharmaceuticals. Its ability to dissolve a wide range of substances makes it an indispensable tool in the chemical industry.
Furthermore, solketal's usage extends to the production of bio-based industries, such as bioplastics and bio-based chemicals. In the production of bioplastics, solketal acts as a solvent, enhancing the process's efficiency and reducing waste. Additionally, in the realm of bio-based chemicals, solketal is utilized as a reagent in organic reactions, including acetalization and ketalization, to generate other organic compounds. The adoption of solketal in these industries not only contributes to the advancement of sustainable practices but also bolsters the growth of the bio-based chemicals and bioplastics market.
Get a glance at the market share of various segments Request Free Sample
The Chemical manufacturing segment was valued at USD 520.20 million in 2018 and showed a gradual increase during the forecast period.
Regional Insights
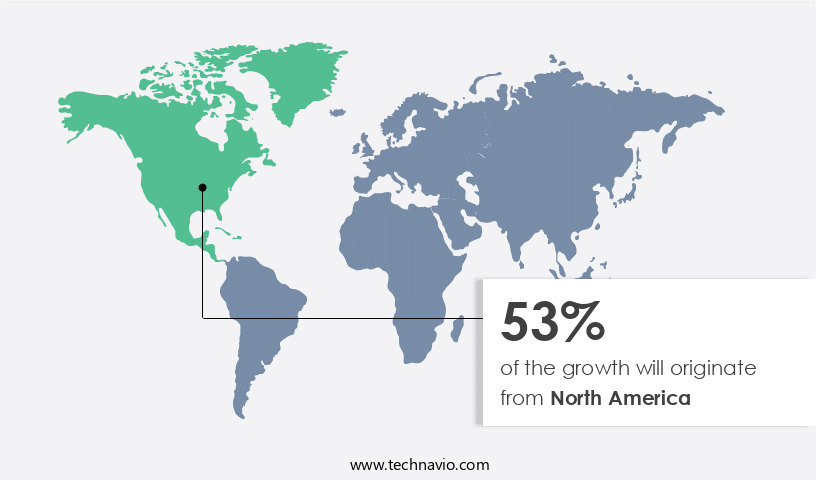
North America is estimated to contribute 53% to the growth of the global market during the forecast period. Technavio's analysts have elaborately explained the regional trends and drivers that shape the market during the forecast period.
For more insights on the market share of various regions Request Free Sample
In North America, the market experiences significant growth due to its extensive application in the pharmaceutical and personal care industries. The United States, specifically, represents the largest market share within the region. The presence of numerous leading pharmaceutical companies in the country, which are significant consumers of solketal, contributes to its demand. Moreover, the increasing preference for bio-based solvents and the growing emphasis on sustainability and environmental regulations further fuel the market's expansion. The Food and Drug Administration (FDA) guidelines ensure high-quality standards for solketal used in pharmaceutical applications, adding to its appeal. The market in North America is poised for substantial growth during the forecast period.
Our researchers analyzed the data with 2023 as the base year, along with the key drivers, trends, and challenges. A holistic analysis of drivers will help companies refine their marketing strategies to gain a competitive advantage.
Market Driver
Growing use of solketal in production of biodiesel is the key driver of the market. Glycerol, a by-product of biodiesel production, accounts for approximately 10% of the total volume produced in a single batch. One potential application for this abundant by-product is the synthesis of Isopropylidene glycerin, also known as solketal. Solketal is a valuable chemical used as a fuel additive in biodiesel to improve its properties, specifically by reducing viscosity and enhancing stability. The production of solketal involves the reaction of glycerol with acetone in the presence of an acid catalyst. This approach allows for the simultaneous conversion of triglycerides to biodiesel and the glycerol by-product to solketal, increasing the overall efficiency of the process.
Furthermore, solketal is a versatile chemical with various applications beyond biodiesel. It is used in organic synthesis as a green industrial solvent and in the production of biofuels. The growing demand for sustainable and eco-friendly chemicals is expected to drive the growth of the market.
Market Trends
Growing technological advancements in solketal production is the upcoming trend in the market. In the realm of biofuels, solketal production has witnessed significant technological advancements, enhancing both efficiency and sustainability. One such innovation is the enzymatic production process, which employs enzymes to catalyze the reaction between glycerol and acetone. This method offers superior yields and purity compared to traditional chemical methods, thereby minimizing the reliance on harsh chemicals and high temperatures.
Furthermore, another breakthrough is the implementation of continuous flow production techniques. These methods streamline the production process, increasing efficiency and reducing production time, in contrast to the batch methods of the past. The adoption of energy-efficient technology in solketal production aligns with the broader trend towards sustainable petrochemical processes.
Market Challenge
High production cost of solketal is a key challenge affecting the market growth. Solketal, a fuel additive, is derived from glycerol, a by-product of biodiesel production. The cost of solketal production can be higher than other chemicals due to the cost and availability of glycerol, the complexity of the production process, and the requirement for specialized equipment. The production process involves several steps, including esterification, acetalization, and purification, with the use of a strong acid catalyst.
Furthermore, the catalyst must be carefully removed to ensure product purity. The starting material, glycerol, can impact the cost of solketal production due to its variable availability and cost. Solketal is used as a fuel additive to reduce particulate matter emissions and improve flow properties in gasoline. It also enhances the octane number of the fuel. As a chemical intermediate, solketal is essential in various industries, including pharmaceuticals and polymers.
Exclusive Customer Landscape
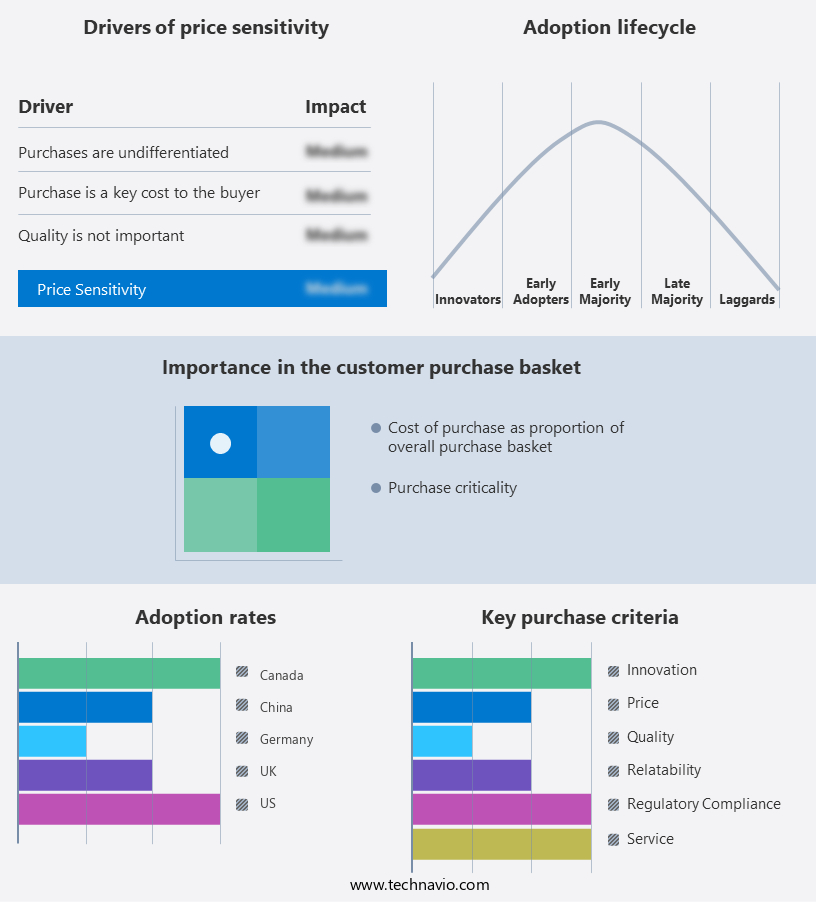
The market forecasting report includes the adoption lifecycle of the market, covering from the innovator's stage to the laggard's stage. It focuses on adoption rates in different regions based on penetration. Furthermore, the report also includes key purchase criteria and drivers of price sensitivity to help companies evaluate and develop their market growth analysis strategies.
Customer Landscape
Key Companies & Market Insights
Companies are implementing various strategies, such as strategic alliances, partnerships, mergers and acquisitions, geographical expansion, and product/service launches, to enhance their presence in the market.
Alfa Chemistry: The company offers 3-(3-AMINOPROPYL) SOLKETAL. Also, they focus on offering building blocks, reagents, catalysts, reference materials, and research chemicals.
The market research and growth report includes detailed analyses of the competitive landscape of the market and information about key companies, including:
- alteqo bv
- CM Fine Chemicals GmbH
- CP Lab Safety
- CPS Performance Materials Corp.
- Hangzhou Dayangchem Co. Ltd.
- GLACONCHEMIE GmbH
- Glentham Life Sciences Ltd.
- Haihang Industry Co. Ltd.
- HENAN BON INDUSTRIAL CHEMICAL CO. LTD.
- IMPAG AG
- LOBA Feinchemie GmbH
- Merck KGaA
- Molekula Ltd.
- Solvay SA
- Thermo Fisher Scientific Inc.
- Tocopharm Co. Ltd.
- Tokyo Chemical Industry Co. Ltd.
Qualitative and quantitative analysis of companies has been conducted to help clients understand the wider business environment as well as the strengths and weaknesses of key market players. Data is qualitatively analyzed to categorize companies as pure play, category-focused, industry-focused, and diversified; it is quantitatively analyzed to categorize companies as dominant, leading, strong, tentative, and weak.
Research Analyst Overview
Isopropylidene glycerin, a glycerin derivative, is gaining significant attention in various industries as an additive for biodiesel production and as a green industrial solvent. This organic compound is produced through the process of organic synthesis and is widely used in the biofuels sector due to its ability to improve flow properties and octane number. Isopropylidene glycerin is a valuable chemical intermediate in the production of biofuels, particularly biodiesel. It plays a crucial role in reducing particulate matter emissions and enhancing oxygen constancy, which are essential factors in ensuring the gum configuration of the final fuel product. Beyond its application in biofuels, isopropylidene glycerin is also used as a fuel additive in gasoline engines.
Furthermore, its eco-friendly nature makes it an attractive alternative to traditional fossil fuel-based solvents and additives. Isopropylidene glycerin is also used in various industries, including cosmetics, personal care, pharmaceuticals, and bio-based chemicals. Its high purity and compatibility with various processes make it an ideal choice for these applications. The production capacities of isopropylidene glycerin are expanding in response to increasing demand from various sectors. This trend is driven by the growing focus on sustainability and the need to reduce reliance on fossil fuels. Isopropylidene glycerin is also used as a raw material in the production of bioplastics and other green building materials.
|
Market Scope |
|
|
Report Coverage |
Details |
|
Page number |
181 |
|
Base year |
2023 |
|
Historic period |
2018-2022 |
|
Forecast period |
2024-2028 |
|
Growth momentum & CAGR |
Accelerate at a CAGR of 3.2% |
|
Market growth 2024-2028 |
USD 245 million |
|
Market structure |
Fragmented |
|
YoY growth 2023-2024(%) |
3.06 |
|
Regional analysis |
North America, Europe, APAC, South America, and Middle East and Africa |
|
Performing market contribution |
North America at 53% |
|
Key countries |
US, China, Germany, Canada, and UK |
|
Competitive landscape |
Leading Companies, Market Positioning of Companies, Competitive Strategies, and Industry Risks |
|
Key companies profiled |
Alfa Chemistry, alteqo bv, CM Fine Chemicals GmbH, CP Lab Safety, CPS Performance Materials Corp., Hangzhou Dayangchem Co. Ltd., GLACONCHEMIE GmbH, Glentham Life Sciences Ltd., Haihang Industry Co. Ltd., HENAN BON INDUSTRIAL CHEMICAL CO. LTD., IMPAG AG, LOBA Feinchemie GmbH, Merck KGaA, Molekula Ltd., Solvay SA, Thermo Fisher Scientific Inc., Tocopharm Co. Ltd., and Tokyo Chemical Industry Co. Ltd. |
|
Market dynamics |
Parent market analysis, market growth inducers and obstacles, market forecast, fast-growing and slow-growing segment analysis, COVID-19 impact and recovery analysis and future consumer dynamics, market condition analysis for the forecast period |
|
Customization purview |
If our market report has not included the data that you are looking for, you can reach out to our analysts and get segments customized. |
What are the Key Data Covered in this Market Research and Growth Report?
- CAGR of the market during the forecast period
- Detailed information on factors that will drive the market growth and forecasting between 2024 and 2028
- Precise estimation of the size of the market and its contribution of the market in focus to the parent market
- Accurate predictions about upcoming market growth and trends and changes in consumer behaviour
- Growth of the market across North America, Europe, APAC, South America, and Middle East and Africa
- Thorough analysis of the market's competitive landscape and detailed information about companies
- Comprehensive analysis of factors that will challenge the growth of market companies
We can help! Our analysts can customize this market research report to meet your requirements. Get in touch
 RIA -
RIA - 
