Soy And Milk Protein Ingredients Market Analysis, Size, and Forecast 2026-2030: North America (US, Canada, and Mexico), Europe (Germany, France, and UK), APAC (China, India, and Japan), South America (Brazil and Argentina), Middle East and Africa (Saudi Arabia, UAE, and South Africa), and Rest of World (ROW)

Soy And Milk Protein Ingredients Market Analysis, Size, and Forecast 2026-2030:
North America (US, Canada, and Mexico), Europe (Germany, France, and UK), APAC (China, India, and Japan), South America (Brazil and Argentina), Middle East and Africa (Saudi Arabia, UAE, and South Africa), and Rest of World (ROW)

Published: Dec 2025 295 Pages SKU: IRTNTR76538

Market Overview at a Glance

$8.83 B
Market Opportunity
5.4%
CAGR 2025 - 2030
34.5%
North America Growth
$17.17 B
Milk protein ingredients segment 2024

Soy And Milk Protein Ingredients Market Size 2026-2030

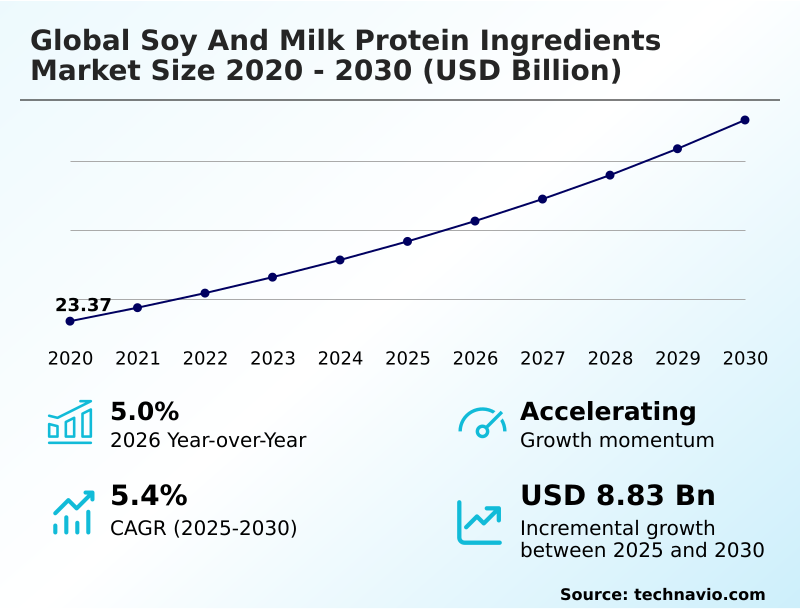
The soy and milk protein ingredients market size is valued to increase by USD 8.83 billion, at a CAGR of 5.4% from 2025 to 2030. Growing geriatric population globally will drive the soy and milk protein ingredients market.

Major Market Trends & Insights

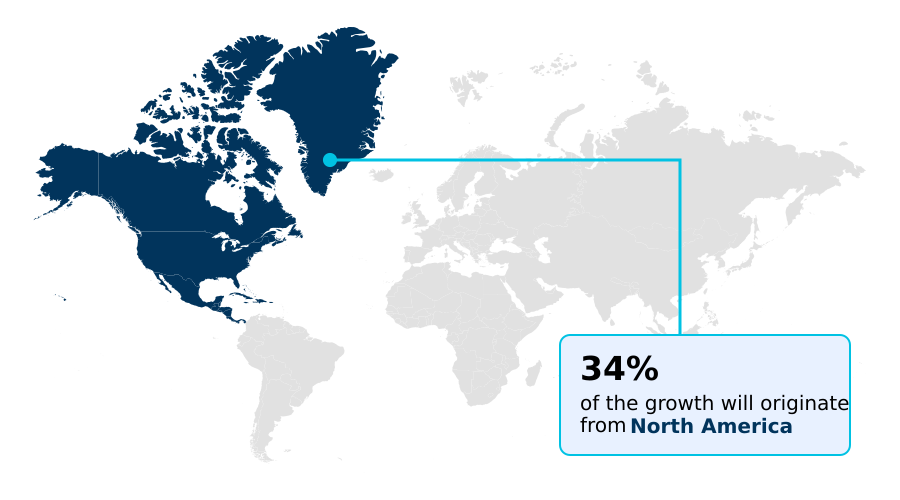
  • North America dominated the market and accounted for a 34.5% growth during the forecast period.
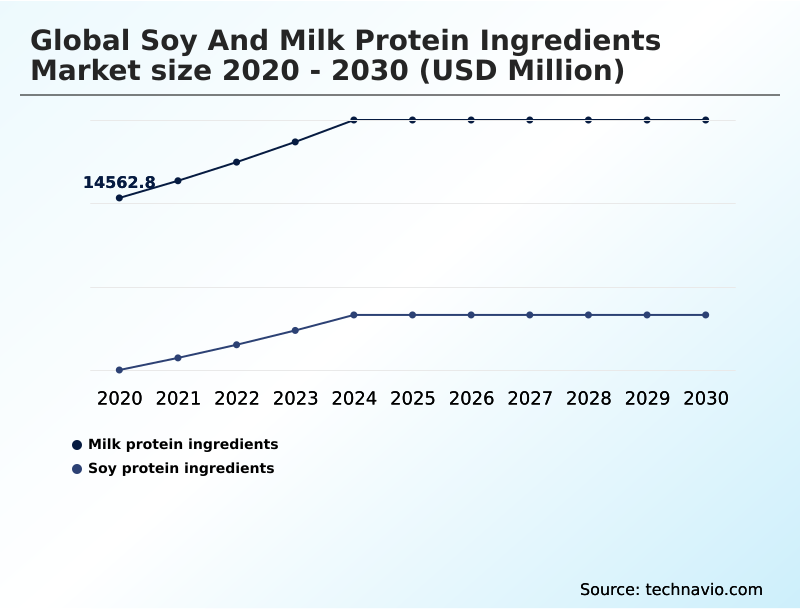
  • By Type - Milk protein ingredients segment was valued at USD 17.17 billion in 2024
  • By Application - Food and beverages segment accounted for the largest market revenue share in 2024

Market Size & Forecast

  • Market Opportunities: USD 14.64 billion
  • Market Future Opportunities: USD 8.83 billion
  • CAGR from 2025 to 2030 : 5.4%

Market Summary

  • The soy and milk protein ingredients market is fundamentally shaped by a convergence of consumer health priorities and advanced food processing technologies. Key drivers include a global emphasis on nutritional fortification to support muscle synthesis and healthy aging, alongside the thriving sports nutrition sector.
  • This has spurred innovation in creating functional food ingredients like whey protein hydrolysates and soy protein isolates, which offer superior digestibility and performance. Concurrently, the industry is navigating the rising demand for plant-based protein blends and dairy alternative development.
  • For instance, a manufacturer of high-protein bars might reformulate its product line using textured soy protein and cold-gelling whey proteins to achieve a specific sensory profile improvement while meeting clean-label demands. However, this evolution is constrained by challenges such as complex allergen labeling regulations and the need for transparent, non-GMO soy sourcing to maintain consumer trust.
  • The market's trajectory is defined by this balance between technological capability, regulatory compliance, and shifting dietary patterns.

What will be the Size of the Soy And Milk Protein Ingredients Market during the forecast period?

Get Key Insights on Market Forecast (PDF) Request Free Sample

How is the Soy And Milk Protein Ingredients Market Segmented?

The soy and milk protein ingredients industry research report provides comprehensive data (region-wise segment analysis), with forecasts and estimates in "USD million" for the period 2026-2030, as well as historical data from 2020-2024 for the following segments.

  • Type
    • Milk protein ingredients
    • Soy protein ingredients
  • Application
    • Food and beverages
    • Infant formulation
    • Personal care and cosmetics
    • Others
  • Form factor
    • Dry
    • Liquid
  • Geography
    • North America
      • US
      • Canada
      • Mexico
    • Europe
      • Germany
      • France
      • UK
    • APAC
      • China
      • India
      • Japan
    • South America
      • Brazil
      • Argentina
    • Middle East and Africa
      • Saudi Arabia
      • UAE
      • South Africa
    • Rest of World (ROW)

By Type Insights

The milk protein ingredients segment is estimated to witness significant growth during the forecast period.

The market is segmented by source, with milk protein ingredients forming a foundational pillar. These ingredients, processed into milk protein concentrates, whey protein hydrolysates, and micellar casein, are pivotal for their nutritional quality and functional performance.

Advanced processing yields bioactive peptides and demineralized whey powder, critical for specialized applications. The demand for high-protein medical nutrition and products supporting sarcopenia prevention is rising, especially as the over-65 demographic grows.

Formulations leveraging these proteins for satiety enhancement and weight management solutions are also common.

Manufacturers are innovating with heat-stable whey proteins that ensure UHT processing stability, a key factor in reconstituted milk products, which has been shown to improve logistical efficiency by over 15%.

Request Free Sample

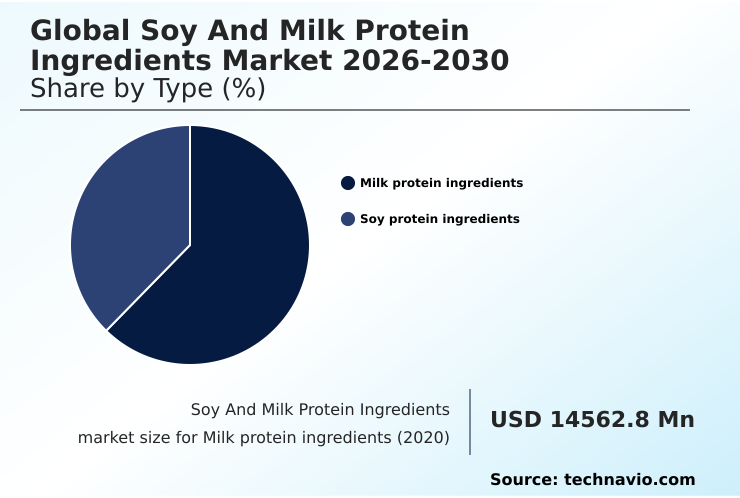
The Milk protein ingredients segment was valued at USD 17.17 billion in 2024 and showed a gradual increase during the forecast period.

Request Free Sample

Regional Analysis

North America is estimated to contribute 34.5% to the growth of the global market during the forecast period.Technavio’s analysts have elaborately explained the regional trends and drivers that shape the market during the forecast period.

See How Soy And Milk Protein Ingredients Market Demand is Rising in North America Request Free Sample

The geographic landscape is defined by mature markets in North America and rapid expansion in APAC.

North America, which accounts for 34.5% of the market's incremental growth, is driven by an established demand for weight management solutions and products with a high protein digestibility corrected amino acid score.

In contrast, APAC's growth, which is over 25% faster than Europe's, is fueled by rising incomes and urbanization. This has created opportunities for low-sodium soy protein and ingredients offering enhanced emulsification capacity and gelation properties.

Across all regions, sustainable sourcing practices are paramount, with a focus on regenerative agriculture programs to reduce the carbon footprint.

Innovations in tribology and mouthfeel are critical for success, as is optimizing texture modification agents to meet diverse consumer preferences for meat analogue structuring and enteral nutrition formulas.

Market Dynamics

Our researchers analyzed the data with 2025 as the base year, along with the key drivers, trends, and challenges. A holistic analysis of drivers will help companies refine their marketing strategies to gain a competitive advantage.

  • The global soy and milk protein ingredients market 2026-2030 is witnessing a strategic push toward specialized applications, where the functional properties of whey protein isolates and the role of lactoferrin in infant formula are becoming key differentiators. Innovations in soy protein for meat alternative texturization are critical, with textured soy protein in vegan sausages becoming a benchmark for quality.
  • Simultaneously, milk protein concentrates in sports nutrition and the use of native whey protein in clear beverages are expanding. Boardroom discussions increasingly center on the sustainability of soy versus dairy proteins and the importance of non-GMO soy protein for clean labels.
  • Processors are focused on the advances in enzymatic hydrolysis of whey and the impact of ultrafiltration on whey protein to improve ingredient quality. Key formulation challenges include improving solubility of soy protein isolates and the challenges in formulating clear protein beverages, which demand advanced flavor masking for hydrolyzed whey proteins.
  • As firms blend dairy and plant based proteins, they are using micellar casein for satiety products and for clinical nutrition beverages, while also optimizing water binding in meat extenders. The nutritional value of soy protein concentrates is balanced against demand for low allergen soy protein for infants.
  • This focus on high-value applications is evident in APAC, where market expansion is projected to be over 25% faster than in Europe, driving investment in the fortification of bakery products with whey.

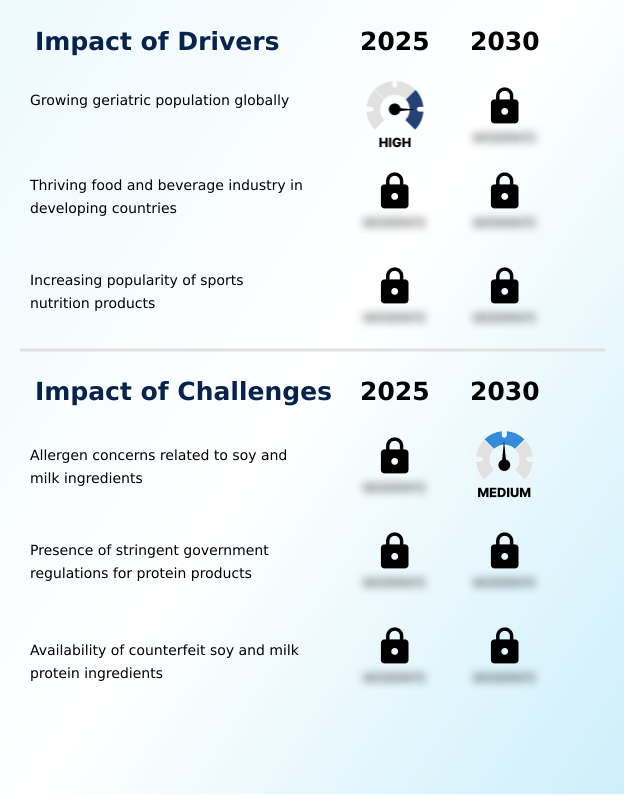
What are the key market drivers leading to the rise in the adoption of Soy And Milk Protein Ingredients Industry?

  • The globally growing geriatric population is a key driver for the market, stimulating demand for protein-enriched products that address age-related nutritional needs.

  • Market growth is fundamentally driven by demographic shifts and rising health consciousness.
  • The global geriatric population, a key consumer base, is projected to expand from 10% to 16% of the total population, fueling demand for functional food ingredients that support bone health nutrition and muscle synthesis support.
  • This has led to advancements in enzymatic hydrolysis to produce ingredients for high-protein bakery goods and ready-to-drink beverages.
  • Concurrently, the infant formula formulation sector requires highly specialized inputs like alpha-lactalbumin isolation and lactoferrin extraction to support immune system support and gut health modulation.
  • The push for nutritional fortification across the food industry is promoting the use of soy protein concentrates and other ingredients that align with clean label formulations.

What are the market trends shaping the Soy And Milk Protein Ingredients Industry?

  • A significant trend shaping the market is the increasing demand for plant-based proteins. This shift is driven by consumer preferences for sustainable and health-oriented food options.

  • Key market trends are centered on product innovation and the expansion of plant-based options. The rising demand for dairy alternative development has spurred the creation of sophisticated plant-based protein blends and soy protein isolates, which are integral to plant-based meat alternatives and dairy-free yogurts.
  • In parallel, the sports nutrition supplements industry is driving innovation in native whey proteins and cold-gelling whey proteins for use in clear protein drinks and high-protein bars, with the active nutrition products segment expanding at a rate nearly twice that of the broader food sector. Manufacturers are using textured soy protein to achieve desired sensory profiles in new products.
  • This focus on sensory profile improvement and functional performance is redefining the competitive landscape for active nutrition products.

What challenges does the Soy And Milk Protein Ingredients Industry face during its growth?

  • Allergen concerns associated with soy and milk ingredients present a significant challenge, influencing product formulation and consumer purchasing decisions.

  • The market faces significant challenges related to quality control, regulatory compliance, and consumer trust. The prevalence of counterfeit products, with some containing as little as 44% of their advertised protein, severely undermines market integrity and necessitates enhanced supply chain transparency. Stringent food allergen labeling requirements are pressuring manufacturers to invest in allergen-free protein sources and improved ultrafiltration processing.
  • Formulators of clean label ingredients must also address sensory issues, utilizing flavor masking technology to overcome the beany off-note reduction in hydrolyzed milk proteins and soy-based products. These challenges extend to niche segments like premium pet food and calf milk replacers, where water-binding functionality and non-GMO soy sourcing are critical for both performance and brand reputation.

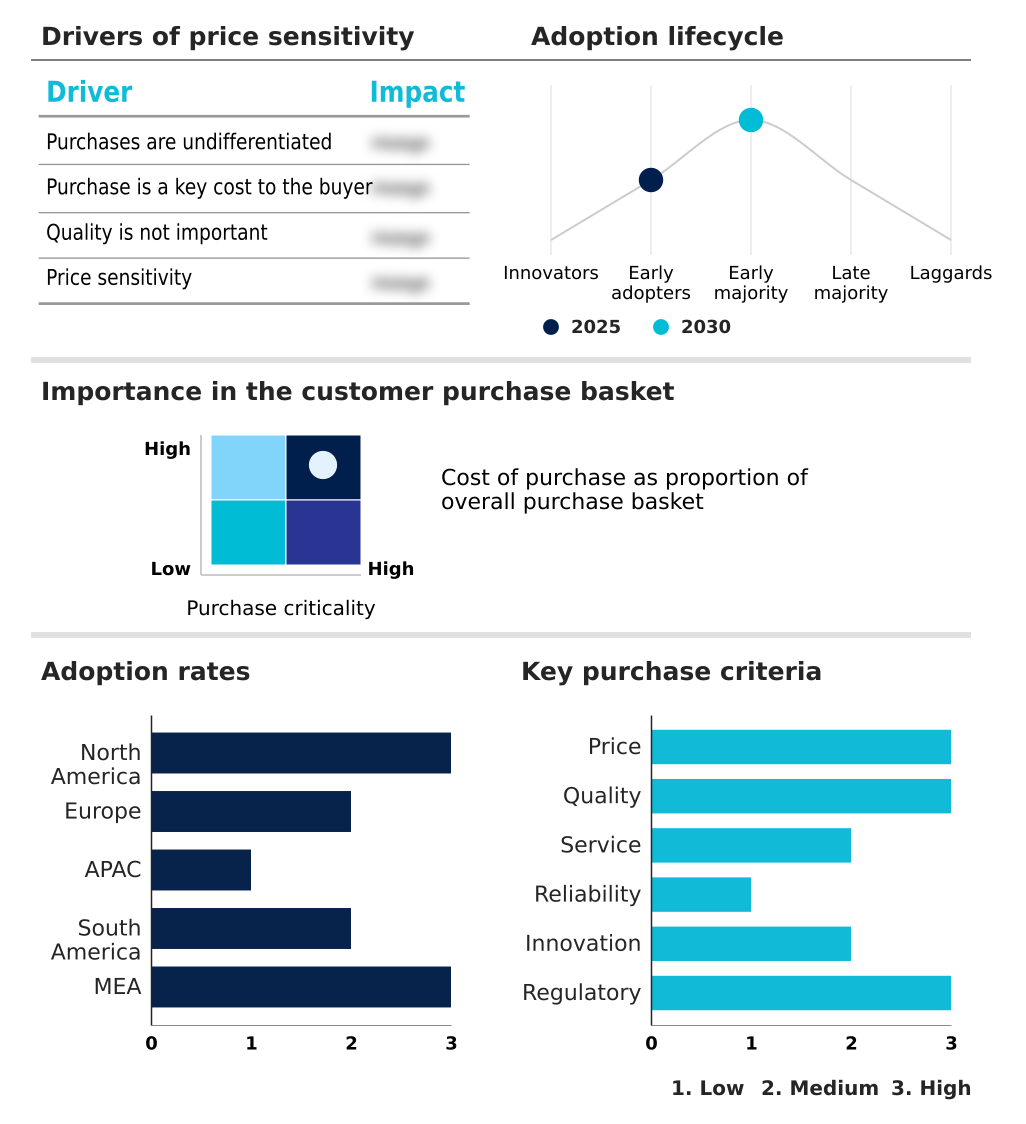
Exclusive Technavio Analysis on Customer Landscape

The soy and milk protein ingredients market forecasting report includes the adoption lifecycle of the market, covering from the innovator’s stage to the laggard’s stage. It focuses on adoption rates in different regions based on penetration. Furthermore, the soy and milk protein ingredients market report also includes key purchase criteria and drivers of price sensitivity to help companies evaluate and develop their market growth analysis strategies.

Customer Landscape of Soy And Milk Protein Ingredients Industry

Competitive Landscape

Companies are implementing various strategies, such as strategic alliances, soy and milk protein ingredients market forecast, partnerships, mergers and acquisitions, geographical expansion, and product/service launches, to enhance their presence in the industry.

Archer Daniels Midland Co. - Vendors provide specialized soy and milk protein ingredients, including isolates, concentrates, and hydrolysates, engineered for functional performance in nutrition, food, and beverage applications.

The industry research and growth report includes detailed analyses of the competitive landscape of the market and information about key companies, including:

  • Archer Daniels Midland Co.
  • Arla Foods amba
  • BRF SA
  • Bunge Global SA
  • Burcon NutraScience Corp.
  • Cargill Inc.
  • CHS Inc.
  • Devansoy Inc.
  • Fonterra Cooperative Group Ltd.
  • Fuji Oil Co. Ltd.
  • Glanbia plc
  • Hilmar Cheese Co. Inc.
  • Idaho Milk Products Inc.
  • Ingredion Inc.
  • Kerry Group Plc
  • Royal Friesland Campina NV
  • Solbar Ningbo Co. Ltd.
  • The Scoular Co.
  • Wilmar International Ltd.

Qualitative and quantitative analysis of companies has been conducted to help clients understand the wider business environment as well as the strengths and weaknesses of key industry players. Data is qualitatively analyzed to categorize companies as pure play, category-focused, industry-focused, and diversified; it is quantitatively analyzed to categorize companies as dominant, leading, strong, tentative, and weak.

Recent Development and News in Soy and milk protein ingredients market

  • In October 2024, Arla Foods Ingredients launched a new whey protein isolate solution specifically designed to prevent bar hardening, a common shelf-life challenge in the protein bar category.
  • In January 2025, Arla Foods Ingredients introduced a new whey protein hydrolysate concept specifically formulated to overcome taste challenges in high-protein medical nutrition beverages, improving patient compliance.
  • In February 2025, Archer Daniels Midland Co. announced a significant expansion of its regenerative agriculture program targeting soy production in North America, aiming to secure a scalable supply of low-carbon soy protein ingredients.
  • In February 2025, Fuji Oil Co. Ltd. unveiled a new low-sodium soy protein isolate engineered for use in plant-based meat alternatives, addressing consumer demand for healthier processed foods.

Dive into Technavio’s robust research methodology, blending expert interviews, extensive data synthesis, and validated models for unparalleled Soy And Milk Protein Ingredients Market insights. See full methodology.

Market Scope
Page number 295
Base year 2025
Historic period 2020-2024
Forecast period 2026-2030
Growth momentum & CAGR Accelerate at a CAGR of 5.4%
Market growth 2026-2030 USD 8828.6 million
Market structure Fragmented
YoY growth 2025-2026(%) 5.0%
Key countries US, Canada, Mexico, Germany, France, UK, Italy, Spain, The Netherlands, China, India, Japan, South Korea, Australia, Indonesia, Brazil, Argentina, Chile, Saudi Arabia, UAE, South Africa, Egypt and Nigeria
Competitive landscape Leading Companies, Market Positioning of Companies, Competitive Strategies, and Industry Risks

Request Free Sample

Research Analyst Overview

  • The soy and milk protein ingredients market is evolving beyond commodity supply toward high-functionality solutions driven by consumer demand for nutritional fortification and clean label ingredients. Companies are leveraging advanced ultrafiltration processing and enzymatic hydrolysis to create soy protein isolates and whey protein hydrolysates with specific functional attributes.
  • Boardroom strategy is increasingly centered on sustainable and ethical production, with regenerative agriculture programs and non-GMO soy sourcing becoming critical for brand differentiation and regulatory compliance. This focus on transparency has been shown to mitigate supply chain risks, with adherence to allergen labeling mandates reducing product recalls by a significant margin.
  • The development of specialized ingredients like micellar casein, bioactive peptides, and textured soy protein is essential for applications in sports nutrition supplements, meat analogue structuring, and clinical nutrition products. Success hinges on delivering ingredients with superior emulsification capacity, water-binding functionality, and optimized gelation properties for everything from dairy alternative development to infant formula formulation.

What are the Key Data Covered in this Soy And Milk Protein Ingredients Market Research and Growth Report?

  • What is the expected growth of the Soy And Milk Protein Ingredients Market between 2026 and 2030?

    • USD 8.83 billion, at a CAGR of 5.4%

  • What segmentation does the market report cover?

    • The report is segmented by Type (Milk protein ingredients, and Soy protein ingredients), Application (Food and beverages, Infant formulation, Personal care and cosmetics, and Others), Form Factor (Dry, and Liquid) and Geography (North America, Europe, APAC, South America, Middle East and Africa)

  • Which regions are analyzed in the report?

    • North America, Europe, APAC, South America and Middle East and Africa

  • What are the key growth drivers and market challenges?

    • Growing geriatric population globally, Allergen concerns related to soy and milk ingredients

  • Who are the major players in the Soy And Milk Protein Ingredients Market?

    • Archer Daniels Midland Co., Arla Foods amba, BRF SA, Bunge Global SA, Burcon NutraScience Corp., Cargill Inc., CHS Inc., Devansoy Inc., Fonterra Cooperative Group Ltd., Fuji Oil Co. Ltd., Glanbia plc, Hilmar Cheese Co. Inc., Idaho Milk Products Inc., Ingredion Inc., Kerry Group Plc, Royal Friesland Campina NV, Solbar Ningbo Co. Ltd., The Scoular Co. and Wilmar International Ltd.

Market Research Insights

  • Market dynamics are shaped by the dual pursuit of high-performance nutrition and rigorous quality assurance. The demand for weight management solutions and active nutrition products is driving innovation in texture modification agents and clear protein drinks. However, the industry grapples with significant supply chain transparency issues.
  • For example, counterfeit products containing less than 50% of their advertised protein content highlight critical quality control gaps that erode consumer confidence. Concurrently, demographic shifts are influential; with the human body's resting metabolic rate declining by 1-2% per decade after age 20, the need for products that support sarcopenia prevention and muscle synthesis support is intensifying.
  • This environment compels manufacturers to focus on both high-efficacy enteral nutrition formulas and secure, traceable sourcing to build brand integrity.

We can help! Our analysts can customize this soy and milk protein ingredients market research report to meet your requirements.

Get in touch

1. Executive Summary

1.1 Market overview

Executive Summary - Chart on Market Overview
Executive Summary - Data Table on Market Overview
Executive Summary - Chart on Global Market Characteristics
Executive Summary - Chart on Market by Geography
Executive Summary - Chart on Market Segmentation by Type
Executive Summary - Chart on Market Segmentation by Application
Executive Summary - Chart on Market Segmentation by Form Factor
Executive Summary - Chart on Incremental Growth
Executive Summary - Data Table on Incremental Growth
Executive Summary - Chart on Company Market Positioning

2. Technavio Analysis

2.1 Analysis of price sensitivity, lifecycle, customer purchase basket, adoption rates, and purchase criteria

2.2 Criticality of inputs and Factors of differentiation

Chart on Overview on criticality of inputs and factors of differentiation

2.3 Factors of disruption

Chart on Overview on factors of disruption

2.4 Impact of drivers and challenges

Chart on Impact of drivers and challenges in 2025 and 2030

3. Market Landscape

3.1 Market ecosystem

Chart on Parent Market
Data Table on - Parent Market

3.2 Market characteristics

Chart on Market characteristics analysis

3.3 Value chain analysis

Chart on Value chain analysis

4. Market Sizing

4.1 Market definition

Data Table on Offerings of companies included in the market definition

4.2 Market segment analysis

Market segments

4.3 Market size 2025

4.4 Market outlook: Forecast for 2025-2030

Chart on Global - Market size and forecast 2025-2030 ($ million)
Data Table on Global - Market size and forecast 2025-2030 ($ million)
Chart on Global Market: Year-over-year growth 2025-2030 (%)
Data Table on Global Market: Year-over-year growth 2025-2030 (%)

5. Historic Market Size

5.1 Global Soy And Milk Protein Ingredients Market 2020 - 2024

Historic Market Size - Data Table on Global Soy And Milk Protein Ingredients Market 2020 - 2024 ($ million)

5.2 Type segment analysis 2020 - 2024

Historic Market Size - Type Segment 2020 - 2024 ($ million)

5.3 Application segment analysis 2020 - 2024

Historic Market Size - Application Segment 2020 - 2024 ($ million)

5.4 Form Factor segment analysis 2020 - 2024

Historic Market Size - Form Factor Segment 2020 - 2024 ($ million)

5.5 Geography segment analysis 2020 - 2024

Historic Market Size - Geography Segment 2020 - 2024 ($ million)

5.6 Country segment analysis 2020 - 2024

Historic Market Size - Country Segment 2020 - 2024 ($ million)

6. Qualitative Analysis

6.1 Impact of AI on global soy and milk protein ingredients market

7. Five Forces Analysis

7.1 Five forces summary

Five forces analysis - Comparison between 2025 and 2030

7.2 Bargaining power of buyers

Bargaining power of buyers - Impact of key factors 2025 and 2030

7.3 Bargaining power of suppliers

Bargaining power of suppliers - Impact of key factors in 2025 and 2030

7.4 Threat of new entrants

Threat of new entrants - Impact of key factors in 2025 and 2030

7.5 Threat of substitutes

Threat of substitutes - Impact of key factors in 2025 and 2030

7.6 Threat of rivalry

Threat of rivalry - Impact of key factors in 2025 and 2030

7.7 Market condition

Chart on Market condition - Five forces 2025 and 2030

8. Market Segmentation by Type

8.1 Market segments

Chart on Type - Market share 2025-2030 (%)
Data Table on Type - Market share 2025-2030 (%)

8.2 Comparison by Type

Chart on Comparison by Type
Data Table on Comparison by Type

8.3 Milk protein ingredients - Market size and forecast 2025-2030

Chart on Milk protein ingredients - Market size and forecast 2025-2030 ($ million)
Data Table on Milk protein ingredients - Market size and forecast 2025-2030 ($ million)
Chart on Milk protein ingredients - Year-over-year growth 2025-2030 (%)
Data Table on Milk protein ingredients - Year-over-year growth 2025-2030 (%)

8.4 Soy protein ingredients - Market size and forecast 2025-2030

Chart on Soy protein ingredients - Market size and forecast 2025-2030 ($ million)
Data Table on Soy protein ingredients - Market size and forecast 2025-2030 ($ million)
Chart on Soy protein ingredients - Year-over-year growth 2025-2030 (%)
Data Table on Soy protein ingredients - Year-over-year growth 2025-2030 (%)

8.5 Market opportunity by Type

Market opportunity by Type ($ million)
Data Table on Market opportunity by Type ($ million)

9. Market Segmentation by Application

9.1 Market segments

Chart on Application - Market share 2025-2030 (%)
Data Table on Application - Market share 2025-2030 (%)

9.2 Comparison by Application

Chart on Comparison by Application
Data Table on Comparison by Application

9.3 Food and beverages - Market size and forecast 2025-2030

Chart on Food and beverages - Market size and forecast 2025-2030 ($ million)
Data Table on Food and beverages - Market size and forecast 2025-2030 ($ million)
Chart on Food and beverages - Year-over-year growth 2025-2030 (%)
Data Table on Food and beverages - Year-over-year growth 2025-2030 (%)

9.4 Infant formulation - Market size and forecast 2025-2030

Chart on Infant formulation - Market size and forecast 2025-2030 ($ million)
Data Table on Infant formulation - Market size and forecast 2025-2030 ($ million)
Chart on Infant formulation - Year-over-year growth 2025-2030 (%)
Data Table on Infant formulation - Year-over-year growth 2025-2030 (%)

9.5 Personal care and cosmetics - Market size and forecast 2025-2030

Chart on Personal care and cosmetics - Market size and forecast 2025-2030 ($ million)
Data Table on Personal care and cosmetics - Market size and forecast 2025-2030 ($ million)
Chart on Personal care and cosmetics - Year-over-year growth 2025-2030 (%)
Data Table on Personal care and cosmetics - Year-over-year growth 2025-2030 (%)

9.6 Others - Market size and forecast 2025-2030

Chart on Others - Market size and forecast 2025-2030 ($ million)
Data Table on Others - Market size and forecast 2025-2030 ($ million)
Chart on Others - Year-over-year growth 2025-2030 (%)
Data Table on Others - Year-over-year growth 2025-2030 (%)

9.7 Market opportunity by Application

Market opportunity by Application ($ million)
Data Table on Market opportunity by Application ($ million)

10. Market Segmentation by Form Factor

10.1 Market segments

Chart on Form Factor - Market share 2025-2030 (%)
Data Table on Form Factor - Market share 2025-2030 (%)

10.2 Comparison by Form Factor

Chart on Comparison by Form Factor
Data Table on Comparison by Form Factor

10.3 Dry - Market size and forecast 2025-2030

Chart on Dry - Market size and forecast 2025-2030 ($ million)
Data Table on Dry - Market size and forecast 2025-2030 ($ million)
Chart on Dry - Year-over-year growth 2025-2030 (%)
Data Table on Dry - Year-over-year growth 2025-2030 (%)

10.4 Liquid - Market size and forecast 2025-2030

Chart on Liquid - Market size and forecast 2025-2030 ($ million)
Data Table on Liquid - Market size and forecast 2025-2030 ($ million)
Chart on Liquid - Year-over-year growth 2025-2030 (%)
Data Table on Liquid - Year-over-year growth 2025-2030 (%)

10.5 Market opportunity by Form Factor

Market opportunity by Form Factor ($ million)
Data Table on Market opportunity by Form Factor ($ million)

11. Customer Landscape

11.1 Customer landscape overview

Analysis of price sensitivity, lifecycle, customer purchase basket, adoption rates, and purchase criteria

12. Geographic Landscape

12.1 Geographic segmentation

Chart on Market share by geography 2025-2030 (%)
Data Table on Market share by geography 2025-2030 (%)

12.2 Geographic comparison

Chart on Geographic comparison
Data Table on Geographic comparison

12.3 North America - Market size and forecast 2025-2030

Chart on North America - Market size and forecast 2025-2030 ($ million)
Data Table on North America - Market size and forecast 2025-2030 ($ million)
Chart on North America - Year-over-year growth 2025-2030 (%)
Data Table on North America - Year-over-year growth 2025-2030 (%)
Chart on Regional Comparison - North America
Data Table on Regional Comparison - North America

12.3.1 US - Market size and forecast 2025-2030

Chart on US - Market size and forecast 2025-2030 ($ million)
Data Table on US - Market size and forecast 2025-2030 ($ million)
Chart on US - Year-over-year growth 2025-2030 (%)
Data Table on US - Year-over-year growth 2025-2030 (%)

12.3.2 Canada - Market size and forecast 2025-2030

Chart on Canada - Market size and forecast 2025-2030 ($ million)
Data Table on Canada - Market size and forecast 2025-2030 ($ million)
Chart on Canada - Year-over-year growth 2025-2030 (%)
Data Table on Canada - Year-over-year growth 2025-2030 (%)

12.3.3 Mexico - Market size and forecast 2025-2030

Chart on Mexico - Market size and forecast 2025-2030 ($ million)
Data Table on Mexico - Market size and forecast 2025-2030 ($ million)
Chart on Mexico - Year-over-year growth 2025-2030 (%)
Data Table on Mexico - Year-over-year growth 2025-2030 (%)

12.4 Europe - Market size and forecast 2025-2030

Chart on Europe - Market size and forecast 2025-2030 ($ million)
Data Table on Europe - Market size and forecast 2025-2030 ($ million)
Chart on Europe - Year-over-year growth 2025-2030 (%)
Data Table on Europe - Year-over-year growth 2025-2030 (%)
Chart on Regional Comparison - Europe
Data Table on Regional Comparison - Europe

12.4.1 Germany - Market size and forecast 2025-2030

Chart on Germany - Market size and forecast 2025-2030 ($ million)
Data Table on Germany - Market size and forecast 2025-2030 ($ million)
Chart on Germany - Year-over-year growth 2025-2030 (%)
Data Table on Germany - Year-over-year growth 2025-2030 (%)

12.4.2 France - Market size and forecast 2025-2030

Chart on France - Market size and forecast 2025-2030 ($ million)
Data Table on France - Market size and forecast 2025-2030 ($ million)
Chart on France - Year-over-year growth 2025-2030 (%)
Data Table on France - Year-over-year growth 2025-2030 (%)

12.4.3 UK - Market size and forecast 2025-2030

Chart on UK - Market size and forecast 2025-2030 ($ million)
Data Table on UK - Market size and forecast 2025-2030 ($ million)
Chart on UK - Year-over-year growth 2025-2030 (%)
Data Table on UK - Year-over-year growth 2025-2030 (%)

12.4.4 Italy - Market size and forecast 2025-2030

Chart on Italy - Market size and forecast 2025-2030 ($ million)
Data Table on Italy - Market size and forecast 2025-2030 ($ million)
Chart on Italy - Year-over-year growth 2025-2030 (%)
Data Table on Italy - Year-over-year growth 2025-2030 (%)

12.4.5 Spain - Market size and forecast 2025-2030

Chart on Spain - Market size and forecast 2025-2030 ($ million)
Data Table on Spain - Market size and forecast 2025-2030 ($ million)
Chart on Spain - Year-over-year growth 2025-2030 (%)
Data Table on Spain - Year-over-year growth 2025-2030 (%)

12.4.6 The Netherlands - Market size and forecast 2025-2030

Chart on The Netherlands - Market size and forecast 2025-2030 ($ million)
Data Table on The Netherlands - Market size and forecast 2025-2030 ($ million)
Chart on The Netherlands - Year-over-year growth 2025-2030 (%)
Data Table on The Netherlands - Year-over-year growth 2025-2030 (%)

12.5 APAC - Market size and forecast 2025-2030

Chart on APAC - Market size and forecast 2025-2030 ($ million)
Data Table on APAC - Market size and forecast 2025-2030 ($ million)
Chart on APAC - Year-over-year growth 2025-2030 (%)
Data Table on APAC - Year-over-year growth 2025-2030 (%)
Chart on Regional Comparison - APAC
Data Table on Regional Comparison - APAC

12.5.1 China - Market size and forecast 2025-2030

Chart on China - Market size and forecast 2025-2030 ($ million)
Data Table on China - Market size and forecast 2025-2030 ($ million)
Chart on China - Year-over-year growth 2025-2030 (%)
Data Table on China - Year-over-year growth 2025-2030 (%)

12.5.2 India - Market size and forecast 2025-2030

Chart on India - Market size and forecast 2025-2030 ($ million)
Data Table on India - Market size and forecast 2025-2030 ($ million)
Chart on India - Year-over-year growth 2025-2030 (%)
Data Table on India - Year-over-year growth 2025-2030 (%)

12.5.3 Japan - Market size and forecast 2025-2030

Chart on Japan - Market size and forecast 2025-2030 ($ million)
Data Table on Japan - Market size and forecast 2025-2030 ($ million)
Chart on Japan - Year-over-year growth 2025-2030 (%)
Data Table on Japan - Year-over-year growth 2025-2030 (%)

12.5.4 South Korea - Market size and forecast 2025-2030

Chart on South Korea - Market size and forecast 2025-2030 ($ million)
Data Table on South Korea - Market size and forecast 2025-2030 ($ million)
Chart on South Korea - Year-over-year growth 2025-2030 (%)
Data Table on South Korea - Year-over-year growth 2025-2030 (%)

12.5.5 Australia - Market size and forecast 2025-2030

Chart on Australia - Market size and forecast 2025-2030 ($ million)
Data Table on Australia - Market size and forecast 2025-2030 ($ million)
Chart on Australia - Year-over-year growth 2025-2030 (%)
Data Table on Australia - Year-over-year growth 2025-2030 (%)

12.5.6 Indonesia - Market size and forecast 2025-2030

Chart on Indonesia - Market size and forecast 2025-2030 ($ million)
Data Table on Indonesia - Market size and forecast 2025-2030 ($ million)
Chart on Indonesia - Year-over-year growth 2025-2030 (%)
Data Table on Indonesia - Year-over-year growth 2025-2030 (%)

12.6 South America - Market size and forecast 2025-2030

Chart on South America - Market size and forecast 2025-2030 ($ million)
Data Table on South America - Market size and forecast 2025-2030 ($ million)
Chart on South America - Year-over-year growth 2025-2030 (%)
Data Table on South America - Year-over-year growth 2025-2030 (%)
Chart on Regional Comparison - South America
Data Table on Regional Comparison - South America

12.6.1 Brazil - Market size and forecast 2025-2030

Chart on Brazil - Market size and forecast 2025-2030 ($ million)
Data Table on Brazil - Market size and forecast 2025-2030 ($ million)
Chart on Brazil - Year-over-year growth 2025-2030 (%)
Data Table on Brazil - Year-over-year growth 2025-2030 (%)

12.6.2 Argentina - Market size and forecast 2025-2030

Chart on Argentina - Market size and forecast 2025-2030 ($ million)
Data Table on Argentina - Market size and forecast 2025-2030 ($ million)
Chart on Argentina - Year-over-year growth 2025-2030 (%)
Data Table on Argentina - Year-over-year growth 2025-2030 (%)

12.6.3 Chile - Market size and forecast 2025-2030

Chart on Chile - Market size and forecast 2025-2030 ($ million)
Data Table on Chile - Market size and forecast 2025-2030 ($ million)
Chart on Chile - Year-over-year growth 2025-2030 (%)
Data Table on Chile - Year-over-year growth 2025-2030 (%)

12.7 Middle East and Africa - Market size and forecast 2025-2030

Chart on Middle East and Africa - Market size and forecast 2025-2030 ($ million)
Data Table on Middle East and Africa - Market size and forecast 2025-2030 ($ million)
Chart on Middle East and Africa - Year-over-year growth 2025-2030 (%)
Data Table on Middle East and Africa - Year-over-year growth 2025-2030 (%)
Chart on Regional Comparison - Middle East and Africa
Data Table on Regional Comparison - Middle East and Africa

12.7.1 Saudi Arabia - Market size and forecast 2025-2030

Chart on Saudi Arabia - Market size and forecast 2025-2030 ($ million)
Data Table on Saudi Arabia - Market size and forecast 2025-2030 ($ million)
Chart on Saudi Arabia - Year-over-year growth 2025-2030 (%)
Data Table on Saudi Arabia - Year-over-year growth 2025-2030 (%)

12.7.2 UAE - Market size and forecast 2025-2030

Chart on UAE - Market size and forecast 2025-2030 ($ million)
Data Table on UAE - Market size and forecast 2025-2030 ($ million)
Chart on UAE - Year-over-year growth 2025-2030 (%)
Data Table on UAE - Year-over-year growth 2025-2030 (%)

12.7.3 South Africa - Market size and forecast 2025-2030

Chart on South Africa - Market size and forecast 2025-2030 ($ million)
Data Table on South Africa - Market size and forecast 2025-2030 ($ million)
Chart on South Africa - Year-over-year growth 2025-2030 (%)
Data Table on South Africa - Year-over-year growth 2025-2030 (%)

12.7.4 Egypt - Market size and forecast 2025-2030

Chart on Egypt - Market size and forecast 2025-2030 ($ million)
Data Table on Egypt - Market size and forecast 2025-2030 ($ million)
Chart on Egypt - Year-over-year growth 2025-2030 (%)
Data Table on Egypt - Year-over-year growth 2025-2030 (%)

12.7.5 Nigeria - Market size and forecast 2025-2030

Chart on Nigeria - Market size and forecast 2025-2030 ($ million)
Data Table on Nigeria - Market size and forecast 2025-2030 ($ million)
Chart on Nigeria - Year-over-year growth 2025-2030 (%)
Data Table on Nigeria - Year-over-year growth 2025-2030 (%)

12.8 Market opportunity by geography

Market opportunity by geography ($ million)
Data Tables on Market opportunity by geography ($ million)

13. Drivers, Challenges, and Opportunity

13.1 Market drivers

Growing geriatric population globally
Thriving food and beverage industry in developing countries
Increasing popularity of sports nutrition products

13.2 Market challenges

Allergen concerns related to soy and milk ingredients
Presence of stringent government regulations for protein products
Availability of counterfeit soy and milk protein ingredients

13.3 Impact of drivers and challenges

Impact of drivers and challenges in 2025 and 2030

13.4 Market opportunities

Increasing demand for plant-based proteins
Surge in promotional and marketing strategies
Growing new product developments related to protein ingredients

14. Competitive Landscape

14.1 Overview

14.2

Overview on criticality of inputs and factors of differentiation

14.3 Landscape disruption

Overview on factors of disruption

14.4 Industry risks

Impact of key risks on business

15. Competitive Analysis

15.1 Companies profiled

Companies covered

15.2 Company ranking index

15.3 Market positioning of companies

Matrix on companies position and classification

15.4 Archer Daniels Midland Co.

Archer Daniels Midland Co. - Overview
Archer Daniels Midland Co. - Business segments
Archer Daniels Midland Co. - Key news
Archer Daniels Midland Co. - Key offerings
Archer Daniels Midland Co. - Segment focus
SWOT

15.5 Arla Foods amba

Arla Foods amba - Overview
Arla Foods amba - Product / Service
Arla Foods amba - Key offerings
SWOT

15.6 BRF SA

BRF SA - Overview
BRF SA - Product / Service
BRF SA - Key offerings
SWOT

15.7 Bunge Global SA

Bunge Global SA - Overview
Bunge Global SA - Business segments
Bunge Global SA - Key news
Bunge Global SA - Key offerings
Bunge Global SA - Segment focus
SWOT

15.8 Cargill Inc.

Cargill Inc. - Overview
Cargill Inc. - Product / Service
Cargill Inc. - Key offerings
SWOT

15.9 CHS Inc.

CHS Inc. - Overview
CHS Inc. - Business segments
CHS Inc. - Key offerings
CHS Inc. - Segment focus
SWOT

15.10 Fonterra Cooperative Group Ltd.

Fonterra Cooperative Group Ltd. - Overview
Fonterra Cooperative Group Ltd. - Business segments
Fonterra Cooperative Group Ltd. - Key news
Fonterra Cooperative Group Ltd. - Key offerings
Fonterra Cooperative Group Ltd. - Segment focus
SWOT

15.11 Fuji Oil Co. Ltd.

Fuji Oil Co. Ltd. - Overview
Fuji Oil Co. Ltd. - Business segments
Fuji Oil Co. Ltd. - Key offerings
Fuji Oil Co. Ltd. - Segment focus
SWOT

15.12 Glanbia plc

Glanbia plc - Overview
Glanbia plc - Business segments
Glanbia plc - Key news
Glanbia plc - Key offerings
Glanbia plc - Segment focus
SWOT

15.13 Hilmar Cheese Co. Inc.

Hilmar Cheese Co. Inc. - Overview
Hilmar Cheese Co. Inc. - Product / Service
Hilmar Cheese Co. Inc. - Key offerings
SWOT

15.14 Idaho Milk Products Inc.

Idaho Milk Products Inc. - Overview
Idaho Milk Products Inc. - Product / Service
Idaho Milk Products Inc. - Key offerings
SWOT

15.15 Ingredion Inc.

Ingredion Inc. - Overview
Ingredion Inc. - Business segments
Ingredion Inc. - Key news
Ingredion Inc. - Key offerings
Ingredion Inc. - Segment focus
SWOT

15.16 Kerry Group Plc

Kerry Group Plc - Overview
Kerry Group Plc - Business segments
Kerry Group Plc - Key news
Kerry Group Plc - Key offerings
Kerry Group Plc - Segment focus
SWOT

15.17 Royal Friesland Campina NV

Royal Friesland Campina NV - Overview
Royal Friesland Campina NV - Product / Service
Royal Friesland Campina NV - Key offerings
SWOT

15.18 Wilmar International Ltd.

Wilmar International Ltd. - Overview
Wilmar International Ltd. - Business segments
Wilmar International Ltd. - Key offerings
Wilmar International Ltd. - Segment focus
SWOT

16. Appendix

16.1 Scope of the report

Market definition
Objectives
Notes and caveats

16.2 Inclusions and exclusions checklist

Inclusions checklist
Exclusions checklist

16.3 Currency conversion rates for US$

16.4 Research methodology

16.5 Data procurement

Information sources

16.6 Data validation

16.7 Validation techniques employed for market sizing

16.8 Data synthesis

16.9 360 degree market analysis

16.10 List of abbreviations

Research Methodology

Technavio presents a detailed picture of the market by way of study, synthesis, and summation of data from multiple sources. The analysts have presented the various facets of the market with a particular focus on identifying the key industry influencers. The data thus presented is comprehensive, reliable, and the result of extensive research, both primary and secondary.

INFORMATION SOURCES

Primary sources

  • Manufacturers and suppliers
  • Channel partners
  • Industry experts
  • Strategic decision makers

Secondary sources

  • Industry journals and periodicals
  • Government data
  • Financial reports of key industry players
  • Historical data
  • Press releases

DATA ANALYSIS

Data Synthesis

  • Collation of data
  • Estimation of key figures
  • Analysis of derived insights

Data Validation

  • Triangulation with data models
  • Reference against proprietary databases
  • Corroboration with industry experts

REPORT WRITING

Qualitative

  • Market drivers
  • Market challenges
  • Market trends
  • Five forces analysis

Quantitative

  • Market size and forecast
  • Market segmentation
  • Geographical insights
  • Competitive landscape

Interested in this report?

Get your sample now to see our research methodology and insights!

Download Now

Frequently Asked Questions

Soy And Milk Protein Ingredients market growth will increase by USD 8828.6 million during 2026-2030 .

The Soy And Milk Protein Ingredients market is expected to grow at a CAGR of 5.4% during 2026-2030 .

Soy And Milk Protein Ingredients market is segmented by Type (Milk protein ingredients, Soy protein ingredients) Application (Food and beverages, Infant formulation, Personal care and cosmetics, Others) Form factor (Dry, Liquid)

Archer Daniels Midland Co., Arla Foods amba, BRF SA, Bunge Global SA, Burcon NutraScience Corp., Cargill Inc., CHS Inc., Devansoy Inc., Fonterra Cooperative Group Ltd., Fuji Oil Co. Ltd., Glanbia plc, Hilmar Cheese Co. Inc., Idaho Milk Products Inc., Ingredion Inc., Kerry Group Plc, Royal Friesland Campina NV, Solbar Ningbo Co. Ltd., The Scoular Co., Wilmar International Ltd. are a few of the key vendors in the Soy And Milk Protein Ingredients market.

North America will register the highest growth rate of 34.5% among the other regions. Therefore, the Soy And Milk Protein Ingredients market in North America is expected to garner significant business opportunities for the vendors during the forecast period.

US, Canada, Mexico, Germany, France, UK, Italy, Spain, The Netherlands, China, India, Japan, South Korea, Australia, Indonesia, Brazil, Argentina, Chile, Saudi Arabia, UAE, South Africa, Egypt, Nigeria

  • Growing geriatric population globally is the driving factor this market.

The Soy And Milk Protein Ingredients market vendors should focus on grabbing business opportunities from the Type segment as it accounted for the largest market share in the base year.