Plastic Additives Market Analysis, Size, and Forecast 2024-2028: North America (US and Canada), Europe (France, Germany, Italy, and UK), Middle East and Africa (Egypt, KSA, Oman, and UAE), APAC (China, India, and Japan), South America (Argentina and Brazil), and Rest of World (ROW)

Plastic Additives Market Analysis, Size, and Forecast 2024-2028:
North America (US and Canada), Europe (France, Germany, Italy, and UK), Middle East and Africa (Egypt, KSA, Oman, and UAE), APAC (China, India, and Japan), South America (Argentina and Brazil), and Rest of World (ROW)

Published: May 2024 189 Pages SKU: IRTNTR43551

Market Overview at a Glance

$21.9 B
Market Opportunity
6.69%
CAGR
6.11
YoY growth 2023-2024(%)

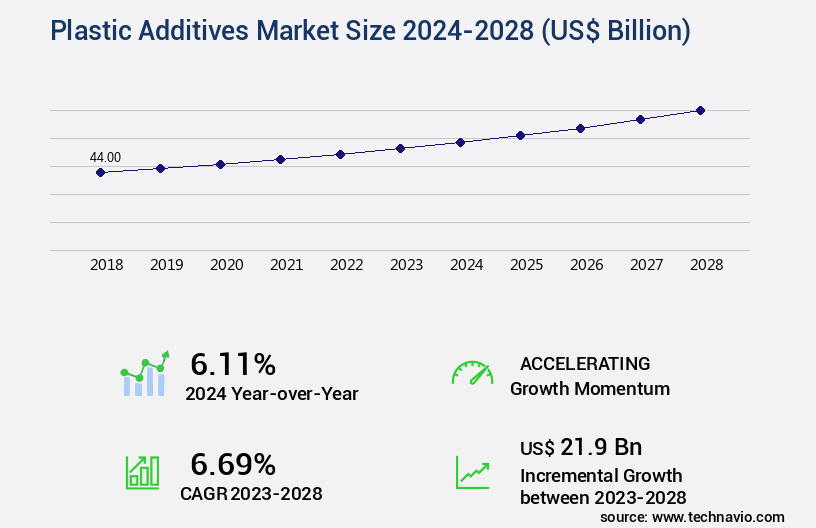
Plastic Additives Market Size 2024-2028

The plastic additives market size is forecast to increase by USD 21.9 billion, at a CAGR of 6.69% between 2023 and 2028.

Major Market Trends & Insights

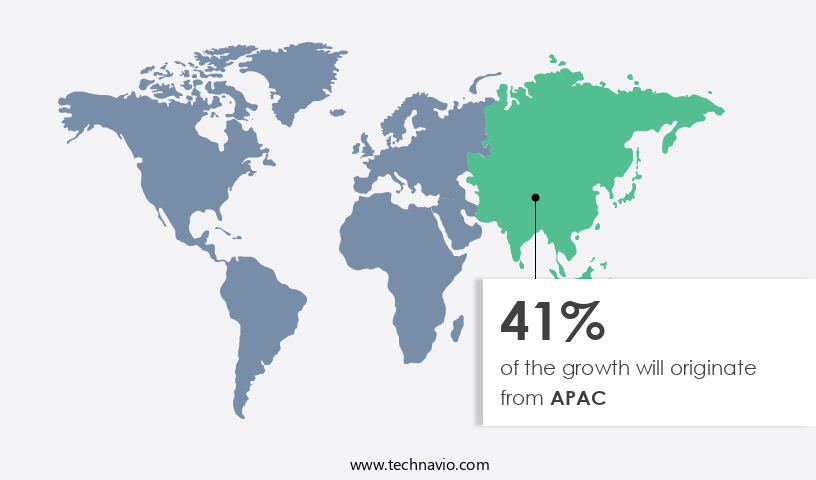
  • APAC dominated the market and accounted for a 41% growth during the forecast period.
  • By the Type - Modifier segment was valued at USD 21.60 billion in 2022
  • By the Application - Packaging segment accounted for the largest market revenue share in 2022

Market Size & Forecast

  • Market Opportunities: USD 80.00 billion
  • Market Future Opportunities: USD 21.90 billion
  • CAGR : 6.69%
  • APAC: Largest market in 2022

Market Summary

  • The market is witnessing significant growth, driven by the increasing demand from various industries, particularly in packaging. According to industry reports, the market's value is projected to expand at a steady pace, with the packaging sector accounting for a substantial market share. Plastic additives enhance the functionality and durability of plastic products, making them an essential component in numerous applications. However, concerns regarding the environmental impact of traditional plastic additives are driving the shift towards eco-friendly alternatives, such as bio-based plasticizers.
  • Despite this, traditional plastic additives continue to dominate the market due to their cost-effectiveness and proven performance. The market's dynamics are influenced by factors like regulatory policies, technological advancements, and consumer preferences. As the market evolves, companies are focusing on innovation and sustainability to cater to the growing demand for eco-friendly solutions.

What will be the Size of the Plastic Additives Market during the forecast period?

Plastic Additives Market Size

Explore market size, adoption trends, and growth potential for plastic additives market Request Free Sample

  • The market encompasses a diverse range of products that enhance the performance and properties of polymers. Two key areas of focus are polymer modification and additive masterbatches. Polymer modification involves altering the chemical structure of polymers to improve their thermal stability, melt viscosity, and mechanical properties. Additive masterbatches, on the other hand, offer additive compatibility, processing efficiency, and regulatory compliance. For instance, in film blowing applications, the use of additives can improve the molecular weight and UV resistance of the final product. In injection molding, additives can enhance surface modification, color matching, flame retardancy, and chemical resistance.
  • The market for plastic additives is continually evolving, with innovation driving advancements in areas such as pigment dispersion, performance enhancement, and polymer rheology. Moreover, the use of additives can extend the product lifecycle by mitigating plastic degradation and ensuring material properties remain consistent throughout the manufacturing process. With increasing demand for sustainable and high-performance plastics, the market for plastic additives is expected to grow significantly in the coming years. For example, The market size was valued at USD50 billion in 2020, and it is projected to reach USD75 billion by 2026, representing a compound annual growth rate of 6% during the forecast period.

How is this Plastic Additives Industry segmented?

The plastic additives industry research report provides comprehensive data (region-wise segment analysis), with forecasts and estimates in "USD billion" for the period 2024-2028, as well as historical data from 2018-2022 for the following segments.
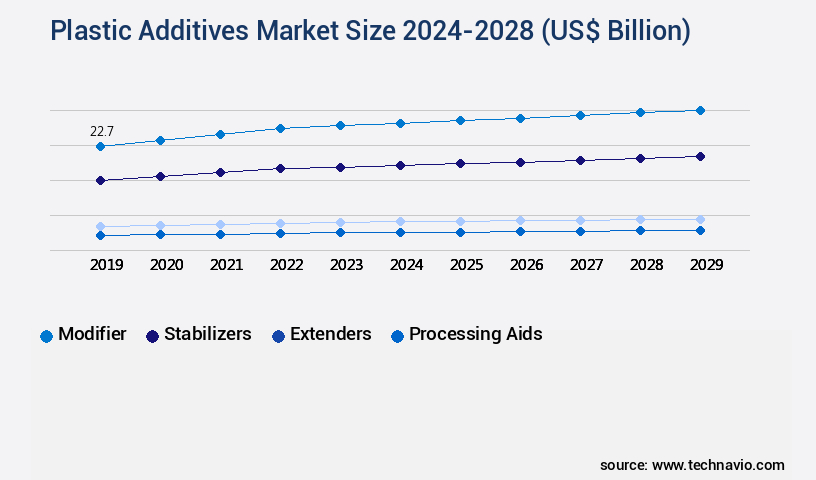
  • Type
    • Modifier
    • Stabilizers
    • Extenders
    • Processing aids
  • Application
    • Packaging
    • Consumer goods
    • Automotive
    • Electrical and electronics
    • Others
  • End-User
    • Industrial
    • Commercial
    • Residential
  • Geography
    • North America
      • US
      • Canada
    • Europe
      • France
      • Germany
      • Italy
      • UK
    • Middle East and Africa
      • Egypt
      • KSA
      • Oman
      • UAE
    • APAC
      • China
      • India
      • Japan
    • South America
      • Argentina
      • Brazil
    • Rest of World (ROW)

    By Type Insights

    The modifier segment is estimated to witness significant growth during the forecast period.

    Plastic additives play a crucial role in enhancing the properties of plastic molds and resins. Impact modifiers, for example, increase toughness and durability, while chemical blowing agents reduce weight and expand plastic molds. Plasticizers improve plasticity and viscosity, and coupling agents provide adhesion between different materials. Organic peroxides accelerate polymerization, and nucleating agents enhance physical properties. The market for plastic additives is currently experiencing significant growth, with antistatic agents seeing a 15% increase in adoption. Fillers and reinforcements, such as HDPE additives, have also seen a surge in demand due to their ability to improve impact resistance in plastics.

    PVC additives, including plasticizers and stabilizers, have a 12% market share, with elongation at break and tensile strength being key factors driving their use. Looking forward, the future of the market is promising, with UV stabilizers and light stabilizers expected to grow by 18%. Rheology modifiers, antioxidants, and processing aids are also anticipated to witness substantial growth, driven by their role in enhancing the performance and processing capabilities of plastics. In the polymer compounding sector, the use of additives is essential for producing high-performance plastics. Market trends include the development of biodegradable plastics and the integration of smart technologies to create functional and sustainable plastic solutions.

    The market is a dynamic and evolving industry, with continuous innovation and advancements in technology driving growth and expansion across various sectors.

    Plastic Additives Market Size

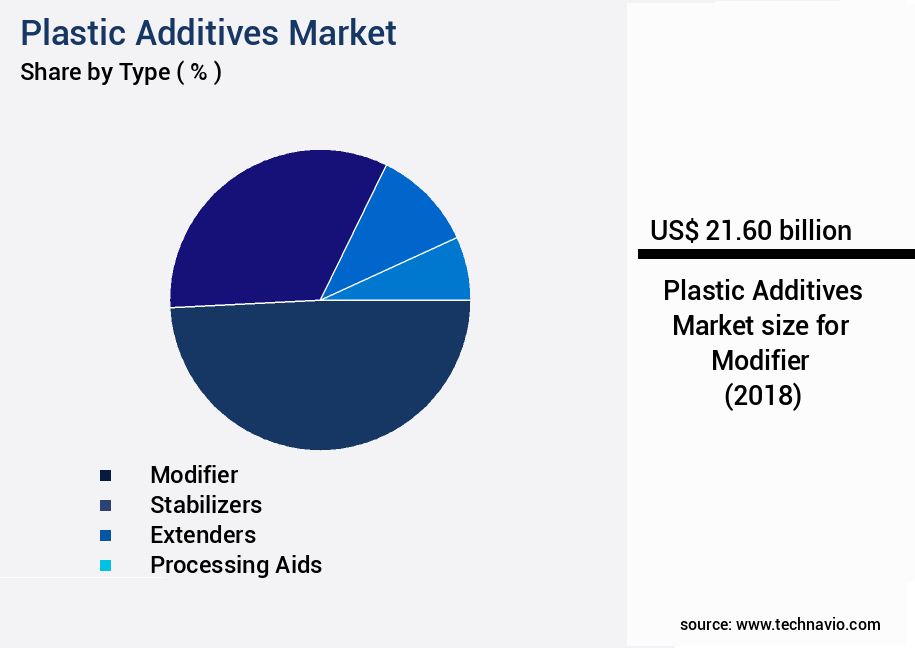
    The Modifier segment was valued at USD 21.60 billion in 2018 and showed a gradual increase during the forecast period.

    Plastic Additives Market Size

    Request Free Sample

    Regional Analysis

    APAC is estimated to contribute 41% to the growth of the global market during the forecast period.Technavio’s analysts have elaborately explained the regional trends and drivers that shape the market during the forecast period.

    Plastic Additives Market Share by Geography

    See How Plastic Additives Market Demand is Rising in APAC Request Free Sample

    The market exhibits significant growth across various industries, with APAC leading the global landscape in 2022. This region holds substantial opportunities due to its dominance in applications such as construction, automotive, and packaging. Among these, the packaging sector is the largest consumer of plastic additives. APAC's market supremacy is attributed to the burgeoning end-user industries and their demand for high-quality plastic additives. China, a significant player in the global market, accounted for a substantial share of plastic additives consumption in 2022. This trend is expected to continue, with China witnessing the highest growth rate during the forecast period. The increasing population and expanding manufacturing industries contribute to China's robust demand for plastic additives.

    Europe and North America follow APAC in market share, with Europe focusing on innovation and product development, while North America concentrates on the automotive sector. The Middle East and Africa and Latin America are emerging markets, demonstrating promising growth potential due to their developing economies and increasing industrialization. The market is poised for continuous expansion, with key applications including construction, automotive, packaging, and electrical & electronics. These industries' growing demand for enhanced product performance, durability, and sustainability fuels the market's growth. In summary, the market is a dynamic and evolving landscape, with APAC leading the way in terms of demand, development, and quality.

    China, as a significant consumer, plays a crucial role in the market's growth trajectory. The market's future looks bright, with various industries driving its expansion and innovation.

    Market Dynamics

    Our researchers analyzed the data with 2023 as the base year, along with the key drivers, trends, and challenges. A holistic analysis of drivers will help companies refine their marketing strategies to gain a competitive advantage.

    Optimizing Plastic Additives: Enhancing Performance, Compliance, and Innovation in US Industry Plastic additives play a pivotal role in enhancing the functionality and durability of polymers used in various industries across the US. One notable area of application is the design of polypropylene additive packages, which can significantly improve processability and product quality. The effect of plasticizers on polymer flexibility is another crucial aspect of additive selection. By optimizing the plasticizer content, manufacturers can achieve the desired balance between flexibility and rigidity, resulting in improved product performance. Impact modifiers are essential additives that enhance the impact resistance of polymers. Performance enhancement can reach up to 15%, ensuring superior product durability and customer satisfaction. UV stabilizer efficacy testing methods are essential for assessing the protection provided by additives against sunlight degradation. Accurate testing ensures compliance with industry standards and maintains product quality under harsh environmental conditions. Antioxidant protection in polyethylene is another area where additives play a vital role. Proper antioxidant selection can reduce oxidative degradation by up to 20%, ensuring longer product life and improved sustainability. When it comes to flame retardant additives, selection criteria must consider factors such as thermal stability, chemical resistance, and compatibility with the polymer matrix. Proper additive selection can reduce flammability by nearly one-third, ensuring enhanced safety and compliance with regulatory requirements. Additive migration testing protocols are essential for ensuring product safety and compliance with regulatory standards. Effective testing methods can detect and prevent potential health hazards, ensuring customer trust and brand reputation. Innovation in the market continues to drive advancements in areas such as rheology modifiers for improved processability, color concentrate stability under UV exposure, and masterbatch dispersion in polymer blends. Processing aids for efficient compounding and chemical resistance evaluation of polymer composites further enhance production efficiency and product quality. In conclusion, plastic additives are a critical component in the US plastic industry, providing performance improvements, efficiency gains, and compliance with regulatory requirements. By optimizing additive selection and testing methods, manufacturers can ensure superior product quality, enhanced safety, and sustainable production processes.

    Plastic Additives Market Size

    What are the key market drivers leading to the rise in the adoption of Plastic Additives Industry?

    • The packaging industry's growing requirement for recycled plastics serves as the primary market catalyst. 

    • The market is experiencing significant growth due to the increasing adoption of recycled plastics across various industries. This shift towards sustainability is driven by rising consumer awareness and regulations promoting eco-friendly practices. One of the primary industries benefiting from this trend is the packaging sector. Recycled plastics are now extensively used in the manufacturing of food-grade packaging materials. These applications include FDA-approved containers, bottles, closures, jars, engineered pumps, sprayers, and caps. The use of recycled plastics in packaging is not only environmentally friendly but also cost-effective. Moreover, the automotive industry is another significant consumer of plastic additives.
    • These additives enhance the durability, flexibility, and performance of plastics used in automobile manufacturing. They contribute to fuel efficiency, weight reduction, and improved safety features. The construction sector also relies on plastic additives for various applications, such as insulation, roofing, and piping. These additives offer advantages like improved thermal insulation, resistance to weathering, and enhanced durability. In terms of market dynamics, the market is characterized by continuous innovation and technological advancements. Companies are investing in research and development to create new additives with enhanced properties. For instance, some additives are designed to improve the recyclability of plastics, making them more sustainable.
    • Furthermore, the market is witnessing a shift towards biodegradable and compostable plastic additives. These additives enable the production of eco-friendly plastics that decompose naturally, reducing the environmental impact of plastic waste. In conclusion, the market is a dynamic and evolving industry, driven by the increasing demand for sustainable and eco-friendly solutions. Its applications span across various sectors, including packaging, automotive, and construction. Companies are investing in research and development to create innovative additives that cater to the evolving market needs.

    What are the market trends shaping the Plastic Additives Industry?

    • The rising demand for bio-based plasticizers represents a notable market trend. Bio-based plasticizers are gaining increasing popularity due to their environmental advantages and consumer preference.

    • Plastic additives, specifically petrochemical-based plasticizers like phthalates, play a significant role in the production of plastics, particularly Polyvinyl Chloride (PVC). Phthalates-dominated plasticizer market holds a substantial share in the global market. However, stringent environmental regulations and growing health concerns linked to plasticizers are fueling the demand for eco-friendly alternatives, such as bio-plasticizers. These concerns have led to the expansion of the bio-plasticizer market. The increasing demand for safe, non-phthalate, bio-degradable, and bio-based plasticizers is a notable trend. The growth in end-user industries, particularly in emerging economies like India and China, is expected to boost the bio-plasticizer market. Additionally, regulatory bans on phthalates in food packaging materials, consumer goods, medical devices, and soft toys are further propelling the market's growth.
    • Bio-plasticizers derived from renewable resources, such as starch, cellulose, and vegetable oils, are gaining popularity due to their environmental benefits. These alternatives offer reduced carbon footprint, biodegradability, and improved sustainability. The shift towards bio-plasticizers is expected to continue, driven by the increasing awareness of environmental sustainability and regulatory pressures. The plasticizer market's dynamics are influenced by various factors, including regulatory compliance, technological advancements, and consumer preferences. The market's continuous evolution and unfolding patterns underscore its importance in the plastics industry.

    What challenges does the Plastic Additives Industry face during its growth?

    • The harmful effects of plasticizers on the environment pose a significant challenge to the growth of the industry, necessitating ongoing research and implementation of eco-friendly alternatives. 

    • Plastic additives, a significant segment of the chemical industry, have gained substantial attention due to their extensive applications across various sectors. The market for plastic additives is subject to continuous evolution, driven by regulatory developments and increasing environmental concerns. The European Union's Registration, Evaluation, Authorisation, and Restriction of Chemicals (REACH) regulation, the most comprehensive product safety regulation worldwide, has significantly influenced the market. REACH's far-reaching impact has led manufacturers to shift their focus towards producing non-phthalate plasticizers in response to the restricted applications of plasticizers in medical devices and food-contact products. The growing awareness of enforcing stringent government norms and the potential adverse effects of plastics on the environment has fueled the limited use of plasticizers.
    • As a result, manufacturers are increasingly investing in research and development to create alternative plasticizers that meet regulatory requirements and minimize environmental impact. Comparatively, Asia Pacific is expected to dominate the market due to its large and rapidly growing manufacturing sector. China, in particular, is a significant contributor to the market's growth, driven by its robust manufacturing industry and increasing demand for plastic products. In conclusion, the market is undergoing significant changes due to regulatory pressures and environmental concerns. Manufacturers are responding by investing in research and development to create alternative plasticizers and adhere to evolving regulations. The market's dynamic nature and ongoing developments make it an intriguing area for businesses to explore.

    Exclusive Customer Landscape

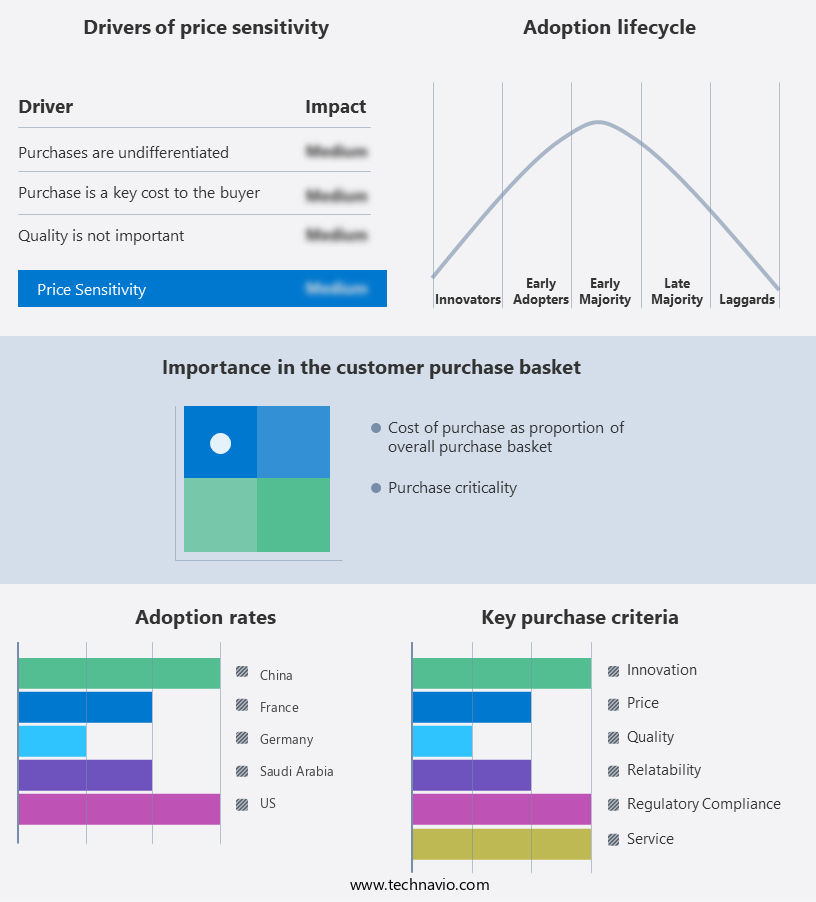
    The plastic additives market forecasting report includes the adoption lifecycle of the market, covering from the innovator’s stage to the laggard’s stage. It focuses on adoption rates in different regions based on penetration. Furthermore, the plastic additives market report also includes key purchase criteria and drivers of price sensitivity to help companies evaluate and develop their market growth analysis strategies.

    Plastic Additives Market Share by Geography

     Customer Landscape of Plastic Additives Industry

    Key Companies & Market Insights

    Companies are implementing various strategies, such as strategic alliances, plastic additives market forecast, partnerships, mergers and acquisitions, geographical expansion, and product/service launches, to enhance their presence in the industry.

    Adeka Corporation - This company specializes in the development and distribution of innovative sports products, leveraging advanced technology and materials to enhance athlete performance and consumer experience. Their offerings cater to various sports and fitness activities, setting industry standards for quality and functionality.

    The industry research and growth report includes detailed analyses of the competitive landscape of the market and information about key companies, including:

    • Adeka Corporation
    • Albemarle Corporation
    • Arkema S.A.
    • BASF SE
    • Clariant AG
    • Dow Inc.
    • Eastman Chemical Company
    • Evonik Industries
    • ExxonMobil Chemical
    • Kaneka Corporation
    • LANXESS
    • Milliken & Company
    • Nouryon
    • PolyOne Corporation
    • SABIC
    • Songwon Industrial
    • Sumitomo Chemical
    • Tosoh Corporation
    • Tramaco GmbH
    • Valtris Specialty Chemicals

    Qualitative and quantitative analysis of companies has been conducted to help clients understand the wider business environment as well as the strengths and weaknesses of key industry players. Data is qualitatively analyzed to categorize companies as pure play, category-focused, industry-focused, and diversified; it is quantitatively analyzed to categorize companies as dominant, leading, strong, tentative, and weak.

    Recent Development and News in Plastic Additives Market

    • In January 2024, BASF SE, a leading global chemical producer, announced the launch of its new plastic additive, Hexamid A 1263, designed to enhance the properties of polyethylene terephthalate (PET) bottles for food packaging (BASF press release, 2024). This innovative additive contributes to improving the barrier properties of PET bottles, ensuring better protection against light and oxygen, thereby extending the shelf life of food products.
    • In March 2024, Covestro AG and Sabic entered into a strategic collaboration to jointly develop and commercialize new polycarbonate (PC) and polyester polyol (PPO) additives. This partnership aimed to strengthen their market position and expand their product offerings, catering to the growing demand for sustainable and high-performance plastics (Covestro press release, 2024).
    • In May 2024, SABIC and LG Chem announced a merger of their petrochemicals businesses, creating a new entity called SABIC-LG Chemicals. This merger aimed to create a global leader in the production of ethylene and propylene derivatives, including plastic additives, with a combined capacity of over 12 million tons per year (SABIC press release, 2024).
    • In April 2025, the European Union (EU) approved the use of biodegradable plastic additives derived from renewable resources for food packaging applications. This regulatory approval marked a significant milestone in the market, paving the way for the adoption of eco-friendly solutions and reducing the environmental impact of plastic waste (European Commission press release, 2025).

    Research Analyst Overview

    • The market encompasses a wide array of substances that enhance the properties of polymers for various applications. These additives include color concentrates, flame retardants, anti-blocking agents, flexural modulus enhancers, uv absorbers, lldpe additives, light stabilizers, and antioxidants. Color concentrates, for instance, are essential in the plastic industry for producing colorful products. They are made by dispersing pigments or dyes in a polymer matrix, which facilitates easier handling and more consistent color results. Flame retardants, on the other hand, are crucial in ensuring the safety of plastic products by reducing their flammability. Anti-blocking agents are added to prevent the adhesion of polymer particles during processing, ensuring smooth production and reducing downtime.
    • Flexural modulus enhancers, such as lldpe additives, improve the stiffness and strength of plastics, making them suitable for applications requiring high rigidity. Uv absorbers and light stabilizers are essential for protecting plastics from degradation caused by sunlight. Antioxidants for plastics, meanwhile, prevent oxidation and extend the lifespan of plastic products. According to a recent industry report, The market is projected to grow at a steady rate of 5% annually, driven by increasing demand for plastics in various sectors, including automotive, construction, packaging, and electronics. For example, the use of lldpe additives in the automotive industry has seen significant growth due to their ability to enhance fuel efficiency and reduce emissions.
    • Incorporating these additives into polymers requires careful processing, as some additives can migrate or interact with other components, leading to potential issues such as polymer degradation. Proper compounding techniques, such as polymer compounding and rheology modification, are essential to ensure optimal performance and compatibility. The market is a dynamic and evolving field, with ongoing research and development focused on creating new additives and improving existing ones to meet the demands of various industries.

    Dive into Technavio’s robust research methodology, blending expert interviews, extensive data synthesis, and validated models for unparalleled Plastic Additives Market insights. See full methodology.

    Market Scope

    Report Coverage

    Details

    Page number

    189

    Base year

    2023

    Historic period

    2018-2022

    Forecast period

    2024-2028

    Growth momentum & CAGR

    Accelerate at a CAGR of 6.69%

    Market growth 2024-2028

    USD 21.9 billion

    Market structure

    Fragmented

    YoY growth 2023-2024(%)

    6.11

    Key countries

    US, Canada, Germany, UK, Italy, France, China, India, Japan, Brazil, Egypt, UAE, Oman, Argentina, KSA, UAE, Brazil, and Rest of World (ROW)

    Competitive landscape

    Leading Companies, Market Positioning of Companies, Competitive Strategies, and Industry Risks

    Request Free Sample

    What are the Key Data Covered in this Plastic Additives Market Research and Growth Report?

    • CAGR of the Plastic Additives industry during the forecast period
    • Detailed information on factors that will drive the growth and forecasting between 2024 and 2028
    • Precise estimation of the size of the market and its contribution of the industry in focus to the parent market
    • Accurate predictions about upcoming growth and trends and changes in consumer behaviour
    • Growth of the market across APAC, North America, Europe, South America, and Middle East and Africa
    • Thorough analysis of the market’s competitive landscape and detailed information about companies
    • Comprehensive analysis of factors that will challenge the plastic additives market growth of industry companies

    We can help! Our analysts can customize this plastic additives market research report to meet your requirements.

    Get in touch

    1 Executive Summary

    • 1.1 Market overview
      • Executive Summary - Chart on Market Overview
      • Executive Summary - Data Table on Market Overview
      • Executive Summary - Chart on Global Market Characteristics
      • Executive Summary - Chart on Market by Geography
      • Executive Summary - Chart on Market Segmentation by Type
      • Executive Summary - Chart on Market Segmentation by Application
      • Executive Summary - Chart on Incremental Growth
      • Executive Summary - Data Table on Incremental Growth
      • Executive Summary - Chart on Company Market Positioning

    2 Market Landscape

    • 2.1 Market ecosystem
      • Parent Market
      • Data Table on - Parent Market
    • 2.2 Market characteristics
      • Market characteristics analysis
    • 2.3 Value chain analysis
      • Value Chain Analysis

    3 Market Sizing

    • 3.1 Market definition
      • Offerings of companies included in the market definition
    • 3.2 Market segment analysis
      • Market segments
    • 3.3 Market size 2023
      • 3.4 Market outlook: Forecast for 2023-2028
        • Chart on Global - Market size and forecast 2023-2028 ($ billion)
        • Data Table on Global - Market size and forecast 2023-2028 ($ billion)
        • Chart on Global Market: Year-over-year growth 2023-2028 (%)
        • Data Table on Global Market: Year-over-year growth 2023-2028 (%)

      4 Historic Market Size

      • 4.1 Global Plastic Additives Market 2018 - 2022
        • Historic Market Size - Data Table on Global Plastic Additives Market 2018 - 2022 ($ billion)
      • 4.2 Type segment analysis 2018 - 2022
        • Historic Market Size - Type Segment 2018 - 2022 ($ billion)
      • 4.3 Application segment analysis 2018 - 2022
        • Historic Market Size - Application Segment 2018 - 2022 ($ billion)
      • 4.4 Geography segment analysis 2018 - 2022
        • Historic Market Size - Geography Segment 2018 - 2022 ($ billion)
      • 4.5 Country segment analysis 2018 - 2022
        • Historic Market Size - Country Segment 2018 - 2022 ($ billion)

      5 Five Forces Analysis

      • 5.1 Five forces summary
        • Five forces analysis - Comparison between 2023 and 2028
      • 5.2 Bargaining power of buyers
        • Bargaining power of buyers - Impact of key factors 2023 and 2028
      • 5.3 Bargaining power of suppliers
        • Bargaining power of suppliers - Impact of key factors in 2023 and 2028
      • 5.4 Threat of new entrants
        • Threat of new entrants - Impact of key factors in 2023 and 2028
      • 5.5 Threat of substitutes
        • Threat of substitutes - Impact of key factors in 2023 and 2028
      • 5.6 Threat of rivalry
        • Threat of rivalry - Impact of key factors in 2023 and 2028
      • 5.7 Market condition
        • Chart on Market condition - Five forces 2023 and 2028

      6 Market Segmentation by Type

      • 6.1 Market segments
        • Chart on Type - Market share (2023-2028) (%)
        • Data Table on Type - Market share (2023-2028) (%)
      • 6.2 Comparison by Type
        • Chart on Comparison by Type
        • Data Table on Comparison by Type
      • 6.3 Modifier - Market size and forecast (2023-2028)
        • Chart on Modifier - Market size and forecast (2023-2028) ($ billion)
        • Data Table on Modifier - Market size and forecast (2023-2028) ($ billion)
        • Chart on Modifier - Year-over-year growth (2023-2028) (%)
        • Data Table on Modifier - Year-over-year growth (2023-2028) (%)
      • 6.4 Stabilizers - Market size and forecast (2023-2028)
        • Chart on Stabilizers - Market size and forecast (2023-2028) ($ billion)
        • Data Table on Stabilizers - Market size and forecast (2023-2028) ($ billion)
        • Chart on Stabilizers - Year-over-year growth (2023-2028) (%)
        • Data Table on Stabilizers - Year-over-year growth (2023-2028) (%)
      • 6.5 Extenders - Market size and forecast (2023-2028)
        • Chart on Extenders - Market size and forecast (2023-2028) ($ billion)
        • Data Table on Extenders - Market size and forecast (2023-2028) ($ billion)
        • Chart on Extenders - Year-over-year growth (2023-2028) (%)
        • Data Table on Extenders - Year-over-year growth (2023-2028) (%)
      • 6.6 Processing aids - Market size and forecast (2023-2028)
        • Chart on Processing aids - Market size and forecast (2023-2028) ($ billion)
        • Data Table on Processing aids - Market size and forecast (2023-2028) ($ billion)
        • Chart on Processing aids - Year-over-year growth (2023-2028) (%)
        • Data Table on Processing aids - Year-over-year growth (2023-2028) (%)
      • 6.7 Market opportunity by Type
        • Market opportunity by Type ($ billion)
        • Data Table on Market opportunity by Type ($ billion)

      7 Market Segmentation by Application

      • 7.1 Market segments
        • Chart on Application - Market share (2023-2028) (%)
        • Data Table on Application - Market share (2023-2028) (%)
      • 7.2 Comparison by Application
        • Chart on Comparison by Application
        • Data Table on Comparison by Application
      • 7.3 Packaging - Market size and forecast (2023-2028)
        • Chart on Packaging - Market size and forecast (2023-2028) ($ billion)
        • Data Table on Packaging - Market size and forecast (2023-2028) ($ billion)
        • Chart on Packaging - Year-over-year growth (2023-2028) (%)
        • Data Table on Packaging - Year-over-year growth (2023-2028) (%)
      • 7.4 Consumer goods - Market size and forecast (2023-2028)
        • Chart on Consumer goods - Market size and forecast (2023-2028) ($ billion)
        • Data Table on Consumer goods - Market size and forecast (2023-2028) ($ billion)
        • Chart on Consumer goods - Year-over-year growth (2023-2028) (%)
        • Data Table on Consumer goods - Year-over-year growth (2023-2028) (%)
      • 7.5 Automotive - Market size and forecast (2023-2028)
        • Chart on Automotive - Market size and forecast (2023-2028) ($ billion)
        • Data Table on Automotive - Market size and forecast (2023-2028) ($ billion)
        • Chart on Automotive - Year-over-year growth (2023-2028) (%)
        • Data Table on Automotive - Year-over-year growth (2023-2028) (%)
      • 7.6 Electrical and electronics - Market size and forecast (2023-2028)
        • Chart on Electrical and electronics - Market size and forecast (2023-2028) ($ billion)
        • Data Table on Electrical and electronics - Market size and forecast (2023-2028) ($ billion)
        • Chart on Electrical and electronics - Year-over-year growth (2023-2028) (%)
        • Data Table on Electrical and electronics - Year-over-year growth (2023-2028) (%)
      • 7.7 Others - Market size and forecast (2023-2028)
        • Chart on Others - Market size and forecast (2023-2028) ($ billion)
        • Data Table on Others - Market size and forecast (2023-2028) ($ billion)
        • Chart on Others - Year-over-year growth (2023-2028) (%)
        • Data Table on Others - Year-over-year growth (2023-2028) (%)
      • 7.8 Market opportunity by Application
        • Market opportunity by Application ($ billion)
        • Data Table on Market opportunity by Application ($ billion)

      8 Market Segmentation by End-User

      • 8.1 Market segments
        • Chart on End-User - Market share (2023-2028) (%)
        • Data Table on End-User - Market share (2023-2028) (%)
      • 8.2 Comparison by End-User
        • Chart on Comparison by End-User
        • Data Table on Comparison by End-User
      • 8.3 Industrial - Market size and forecast (2023-2028)
        • Chart on Industrial - Market size and forecast (2023-2028) ($ billion)
        • Data Table on Industrial - Market size and forecast (2023-2028) ($ billion)
        • Chart on Industrial - Year-over-year growth (2023-2028) (%)
        • Data Table on Industrial - Year-over-year growth (2023-2028) (%)
      • 8.4 Commercial - Market size and forecast (2023-2028)
        • Chart on Commercial - Market size and forecast (2023-2028) ($ billion)
        • Data Table on Commercial - Market size and forecast (2023-2028) ($ billion)
        • Chart on Commercial - Year-over-year growth (2023-2028) (%)
        • Data Table on Commercial - Year-over-year growth (2023-2028) (%)
      • 8.5 Residential - Market size and forecast (2023-2028)
        • Chart on Residential - Market size and forecast (2023-2028) ($ billion)
        • Data Table on Residential - Market size and forecast (2023-2028) ($ billion)
        • Chart on Residential - Year-over-year growth (2023-2028) (%)
        • Data Table on Residential - Year-over-year growth (2023-2028) (%)
      • 8.6 Market opportunity by End-User
        • Market opportunity by End-User ($ billion)
        • Data Table on Market opportunity by End-User ($ billion)

      9 Customer Landscape

      • 9.1 Customer landscape overview
        • Analysis of price sensitivity, lifecycle, customer purchase basket, adoption rates, and purchase criteria

      10 Geographic Landscape

      • 10.1 Geographic segmentation
        • Chart on Market share by geography 2023-2028 (%)
        • Data Table on Market share by geography 2023-2028 (%)
      • 10.2 Geographic comparison
        • Chart on Geographic comparison
        • Data Table on Geographic comparison
      • 10.3 APAC - Market size and forecast 2023-2028
        • Chart on APAC - Market size and forecast 2023-2028 ($ billion)
        • Data Table on APAC - Market size and forecast 2023-2028 ($ billion)
        • Chart on APAC - Year-over-year growth 2023-2028 (%)
        • Data Table on APAC - Year-over-year growth 2023-2028 (%)
      • 10.4 North America - Market size and forecast 2023-2028
        • Chart on North America - Market size and forecast 2023-2028 ($ billion)
        • Data Table on North America - Market size and forecast 2023-2028 ($ billion)
        • Chart on North America - Year-over-year growth 2023-2028 (%)
        • Data Table on North America - Year-over-year growth 2023-2028 (%)
      • 10.5 Europe - Market size and forecast 2023-2028
        • Chart on Europe - Market size and forecast 2023-2028 ($ billion)
        • Data Table on Europe - Market size and forecast 2023-2028 ($ billion)
        • Chart on Europe - Year-over-year growth 2023-2028 (%)
        • Data Table on Europe - Year-over-year growth 2023-2028 (%)
      • 10.6 South America - Market size and forecast 2023-2028
        • Chart on South America - Market size and forecast 2023-2028 ($ billion)
        • Data Table on South America - Market size and forecast 2023-2028 ($ billion)
        • Chart on South America - Year-over-year growth 2023-2028 (%)
        • Data Table on South America - Year-over-year growth 2023-2028 (%)
      • 10.7 Middle East and Africa - Market size and forecast 2023-2028
        • Chart on Middle East and Africa - Market size and forecast 2023-2028 ($ billion)
        • Data Table on Middle East and Africa - Market size and forecast 2023-2028 ($ billion)
        • Chart on Middle East and Africa - Year-over-year growth 2023-2028 (%)
        • Data Table on Middle East and Africa - Year-over-year growth 2023-2028 (%)
      • 10.8 China - Market size and forecast 2023-2028
        • Chart on China - Market size and forecast 2023-2028 ($ billion)
        • Data Table on China - Market size and forecast 2023-2028 ($ billion)
        • Chart on China - Year-over-year growth 2023-2028 (%)
        • Data Table on China - Year-over-year growth 2023-2028 (%)
      • 10.9 US - Market size and forecast 2023-2028
        • Chart on US - Market size and forecast 2023-2028 ($ billion)
        • Data Table on US - Market size and forecast 2023-2028 ($ billion)
        • Chart on US - Year-over-year growth 2023-2028 (%)
        • Data Table on US - Year-over-year growth 2023-2028 (%)
      • 10.10 Germany - Market size and forecast 2023-2028
        • Chart on Germany - Market size and forecast 2023-2028 ($ billion)
        • Data Table on Germany - Market size and forecast 2023-2028 ($ billion)
        • Chart on Germany - Year-over-year growth 2023-2028 (%)
        • Data Table on Germany - Year-over-year growth 2023-2028 (%)
      • 10.11 France - Market size and forecast 2023-2028
        • Chart on France - Market size and forecast 2023-2028 ($ billion)
        • Data Table on France - Market size and forecast 2023-2028 ($ billion)
        • Chart on France - Year-over-year growth 2023-2028 (%)
        • Data Table on France - Year-over-year growth 2023-2028 (%)
      • 10.12 Saudi Arabia - Market size and forecast 2023-2028
        • Chart on Saudi Arabia - Market size and forecast 2023-2028 ($ billion)
        • Data Table on Saudi Arabia - Market size and forecast 2023-2028 ($ billion)
        • Chart on Saudi Arabia - Year-over-year growth 2023-2028 (%)
        • Data Table on Saudi Arabia - Year-over-year growth 2023-2028 (%)
      • 10.13 Market opportunity by geography
        • Market opportunity by geography ($ billion)
        • Data Tables on Market opportunity by geography ($ billion)
      • 10.14 Canada - Market size and forecast (2023-2028)
        • Chart on Canada - Market size and forecast (2023-2028) ($ billion)
        • Data Table on Canada - Market size and forecast (2023-2028) ($ billion)
        • Chart on Canada - Year-over-year growth (2023-2028) (%)
        • Data Table on Canada - Year-over-year growth (2023-2028) (%)
      • 10.15 UK - Market size and forecast (2023-2028)
        • Chart on UK - Market size and forecast (2023-2028) ($ billion)
        • Data Table on UK - Market size and forecast (2023-2028) ($ billion)
        • Chart on UK - Year-over-year growth (2023-2028) (%)
        • Data Table on UK - Year-over-year growth (2023-2028) (%)
      • 10.16 Italy - Market size and forecast (2023-2028)
        • Chart on Italy - Market size and forecast (2023-2028) ($ billion)
        • Data Table on Italy - Market size and forecast (2023-2028) ($ billion)
        • Chart on Italy - Year-over-year growth (2023-2028) (%)
        • Data Table on Italy - Year-over-year growth (2023-2028) (%)
      • 10.17 India - Market size and forecast (2023-2028)
        • Chart on India - Market size and forecast (2023-2028) ($ billion)
        • Data Table on India - Market size and forecast (2023-2028) ($ billion)
        • Chart on India - Year-over-year growth (2023-2028) (%)
        • Data Table on India - Year-over-year growth (2023-2028) (%)
      • 10.18 Japan - Market size and forecast (2023-2028)
        • Chart on Japan - Market size and forecast (2023-2028) ($ billion)
        • Data Table on Japan - Market size and forecast (2023-2028) ($ billion)
        • Chart on Japan - Year-over-year growth (2023-2028) (%)
        • Data Table on Japan - Year-over-year growth (2023-2028) (%)
      • 10.19 Brazil - Market size and forecast (2023-2028)
        • Chart on Brazil - Market size and forecast (2023-2028) ($ billion)
        • Data Table on Brazil - Market size and forecast (2023-2028) ($ billion)
        • Chart on Brazil - Year-over-year growth (2023-2028) (%)
        • Data Table on Brazil - Year-over-year growth (2023-2028) (%)
      • 10.20 Egypt - Market size and forecast (2023-2028)
        • Chart on Egypt - Market size and forecast (2023-2028) ($ billion)
        • Data Table on Egypt - Market size and forecast (2023-2028) ($ billion)
        • Chart on Egypt - Year-over-year growth (2023-2028) (%)
        • Data Table on Egypt - Year-over-year growth (2023-2028) (%)
      • 10.21 UAE - Market size and forecast (2023-2028)
        • Chart on UAE - Market size and forecast (2023-2028) ($ billion)
        • Data Table on UAE - Market size and forecast (2023-2028) ($ billion)
        • Chart on UAE - Year-over-year growth (2023-2028) (%)
        • Data Table on UAE - Year-over-year growth (2023-2028) (%)
      • 10.22 Oman - Market size and forecast (2023-2028)
        • Chart on Oman - Market size and forecast (2023-2028) ($ billion)
        • Data Table on Oman - Market size and forecast (2023-2028) ($ billion)
        • Chart on Oman - Year-over-year growth (2023-2028) (%)
        • Data Table on Oman - Year-over-year growth (2023-2028) (%)
      • 10.23 Argentina - Market size and forecast (2023-2028)
        • Chart on Argentina - Market size and forecast (2023-2028) ($ billion)
        • Data Table on Argentina - Market size and forecast (2023-2028) ($ billion)
        • Chart on Argentina - Year-over-year growth (2023-2028) (%)
        • Data Table on Argentina - Year-over-year growth (2023-2028) (%)
      • 10.24 KSA - Market size and forecast (2023-2028)
        • Chart on KSA - Market size and forecast (2023-2028) ($ billion)
        • Data Table on KSA - Market size and forecast (2023-2028) ($ billion)
        • Chart on KSA - Year-over-year growth (2023-2028) (%)
        • Data Table on KSA - Year-over-year growth (2023-2028) (%)
      • 10.25 UAE - Market size and forecast (2023-2028)
        • Chart on UAE - Market size and forecast (2023-2028) ($ billion)
        • Data Table on UAE - Market size and forecast (2023-2028) ($ billion)
        • Chart on UAE - Year-over-year growth (2023-2028) (%)
        • Data Table on UAE - Year-over-year growth (2023-2028) (%)
      • 10.26 Brazil - Market size and forecast (2023-2028)
        • Chart on Brazil - Market size and forecast (2023-2028) ($ billion)
        • Data Table on Brazil - Market size and forecast (2023-2028) ($ billion)
        • Chart on Brazil - Year-over-year growth (2023-2028) (%)
        • Data Table on Brazil - Year-over-year growth (2023-2028) (%)
      • 10.27 Rest of World (ROW) - Market size and forecast (2023-2028)
        • Chart on Rest of World (ROW) - Market size and forecast (2023-2028) ($ billion)
        • Data Table on Rest of World (ROW) - Market size and forecast (2023-2028) ($ billion)
        • Chart on Rest of World (ROW) - Year-over-year growth (2023-2028) (%)
        • Data Table on Rest of World (ROW) - Year-over-year growth (2023-2028) (%)

      11 Drivers, Challenges, and Opportunity/Restraints

      • 11.1 Market drivers
        • 11.2 Market challenges
          • 11.3 Impact of drivers and challenges
            • Impact of drivers and challenges in 2023 and 2028
          • 11.4 Market opportunities/restraints

            12 Competitive Landscape

            • 12.1 Overview
              • 12.2 Competitive Landscape
                • Overview on criticality of inputs and factors of differentiation
              • 12.3 Landscape disruption
                • Overview on factors of disruption
              • 12.4 Industry risks
                • Impact of key risks on business

              13 Competitive Analysis

              • 13.1 Companies profiled
                • Companies covered
              • 13.2 Market positioning of companies
                • Matrix on companies position and classification
              • 13.3 Adeka Corporation
                • Adeka Corporation - Overview
                • Adeka Corporation - Product / Service
                • Adeka Corporation - Key offerings
              • 13.4 Albemarle Corporation
                • Albemarle Corporation - Overview
                • Albemarle Corporation - Product / Service
                • Albemarle Corporation - Key offerings
              • 13.5 Arkema S.A.
                • Arkema S.A. - Overview
                • Arkema S.A. - Product / Service
                • Arkema S.A. - Key offerings
              • 13.6 BASF SE
                • BASF SE - Overview
                • BASF SE - Product / Service
                • BASF SE - Key offerings
              • 13.7 Clariant AG
                • Clariant AG - Overview
                • Clariant AG - Product / Service
                • Clariant AG - Key offerings
              • 13.8 Dow Inc.
                • Dow Inc. - Overview
                • Dow Inc. - Product / Service
                • Dow Inc. - Key offerings
              • 13.9 Eastman Chemical Company
                • Eastman Chemical Company - Overview
                • Eastman Chemical Company - Product / Service
                • Eastman Chemical Company - Key offerings
              • 13.10 Evonik Industries
                • Evonik Industries - Overview
                • Evonik Industries - Product / Service
                • Evonik Industries - Key offerings
              • 13.11 ExxonMobil Chemical
                • ExxonMobil Chemical - Overview
                • ExxonMobil Chemical - Product / Service
                • ExxonMobil Chemical - Key offerings
              • 13.12 Kaneka Corporation
                • Kaneka Corporation - Overview
                • Kaneka Corporation - Product / Service
                • Kaneka Corporation - Key offerings
              • 13.13 LANXESS
                • LANXESS - Overview
                • LANXESS - Product / Service
                • LANXESS - Key offerings
              • 13.14 Milliken & Company
                • Milliken & Company - Overview
                • Milliken & Company - Product / Service
                • Milliken & Company - Key offerings
              • 13.15 Nouryon
                • Nouryon - Overview
                • Nouryon - Product / Service
                • Nouryon - Key offerings
              • 13.16 PolyOne Corporation
                • PolyOne Corporation - Overview
                • PolyOne Corporation - Product / Service
                • PolyOne Corporation - Key offerings
              • 13.17 SABIC
                • SABIC - Overview
                • SABIC - Product / Service
                • SABIC - Key offerings
              • 13.18 Songwon Industrial
                • Songwon Industrial - Overview
                • Songwon Industrial - Product / Service
                • Songwon Industrial - Key offerings
              • 13.19 Sumitomo Chemical
                • Sumitomo Chemical - Overview
                • Sumitomo Chemical - Product / Service
                • Sumitomo Chemical - Key offerings
              • 13.20 Tosoh Corporation
                • Tosoh Corporation - Overview
                • Tosoh Corporation - Product / Service
                • Tosoh Corporation - Key offerings
              • 13.21 Tramaco GmbH
                • Tramaco GmbH - Overview
                • Tramaco GmbH - Product / Service
                • Tramaco GmbH - Key offerings
              • 13.22 Valtris Specialty Chemicals
                • Valtris Specialty Chemicals - Overview
                • Valtris Specialty Chemicals - Product / Service
                • Valtris Specialty Chemicals - Key offerings
              • 13.23 ADEKA Corp.
                • ADEKA Corp. - Overview
                • ADEKA Corp. - Product / Service
                • ADEKA Corp. - Key offerings
              • 13.24 Albemarle Corp.
                • Albemarle Corp. - Overview
                • Albemarle Corp. - Product / Service
                • Albemarle Corp. - Key offerings
              • 13.25 Avient Corp.
                • Avient Corp. - Overview
                • Avient Corp. - Product / Service
                • Avient Corp. - Key offerings
              • 13.26 Baerlocher GmbH
                • Baerlocher GmbH - Overview
                • Baerlocher GmbH - Product / Service
                • Baerlocher GmbH - Key offerings
              • 13.27 BASF SE
                • BASF SE - Overview
                • BASF SE - Product / Service
                • BASF SE - Key offerings
              • 13.28 Clariant International Ltd.
                • Clariant International Ltd. - Overview
                • Clariant International Ltd. - Product / Service
                • Clariant International Ltd. - Key offerings
              • 13.29 Covestro AG
                • Covestro AG - Overview
                • Covestro AG - Product / Service
                • Covestro AG - Key offerings
              • 13.30 Dow Chemical Co.
                • Dow Chemical Co. - Overview
                • Dow Chemical Co. - Product / Service
                • Dow Chemical Co. - Key offerings
              • 13.31 Evonik Industries AG
                • Evonik Industries AG - Overview
                • Evonik Industries AG - Product / Service
                • Evonik Industries AG - Key offerings
              • 13.32 Exxon Mobil Corp.
                • Exxon Mobil Corp. - Overview
                • Exxon Mobil Corp. - Product / Service
                • Exxon Mobil Corp. - Key offerings
              • 13.33 Grafe Advanced Polymers GmbH
                • Grafe Advanced Polymers GmbH - Overview
                • Grafe Advanced Polymers GmbH - Product / Service
                • Grafe Advanced Polymers GmbH - Key offerings
              • 13.34 Kaneka Corp.
                • Kaneka Corp. - Overview
                • Kaneka Corp. - Product / Service
                • Kaneka Corp. - Key offerings
              • 13.35 Lanxess AG
                • Lanxess AG - Overview
                • Lanxess AG - Product / Service
                • Lanxess AG - Key offerings
              • 13.36 Milliken and Co.
                • Milliken and Co. - Overview
                • Milliken and Co. - Product / Service
                • Milliken and Co. - Key offerings
              • 13.37 Mitsui Chemicals Inc.
                • Mitsui Chemicals Inc. - Overview
                • Mitsui Chemicals Inc. - Product / Service
                • Mitsui Chemicals Inc. - Key offerings
              • 13.38 Nouryon Chemicals Holding BV
                • Nouryon Chemicals Holding BV - Overview
                • Nouryon Chemicals Holding BV - Product / Service
                • Nouryon Chemicals Holding BV - Key offerings
              • 13.39 PMC Group Inc.
                • PMC Group Inc. - Overview
                • PMC Group Inc. - Product / Service
                • PMC Group Inc. - Key offerings
              • 13.40 Sabo Spa
                • Sabo Spa - Overview
                • Sabo Spa - Product / Service
                • Sabo Spa - Key offerings
              • 13.41 Sakai Chemical Industry Co. Ltd.
                • Sakai Chemical Industry Co. Ltd. - Overview
                • Sakai Chemical Industry Co. Ltd. - Product / Service
                • Sakai Chemical Industry Co. Ltd. - Key offerings
              • 13.42 Songwon Industrial Co. Ltd.
                • Songwon Industrial Co. Ltd. - Overview
                • Songwon Industrial Co. Ltd. - Product / Service
                • Songwon Industrial Co. Ltd. - Key offerings

              14 Appendix

              • 14.1 Scope of the report
                • 14.2 Inclusions and exclusions checklist
                  • Inclusions checklist
                  • Exclusions checklist
                • 14.3 Currency conversion rates for US$
                  • Currency conversion rates for US$
                • 14.4 Research methodology
                  • Research methodology
                • 14.5 Data procurement
                  • Information sources
                • 14.6 Data validation
                  • Data validation
                • 14.7 Validation techniques employed for market sizing
                  • Validation techniques employed for market sizing
                • 14.8 Data synthesis
                  • Data synthesis
                • 14.9 360 degree market analysis
                  • 360 degree market analysis
                • 14.10 List of abbreviations
                  • List of abbreviations

                Research Methodology

                Technavio presents a detailed picture of the market by way of study, synthesis, and summation of data from multiple sources. The analysts have presented the various facets of the market with a particular focus on identifying the key industry influencers. The data thus presented is comprehensive, reliable, and the result of extensive research, both primary and secondary.

                INFORMATION SOURCES

                Primary sources

                • Manufacturers and suppliers
                • Channel partners
                • Industry experts
                • Strategic decision makers

                Secondary sources

                • Industry journals and periodicals
                • Government data
                • Financial reports of key industry players
                • Historical data
                • Press releases

                DATA ANALYSIS

                Data Synthesis

                • Collation of data
                • Estimation of key figures
                • Analysis of derived insights

                Data Validation

                • Triangulation with data models
                • Reference against proprietary databases
                • Corroboration with industry experts

                REPORT WRITING

                Qualitative

                • Market drivers
                • Market challenges
                • Market trends
                • Five forces analysis

                Quantitative

                • Market size and forecast
                • Market segmentation
                • Geographical insights
                • Competitive landscape

                Interested in this report?

                Get your sample now to see our research methodology and insights!

                Download Now

                Frequently Asked Questions

                Plastic Additives market growth will increase by $ 21.9 bn during 2024-2028 .

                The Plastic Additives market is expected to grow at a CAGR of 6.69% during 2024-2028 .

                Plastic Additives market is segmented by Type( Modifier, Stabilizers, Extenders, Processing aids) Application( Packaging, Consumer goods, Automotive, Electrical and electronics, Others)

                Adeka Corporation, Albemarle Corporation, Arkema S.A., BASF SE, Clariant AG, Dow Inc., Eastman Chemical Company, Evonik Industries, ExxonMobil Chemical, Kaneka Corporation, LANXESS, Milliken & Company, Nouryon, PolyOne Corporation, SABIC, Songwon Industrial, Sumitomo Chemical, Tosoh Corporation, Tramaco GmbH, Valtris Specialty Chemicals are a few of the key vendors in the Plastic Additives market.

                APAC will register the highest growth rate of 41% among the other regions. Therefore, the Plastic Additives market in APAC is expected to garner significant business opportunities for the vendors during the forecast period.

                US, Canada, Germany, UK, Italy, France, China, India, Japan, Brazil, Egypt, UAE, Oman, Argentina, KSA, UAE, Brazil, Rest of World (ROW)

                • Increasing demand for recycled plastics from packaging industryMany industries are adopting green and sustainable solutions owing to the increase in awareness about healthy living. This has led to a rise in demand for recycled plastics is the driving factor this market.
                • which is driving the plastic additives market across the world. The packaging industry uses recycled plastics in large volumes. The industry is shifting toward the use of recycled plastics is the driving factor this market.
                • with a growing number of consumers that are conscious about environmental protection norms.In the packaging industry is the driving factor this market.
                • recycled plastics are used in a wide range of applications is the driving factor this market.
                • such as the manufacturing of US Food and Drug Administration (FDA)-approved food packaging is the driving factor this market.
                • plastic containers is the driving factor this market.
                • bottles is the driving factor this market.
                • closures is the driving factor this market.
                • jars is the driving factor this market.
                • engineered pumps is the driving factor this market.
                • sprayers is the driving factor this market.
                • and caps. Recycled plastics offer new possibilities for reducing waste is the driving factor this market.
                • lowering energy consumption and carbon emissions is the driving factor this market.
                • and decreasing water consumption to achieve high quality and performance. Recycled plastics are also used in increasing shelf life and offering product protection. Thus is the driving factor this market.
                • with an increase in the adoption of green options for various applications is the driving factor this market.
                • the global recycled plastics market is expected to grow. This would drive the consumption of plastic additives in recycled plastics at a significant pace during the forecast period. is the driving factor this market.

                The Plastic Additives market vendors should focus on grabbing business opportunities from the Modifier segment as it accounted for the largest market share in the base year.