Specialty Insurance Market Analysis Europe, North America, APAC, South America, Middle East and Africa - US, China, Japan, Germany, France - Size and Forecast 2024-2028

Specialty Insurance Market Analysis Europe, North America, APAC, South America, Middle East and Africa - US, China, Japan, Germany, France - Size and Forecast 2024-2028

Published: Apr 2024 162 Pages SKU: IRTNTR77791

Market Overview at a Glance

$57.25 B
Market Opportunity
10.36%
CAGR
10.26
YoY growth 2023-2024(%)

Specialty Insurance Market Size 2024-2028 

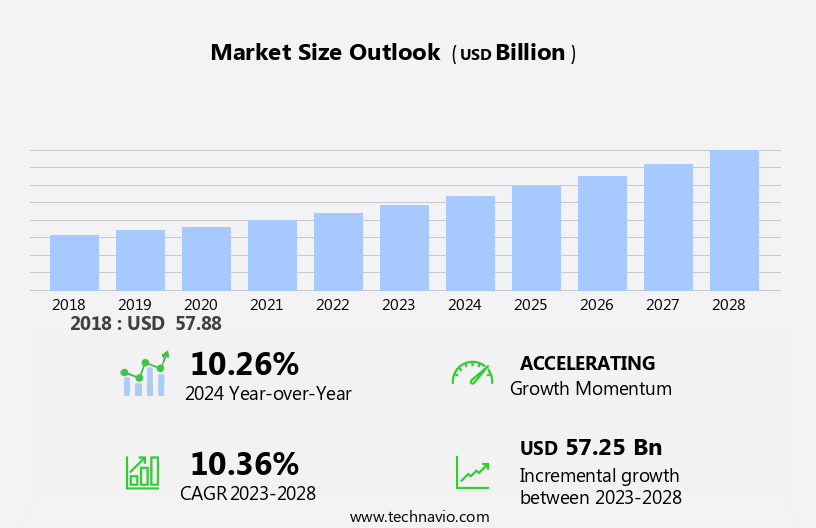
The specialty insurance market size is forecast to increase by USD 57.25 billion at a CAGR of 10.36% between 2023 and 2028.

  • The market is experiencing significant growth due to several key drivers. The increasing globalization and interconnectedness of businesses are leading to a higher demand for specialized risk coverage. Moreover, there is an upward trend in collaboration among specialty insurers to offer comprehensive risk management solutions. However, the market also faces challenges related to cyberattacks through the digital technologies used for underwriting and claims processing.
  • As businesses continue to digitize their operations, the risk of cyber threats becomes more pronounced. Artificial intelligence, data analytics, and digital services platforms are transforming the insurance industry, enabling customized underwriting, risk assessment, claims processing, and policy management.  Therefore, insurers must invest in strong cybersecurity measures to mitigate these risks and maintain customer trust. Overall, the market is expected to witness steady growth in the coming years, driven by these factors and the evolving risk landscape.

What will be the Specialty Insurance Market  Size During the Forecast Period?

Specialty Insurance Market Size

 Request Free Sample

  • Specialty insurance caters to the unique and complex risk management needs of various industries and businesses. Negligence claims, judgment and legal fees, are just some of the risks that standard insurance policies may not cover adequately. Specialty insurers offer customized solutions for businesses in the environmental industry, technology sector, aviation, marine, fine art, terrorism, and other non-standard risks. Technology integration, such as blockchain, is transforming the market. This innovation streamlines claims processing, enhances policy management, and improves customer experiences. Cyber liability is a significant concern for businesses in today's digital age, and specialty insurers provide coverage for data breaches and other cyber threats.
  • Moreover, evolving regulations and the pricing of policies are essential factors in the market. Specialty insurers employ risk mitigation strategies to help businesses navigate these challenges. Data analytics tools enable insurers to assess risks more accurately and offer tailored solutions. The aviation and marine industries present unique risks that require specialized insurance products. Fine art, for instance, necessitates coverage for theft, damage, and loss. Terrorism risks require comprehensive insurance solutions to protect businesses from potential attacks. Specialty insurers offer a range of conventional plans with flexible policy terms to cater to diverse business needs. Their expertise in handling complex risks and claims processing sets them apart from traditional insurers. By focusing on the specific needs of industries and businesses, specialty insurers help mitigate risks and provide peace of mind to their clients.

How is this market segmented and which is the largest segment?

The market research report provides comprehensive data (region-wise segment analysis), with forecasts and estimates in "USD billion" for the period 2024-2028, as well as historical data from 2018-2022 for the following segments.

  • Distribution Channel
    • Brokers
    • Non-brokers
  • End-user
    • Business
    • Individual
  • Geography
    • Europe
      • Germany
      • France
    • North America
      • US
    • APAC
      • China
      • Japan
    • South America
    • Middle East and Africa

By Distribution Channel Insights

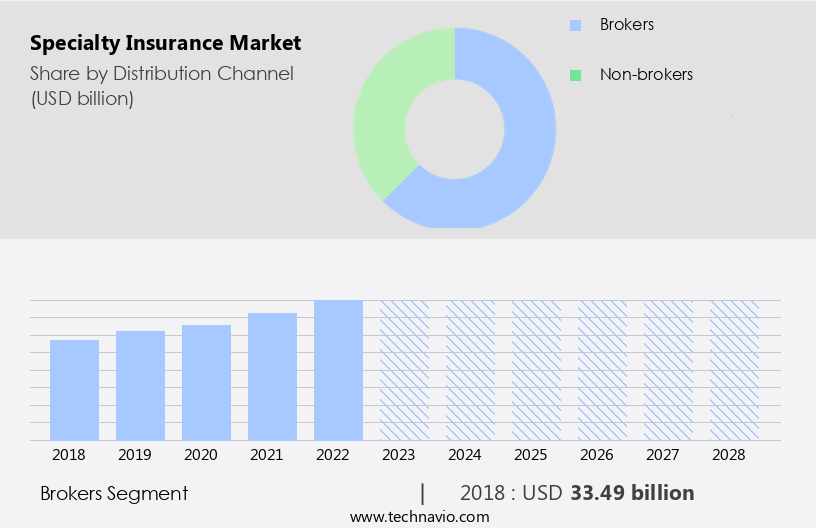
  • The brokers segment is estimated to witness significant growth during the forecast period.

In the specialized insurance sector, brokers serve as intermediaries between insurers and clients, utilizing various distribution channels to cater to distinct market segments. Traditional agency networks represent a significant distribution avenue, where brokers forge relationships with carriers and offer personalized services to clients, ensuring customized coverage for intricate insurance requirements. Conversely, digital platforms and online marketplaces have emerged as a prominent distribution channel, driven by the insurance industry's digitalization. Online brokers leverage technology to simplify the purchasing process, providing clients with convenient access to a wide range of insurance policies. Both channels cater to the unique needs of the business and individuals segments in the market.

Specialty Insurance Market Size

Get a glance at the market report of share of various segments Request Free Sample

The brokers segment was valued at USD 33.49 billion in 2018 and showed a gradual increase during the forecast period.

Regional Analysis

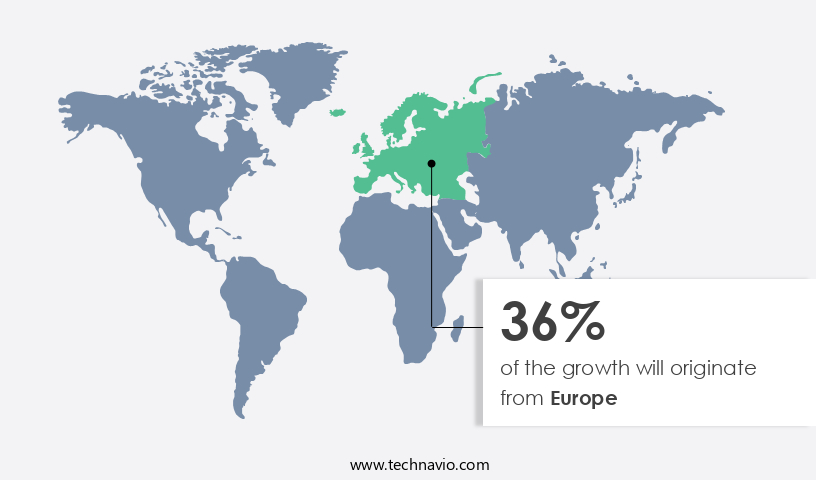
  • Europe is estimated to contribute 36% to the growth of the global market during the forecast period.

Technavio's analysts have elaborately explained the regional trends and drivers that shape the market during the forecast period.

Specialty Insurance Market Share by Geography

For more insights on the market share of various regions, Request Free Sample

The European market is characterized by its diversity and complexity, catering to the unique risk management needs of businesses in various industries. With a economy spanning manufacturing, finance, and technology sectors, European businesses require specialized insurance solutions to mitigate risks specific to their operations. Strict regulatory requirements, including GDPR and Solvency II, necessitate insurance products that ensure compliance. Additionally, Europe's position as a global innovation hub drives demand for coverage against emerging risks, such as cyber threats and technology errors and omissions. The region's increasing focus on sustainability and environmental stewardship also creates demand for insurance solutions addressing environmental liabilities and climate-related risks. The European market continues to evolve, presenting opportunities for insurers to offer tailored risk management strategies and innovative products.

Market Dynamics

Our researchers analyzed the data with 2023 as the base year, along with the key drivers, trends, and challenges. A holistic analysis of drivers will help companies refine their marketing strategies to gain a competitive advantage.

What are the key market drivers leading to the rise in adoption of Specialty Insurance Market?

Increasing globalization and interconnectedness of business is the key driver of the market.

  • The market is experiencing significant growth due to the increasing interconnectedness and globalization of businesses. As companies expand their operations internationally, they encounter unique risks that go beyond the scope of standard insurance policies. Factors fueling this trend include the rise of multinational corporations, expanding international trade agreements, and advancements in technology that facilitate cross-border commerce. Specialty risks arising from globalization include political instability, currency fluctuations, supply chain disruptions, and regulatory complexities. For instance, businesses operating in the environmental industry face potential negligence claims and judgment & legal fees, while technology integration brings about cyber liability risks.
  • Moreover, entertainment industries require insurance coverage for events and art, and livestock & aquaculture industries face unique perils. Program administrators (PAs) and brokers play a crucial role in connecting businesses with specialized insurance providers and programs. Non-brokers and venture capital firms also participate in the market, catering to the needs of various business segments and individuals.Specialty insurers employ risk mitigation strategies to address evolving regulations and potential threats, ensuring financial impact for their clients. Disaster products, non-profit protection, and mortgage banking are other business segments that require specialized insurance coverage.
  • Insurers offer disaster products to mitigate risks from natural catastrophes, while non-profit protection shields organizations from liability claims. Mortgage banking requires coverage for property risks and title issues. The market encompasses a wide range of niche insurance products, including those for aviation, marine, fine art, terrorism, and non-standard risks. As emerging risks continue to surface, insurers adapt their offerings to meet the evolving needs of their clients. In conclusion, the market is a dynamic and essential component of the global insurance industry. It caters to the unique risks and needs of various business segments and individuals, ensuring financial protection and risk management in an increasingly interconnected and complex business environment.

What are the market trends shaping the Specialty Insurance Market?

An increase in collaboration among specialty insurer is the upcoming trend in the market.

  • The market in the US is witnessing significant growth due to the increasing complexity of risks and the need for customized solutions. Specialty insurers are collaborating with businesses, program administrators (PAs), brokers, and non-brokers to offer non-standard risks coverage for various industries, including the environmental sector, technology integration, and disaster products. These collaborations aim to expand market reach and capabilities, with Munich Reinsurance Co.'s partnership with a startup for self-driving vehicle insurance being a notable example. Moreover, specialty insurance providers are integrating artificial intelligence (AI) and data analytics to assess risks, process claims, and price policies effectively. This integration is crucial in industries with high potential threats, such as cyber liability, aviation, marine, fine art, terrorism, and supply chain disruption.
  • Moreover, the entertainment industry, art insurance, livestock & aquaculture insurance, mortgage banking, non-profit protection, and digital services platforms are also benefiting from specialized insurance products. As regulations evolve and emerging risks arise, insurers are implementing risk mitigation strategies to address financial impact and improve customer experiences. Specialty insurance programs offer customized underwriting, risk assessment, and policy management for businesses and individuals, ensuring profitability and addressing their unique needs. The insurance industry's conventional plans are being supplemented with these specialized products, catering to various business segments and the individuals segment.
  • In conclusion, the market in the US is experiencing a shift towards innovation, collaboration, and customization. The integration of AI, data analytics, and emerging risks is driving the growth of this market, with various industries and segments benefiting from specialized insurance products and programs.

What challenges does Specialty Insurance Market face during the growth?

Concerns related to cyberattacks through digital technologies used for specialty insurance is a key challenge affecting the market growth.

  • The market caters to the unique and non-standard risks faced by businesses and individuals, encompassing various sectors such as the environmental industry, technology integration, entertainment, art, livestock & aquaculture, mortgage banking, disaster products, non-profit protection, digital services platforms, and more. Specialty insurance providers and companies offer customized underwriting, risk assessment, and claims processing through specialized insurance programs. The increasing integration of technology, including artificial intelligence and blockchain, has transformed the industry, enabling advanced risk mitigation strategies and data analytics. This evolution is particularly relevant for businesses with complex infrastructure and supply chain disruptions.
  • However, these advancements also introduce new risks, such as cyber liability, terrorism, and non-standard risks, necessitating the expertise of specialty insurers. Evolving regulations and potential threats pose financial impacts on businesses and individuals, necessitating the need for comprehensive insurance coverage. Specialty insurers offer niche insurance products to address these emerging risks, ensuring client satisfaction through conventional plans, policy management, and customer experiences. Despite the benefits, challenges persist, including the pricing of policies, claims processing, and data analytics tools. As the insurance industry continues to adapt to these changes, the importance of effective risk assessment and underwriting becomes increasingly crucial.

Exclusive Customer Landscape

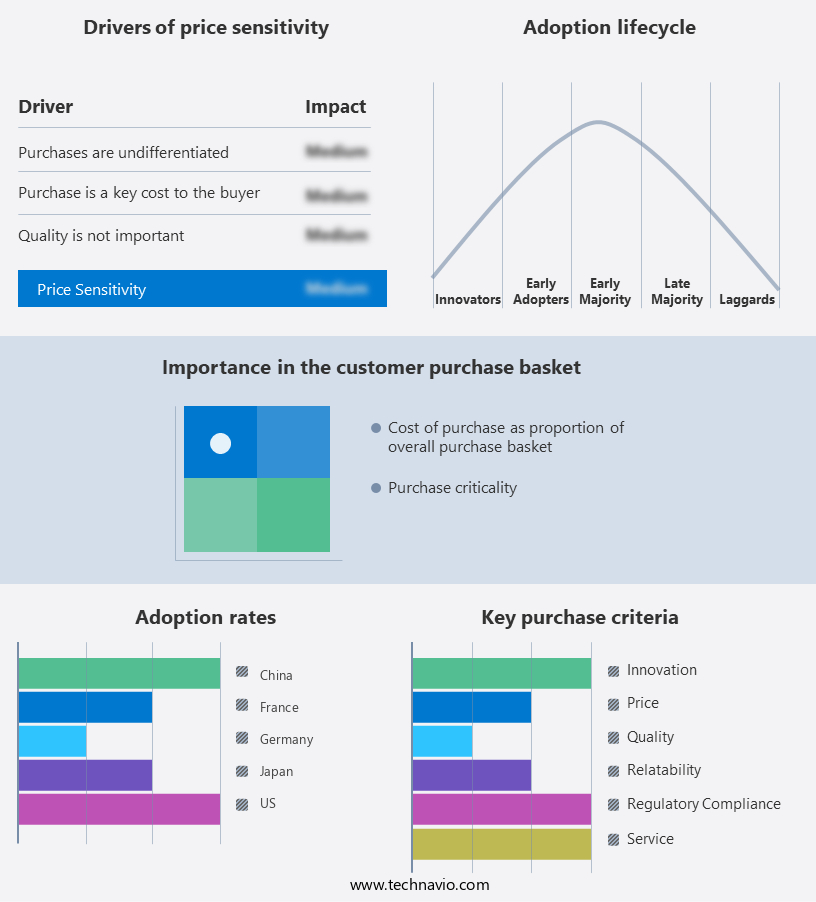
The market forecasting report includes the adoption lifecycle of the market, covering from the innovator's stage to the laggard's stage. It focuses on adoption rates in different regions based on penetration. Furthermore, the market report also includes key purchase criteria and drivers of price sensitivity to help companies evaluate and develop their market growth analysis strategies.

Specialty Insurance Market Share by Geography

 Customer Landscape

Key Companies & Market Insights

Companies are implementing various strategies, such as strategic alliances, market forecast, partnerships, mergers and acquisitions, geographical expansion, and product/service launches, to enhance their presence in the market. The market research and growth report includes detailed analyses of the competitive landscape of the market and information about key companies, including:

  • Allianz SE
  • American International Group Inc.
  • Assicurazioni Generali S.p.A.
  • Avolta AG
  • AXA Group
  • Beazley Plc
  • Berkshire Hathaway Inc.
  • Chubb Ltd.
  • Hiscox Ltd.
  • Liberty Mutual Insurance Co.
  • Markel Corp.
  • Munich Reinsurance Co.
  • PICC Property and Casualty Co. Ltd.
  • QBE Insurance Group Ltd.
  • SELECTIVE INSURANCE GROUP INC.
  • THE HANOVER INSURANCE GROUP INC.
  • THE HARTFORD FINANCIAL SERVICES GROUP INC.
  • Tokio Marine Holdings Inc.
  • Zurich Insurance Co. Ltd.
  • ARGO GROUP INTERNATIONAL HOLDINGS LTD.

Qualitative and quantitative analysis of companies has been conducted to help clients understand the wider business environment as well as the strengths and weaknesses of key market players. Data is qualitatively analyzed to categorize companies as pure play, category-focused, industry-focused, and diversified; it is quantitatively analyzed to categorize companies as dominant, leading, strong, tentative, and weak.

Research Analyst Overview

Specialty insurance is a unique segment of the insurance industry that caters to the distinct risk management needs of various businesses and individuals. This sector encompasses a wide range of non-standard risks, from negligence claims in the entertainment industry to environmental hazards in the technology sector. Businesses across industries increasingly recognize the importance of specialized insurance coverage to mitigate risks and protect their assets. Negligence claims, judgment & legal fees, and disaster products are just a few examples of the risks that businesses face in today's complex business environment. The environmental industry, for instance, is particularly vulnerable to environmental liabilities and requires specialized insurance programs to manage these risks. Technological advancements are transforming the specialty insurance landscape. Program administrators (PAS) and digital services platforms are integrating artificial intelligence (AI) and data analytics tools to streamline underwriting, claims processing, and policy management. Blockchain technology is also gaining traction in the industry, offering enhanced security and transparency in policy issuance and claims processing.

Moreover, the entertainment industry, art market, livestock & aquaculture, and non-profit protection are among the niche areas where customized underwriting and risk assessment are crucial. Brokers and non-brokers play a vital role in connecting clients with the right specialty insurance providers and companies. Venture capital firms and mortgage banking institutions are increasingly investing in specialty insurance providers and programs, recognizing the potential financial impact of emerging risks such as cyber liability, aviation, marine, fine art, terrorism, and non-standard risks. The insurance industry is subject to evolving regulations and potential threats, requiring insurers to adapt and innovate to meet the changing needs of their clients. Customized underwriting, risk assessment, and pricing of policies are essential components of effective risk mitigation strategies. Individuals also benefit from specialized insurance products, such as art insurance and personal liability coverage.

In summary, traditional insurance policies often do not provide adequate protection for these unique risks. The market is dynamic and complex, with emerging risks and underwriting trends shaping the industry. Effective risk management strategies, evolving regulations, and technological advancements are key drivers of growth and innovation in this sector. In conclusion, the market offers a wealth of opportunities for businesses and individuals seeking customized risk management solutions. From program administrators and digital services platforms to specialty insurance providers and companies, the industry is transforming to meet the evolving needs of its clients. By staying informed of market trends and emerging risks, businesses and individuals can make informed decisions and protect their assets effectively.

Market Scope

Report Coverage

Details

Page number

162

Base year

2023

Historic period

2018-2022

Forecast period

2024-2028

Growth momentum & CAGR

Accelerate at a CAGR of 10.36%

Market growth 2024-2028

USD 57.25 billion

Market structure

Fragmented

YoY growth 2023-2024(%)

10.26

Key countries

US, China, Japan, Germany, and France

Competitive landscape

Leading Companies, Market Positioning of Companies, Competitive Strategies, and Industry Risks

Request Free Sample

What are the Key Data Covered in this Market Research and Growth Report?

  • CAGR of the market during the forecast period
  • Detailed information on factors that will drive the market growth and forecasting between 2024 and 2028
  • Precise estimation of the size of the market  and its contribution of the market in focus to the parent market
  • Accurate predictions about upcoming market growth and trends and changes in consumer behaviour
  • Growth of the market across Europe, North America, APAC, South America, and Middle East and Africa
  • Thorough analysis of the market's competitive landscape and detailed information about companies
  • Comprehensive analysis of factors that will challenge the growth of market companies

We can help! Our analysts can customize this market research report to meet your requirements. Get in touch

1 Executive Summary

  • 1.1 Market overview
    • Exhibit 01: Executive Summary – Chart on Market Overview
    • Exhibit 02: Executive Summary – Data Table on Market Overview
    • Exhibit 03: Executive Summary – Chart on Global Market Characteristics
    • Exhibit 04: Executive Summary – Chart on Market by Geography
    • Exhibit 05: Executive Summary – Chart on Market Segmentation by Distribution Channel
    • Exhibit 06: Executive Summary – Chart on Market Segmentation by End-user
    • Exhibit 07: Executive Summary – Chart on Incremental Growth
    • Exhibit 08: Executive Summary – Data Table on Incremental Growth
    • Exhibit 09: Executive Summary – Chart on Vendor Market Positioning

2 Market Landscape

  • 2.1 Market ecosystem
    • Exhibit 10: Parent market
    • Exhibit 11: Market Characteristics

3 Market Sizing

  • 3.1 Market definition
    • Exhibit 12: Offerings of vendors included in the market definition
  • 3.2 Market segment analysis
    • Exhibit 13: Market segments
  • 3.3 Market size 2023
    • 3.4 Market outlook: Forecast for 2023-2028
      • Exhibit 14: Chart on Global - Market size and forecast 2023-2028 ($ billion)
      • Exhibit 15: Data Table on Global - Market size and forecast 2023-2028 ($ billion)
      • Exhibit 16: Chart on Global Market: Year-over-year growth 2023-2028 (%)
      • Exhibit 17: Data Table on Global Market: Year-over-year growth 2023-2028 (%)

    4 Historic Market Size

    • 4.1 Global speciality insurance market 2018 - 2022
      • Exhibit 18: Historic Market Size – Data Table on global speciality insurance market 2018 - 2022 ($ billion)
    • 4.2 Distribution Channel Segment Analysis 2018 - 2022
      • Exhibit 19: Historic Market Size – Distribution Channel Segment 2018 - 2022 ($ billion)
    • 4.3 End-user Segment Analysis 2018 - 2022
      • Exhibit 20: Historic Market Size – End-user Segment 2018 - 2022 ($ billion)
    • 4.4 Geography Segment Analysis 2018 - 2022
      • Exhibit 21: Historic Market Size – Geography Segment 2018 - 2022 ($ billion)
    • 4.5 Country Segment Analysis 2018 - 2022
      • Exhibit 22: Historic Market Size – Country Segment 2018 - 2022 ($ billion)

    5 Five Forces Analysis

    • 5.1 Five forces summary
      • Exhibit 23: Five forces analysis - Comparison between 2023 and 2028
    • 5.2 Bargaining power of buyers
      • Exhibit 24: Chart on Bargaining power of buyers – Impact of key factors 2023 and 2028
    • 5.3 Bargaining power of suppliers
      • Exhibit 25: Bargaining power of suppliers – Impact of key factors in 2023 and 2028
    • 5.4 Threat of new entrants
      • Exhibit 26: Threat of new entrants – Impact of key factors in 2023 and 2028
    • 5.5 Threat of substitutes
      • Exhibit 27: Threat of substitutes – Impact of key factors in 2023 and 2028
    • 5.6 Threat of rivalry
      • Exhibit 28: Threat of rivalry – Impact of key factors in 2023 and 2028
    • 5.7 Market condition
      • Exhibit 29: Chart on Market condition - Five forces 2023 and 2028

    6 Market Segmentation by Distribution Channel

    • 6.1 Market segments
      • Exhibit 30: Chart on Distribution Channel - Market share 2023-2028 (%)
      • Exhibit 31: Data Table on Distribution Channel - Market share 2023-2028 (%)
    • 6.2 Comparison by Distribution Channel
      • Exhibit 32: Chart on Comparison by Distribution Channel
      • Exhibit 33: Data Table on Comparison by Distribution Channel
    • 6.3 Brokers - Market size and forecast 2023-2028
      • Exhibit 34: Chart on Brokers - Market size and forecast 2023-2028 ($ billion)
      • Exhibit 35: Data Table on Brokers - Market size and forecast 2023-2028 ($ billion)
      • Exhibit 36: Chart on Brokers - Year-over-year growth 2023-2028 (%)
      • Exhibit 37: Data Table on Brokers - Year-over-year growth 2023-2028 (%)
    • 6.4 Non-brokers - Market size and forecast 2023-2028
      • Exhibit 38: Chart on Non-brokers - Market size and forecast 2023-2028 ($ billion)
      • Exhibit 39: Data Table on Non-brokers - Market size and forecast 2023-2028 ($ billion)
      • Exhibit 40: Chart on Non-brokers - Year-over-year growth 2023-2028 (%)
      • Exhibit 41: Data Table on Non-brokers - Year-over-year growth 2023-2028 (%)
    • 6.5 Market opportunity by Distribution Channel
      • Exhibit 42: Market opportunity by Distribution Channel ($ billion)
      • Exhibit 43: Data Table on Market opportunity by Distribution Channel ($ billion)

    7 Market Segmentation by End-user

    • 7.1 Market segments
      • Exhibit 44: Chart on End-user - Market share 2023-2028 (%)
      • Exhibit 45: Data Table on End-user - Market share 2023-2028 (%)
    • 7.2 Comparison by End-user
      • Exhibit 46: Chart on Comparison by End-user
      • Exhibit 47: Data Table on Comparison by End-user
    • 7.3 Business - Market size and forecast 2023-2028
      • Exhibit 48: Chart on Business - Market size and forecast 2023-2028 ($ billion)
      • Exhibit 49: Data Table on Business - Market size and forecast 2023-2028 ($ billion)
      • Exhibit 50: Chart on Business - Year-over-year growth 2023-2028 (%)
      • Exhibit 51: Data Table on Business - Year-over-year growth 2023-2028 (%)
    • 7.4 Individual - Market size and forecast 2023-2028
      • Exhibit 52: Chart on Individual - Market size and forecast 2023-2028 ($ billion)
      • Exhibit 53: Data Table on Individual - Market size and forecast 2023-2028 ($ billion)
      • Exhibit 54: Chart on Individual - Year-over-year growth 2023-2028 (%)
      • Exhibit 55: Data Table on Individual - Year-over-year growth 2023-2028 (%)
    • 7.5 Market opportunity by End-user
      • Exhibit 56: Market opportunity by End-user ($ billion)
      • Exhibit 57: Data Table on Market opportunity by End-user ($ billion)

    8 Customer Landscape

    • 8.1 Customer landscape overview
      • Exhibit 58: Analysis of price sensitivity, lifecycle, customer purchase basket, adoption rates, and purchase criteria

    9 Geographic Landscape

    • 9.1 Geographic segmentation
      • Exhibit 59: Chart on Market share by geography 2023-2028 (%)
      • Exhibit 60: Data Table on Market share by geography 2023-2028 (%)
    • 9.2 Geographic comparison
      • Exhibit 61: Chart on Geographic comparison
      • Exhibit 62: Data Table on Geographic comparison
    • 9.3 Europe - Market size and forecast 2023-2028
      • Exhibit 63: Chart on Europe - Market size and forecast 2023-2028 ($ billion)
      • Exhibit 64: Data Table on Europe - Market size and forecast 2023-2028 ($ billion)
      • Exhibit 65: Chart on Europe - Year-over-year growth 2023-2028 (%)
      • Exhibit 66: Data Table on Europe - Year-over-year growth 2023-2028 (%)
    • 9.4 North America - Market size and forecast 2023-2028
      • Exhibit 67: Chart on North America - Market size and forecast 2023-2028 ($ billion)
      • Exhibit 68: Data Table on North America - Market size and forecast 2023-2028 ($ billion)
      • Exhibit 69: Chart on North America - Year-over-year growth 2023-2028 (%)
      • Exhibit 70: Data Table on North America - Year-over-year growth 2023-2028 (%)
    • 9.5 APAC - Market size and forecast 2023-2028
      • Exhibit 71: Chart on APAC - Market size and forecast 2023-2028 ($ billion)
      • Exhibit 72: Data Table on APAC - Market size and forecast 2023-2028 ($ billion)
      • Exhibit 73: Chart on APAC - Year-over-year growth 2023-2028 (%)
      • Exhibit 74: Data Table on APAC - Year-over-year growth 2023-2028 (%)
    • 9.6 South America - Market size and forecast 2023-2028
      • Exhibit 75: Chart on South America - Market size and forecast 2023-2028 ($ billion)
      • Exhibit 76: Data Table on South America - Market size and forecast 2023-2028 ($ billion)
      • Exhibit 77: Chart on South America - Year-over-year growth 2023-2028 (%)
      • Exhibit 78: Data Table on South America - Year-over-year growth 2023-2028 (%)
    • 9.7 Middle East and Africa - Market size and forecast 2023-2028
      • Exhibit 79: Chart on Middle East and Africa - Market size and forecast 2023-2028 ($ billion)
      • Exhibit 80: Data Table on Middle East and Africa - Market size and forecast 2023-2028 ($ billion)
      • Exhibit 81: Chart on Middle East and Africa - Year-over-year growth 2023-2028 (%)
      • Exhibit 82: Data Table on Middle East and Africa - Year-over-year growth 2023-2028 (%)
    • 9.8 US - Market size and forecast 2023-2028
      • Exhibit 83: Chart on US - Market size and forecast 2023-2028 ($ billion)
      • Exhibit 84: Data Table on US - Market size and forecast 2023-2028 ($ billion)
      • Exhibit 85: Chart on US - Year-over-year growth 2023-2028 (%)
      • Exhibit 86: Data Table on US - Year-over-year growth 2023-2028 (%)
    • 9.9 China - Market size and forecast 2023-2028
      • Exhibit 87: Chart on China - Market size and forecast 2023-2028 ($ billion)
      • Exhibit 88: Data Table on China - Market size and forecast 2023-2028 ($ billion)
      • Exhibit 89: Chart on China - Year-over-year growth 2023-2028 (%)
      • Exhibit 90: Data Table on China - Year-over-year growth 2023-2028 (%)
    • 9.10 Germany - Market size and forecast 2023-2028
      • Exhibit 91: Chart on Germany - Market size and forecast 2023-2028 ($ billion)
      • Exhibit 92: Data Table on Germany - Market size and forecast 2023-2028 ($ billion)
      • Exhibit 93: Chart on Germany - Year-over-year growth 2023-2028 (%)
      • Exhibit 94: Data Table on Germany - Year-over-year growth 2023-2028 (%)
    • 9.11 France - Market size and forecast 2023-2028
      • Exhibit 95: Chart on France - Market size and forecast 2023-2028 ($ billion)
      • Exhibit 96: Data Table on France - Market size and forecast 2023-2028 ($ billion)
      • Exhibit 97: Chart on France - Year-over-year growth 2023-2028 (%)
      • Exhibit 98: Data Table on France - Year-over-year growth 2023-2028 (%)
    • 9.12 Japan - Market size and forecast 2023-2028
      • Exhibit 99: Chart on Japan - Market size and forecast 2023-2028 ($ billion)
      • Exhibit 100: Data Table on Japan - Market size and forecast 2023-2028 ($ billion)
      • Exhibit 101: Chart on Japan - Year-over-year growth 2023-2028 (%)
      • Exhibit 102: Data Table on Japan - Year-over-year growth 2023-2028 (%)
    • 9.13 Market opportunity by geography
      • Exhibit 103: Market opportunity by geography ($ billion)
      • Exhibit 104: Data Tables on Market opportunity by geography ($ billion)

    10 Drivers, Challenges, and Trends

    • 10.1 Market drivers
      • 10.2 Market challenges
        • 10.3 Impact of drivers and challenges
          • Exhibit 105: Impact of drivers and challenges in 2023 and 2028
        • 10.4 Market trends

          11 Vendor Landscape

          • 11.1 Overview
            • 11.2 Vendor landscape
              • Exhibit 106: Overview on Criticality of inputs and Factors of differentiation
            • 11.3 Landscape disruption
              • Exhibit 107: Overview on factors of disruption
            • 11.4 Industry risks
              • Exhibit 108: Impact of key risks on business

            12 Vendor Analysis

            • 12.1 Vendors covered
              • Exhibit 109: Vendors covered
            • 12.2 Market positioning of vendors
              • Exhibit 110: Matrix on vendor position and classification
            • 12.3 Allianz SE
              • Exhibit 111: Allianz SE - Overview
              • Exhibit 112: Allianz SE - Business segments
              • Exhibit 113: Allianz SE - Key news
              • Exhibit 114: Allianz SE - Key offerings
              • Exhibit 115: Allianz SE - Segment focus
            • 12.4 American International Group Inc.
              • Exhibit 116: American International Group Inc. - Overview
              • Exhibit 117: American International Group Inc. - Business segments
              • Exhibit 118: American International Group Inc. - Key offerings
              • Exhibit 119: American International Group Inc. - Segment focus
            • 12.5 ARGO GROUP INTERNATIONAL HOLDINGS LTD.
              • Exhibit 120: ARGO GROUP INTERNATIONAL HOLDINGS LTD. - Overview
              • Exhibit 121: ARGO GROUP INTERNATIONAL HOLDINGS LTD. - Business segments
              • Exhibit 122: ARGO GROUP INTERNATIONAL HOLDINGS LTD. - Key offerings
              • Exhibit 123: ARGO GROUP INTERNATIONAL HOLDINGS LTD. - Segment focus
            • 12.6 Assicurazioni Generali S.p.A.
              • Exhibit 124: Assicurazioni Generali S.p.A. - Overview
              • Exhibit 125: Assicurazioni Generali S.p.A. - Business segments
              • Exhibit 126: Assicurazioni Generali S.p.A. - Key offerings
              • Exhibit 127: Assicurazioni Generali S.p.A. - Segment focus
            • 12.7 AXA Group
              • Exhibit 128: AXA Group - Overview
              • Exhibit 129: AXA Group - Business segments
              • Exhibit 130: AXA Group - Key news
              • Exhibit 131: AXA Group - Key offerings
              • Exhibit 132: AXA Group - Segment focus
            • 12.8 Beazley Plc
              • Exhibit 133: Beazley Plc - Overview
              • Exhibit 134: Beazley Plc - Business segments
              • Exhibit 135: Beazley Plc - Key offerings
              • Exhibit 136: Beazley Plc - Segment focus
            • 12.9 Berkshire Hathaway Inc.
              • Exhibit 137: Berkshire Hathaway Inc. - Overview
              • Exhibit 138: Berkshire Hathaway Inc. - Business segments
              • Exhibit 139: Berkshire Hathaway Inc. - Key news
              • Exhibit 140: Berkshire Hathaway Inc. - Key offerings
              • Exhibit 141: Berkshire Hathaway Inc. - Segment focus
            • 12.10 Chubb Ltd.
              • Exhibit 142: Chubb Ltd. - Overview
              • Exhibit 143: Chubb Ltd. - Business segments
              • Exhibit 144: Chubb Ltd. - Key news
              • Exhibit 145: Chubb Ltd. - Key offerings
              • Exhibit 146: Chubb Ltd. - Segment focus
            • 12.11 Hiscox Ltd.
              • Exhibit 147: Hiscox Ltd. - Overview
              • Exhibit 148: Hiscox Ltd. - Product / Service
              • Exhibit 149: Hiscox Ltd. - Key offerings
            • 12.12 Markel Corp.
              • Exhibit 150: Markel Corp. - Overview
              • Exhibit 151: Markel Corp. - Product / Service
              • Exhibit 152: Markel Corp. - Key offerings
            • 12.13 Munich Reinsurance Co.
              • Exhibit 153: Munich Reinsurance Co. - Overview
              • Exhibit 154: Munich Reinsurance Co. - Business segments
              • Exhibit 155: Munich Reinsurance Co. - Key offerings
              • Exhibit 156: Munich Reinsurance Co. - Segment focus
            • 12.14 QBE Insurance Group Ltd.
              • Exhibit 157: QBE Insurance Group Ltd. - Overview
              • Exhibit 158: QBE Insurance Group Ltd. - Business segments
              • Exhibit 159: QBE Insurance Group Ltd. - Key offerings
              • Exhibit 160: QBE Insurance Group Ltd. - Segment focus
            • 12.15 THE HARTFORD FINANCIAL SERVICES GROUP INC.
              • Exhibit 161: THE HARTFORD FINANCIAL SERVICES GROUP INC. - Overview
              • Exhibit 162: THE HARTFORD FINANCIAL SERVICES GROUP INC. - Business segments
              • Exhibit 163: THE HARTFORD FINANCIAL SERVICES GROUP INC. - Key offerings
              • Exhibit 164: THE HARTFORD FINANCIAL SERVICES GROUP INC. - Segment focus
            • 12.16 Tokio Marine Holdings Inc.
              • Exhibit 165: Tokio Marine Holdings Inc. - Overview
              • Exhibit 166: Tokio Marine Holdings Inc. - Business segments
              • Exhibit 167: Tokio Marine Holdings Inc. - Key news
              • Exhibit 168: Tokio Marine Holdings Inc. - Key offerings
              • Exhibit 169: Tokio Marine Holdings Inc. - Segment focus
            • 12.17 Zurich Insurance Co. Ltd.
              • Exhibit 170: Zurich Insurance Co. Ltd. - Overview
              • Exhibit 171: Zurich Insurance Co. Ltd. - Business segments
              • Exhibit 172: Zurich Insurance Co. Ltd. - Key offerings
              • Exhibit 173: Zurich Insurance Co. Ltd. - Segment focus

            13 Appendix

            • 13.1 Scope of the report
              • 13.2 Inclusions and exclusions checklist
                • Exhibit 174: Inclusions checklist
                • Exhibit 175: Exclusions checklist
              • 13.3 Currency conversion rates for US$
                • Exhibit 176: Currency conversion rates for US$
              • 13.4 Research methodology
                • Exhibit 177: Research methodology
                • Exhibit 178: Validation techniques employed for market sizing
                • Exhibit 179: Information sources
              • 13.5 List of abbreviations
                • Exhibit 180: List of abbreviations

              Research Methodology

              Technavio presents a detailed picture of the market by way of study, synthesis, and summation of data from multiple sources. The analysts have presented the various facets of the market with a particular focus on identifying the key industry influencers. The data thus presented is comprehensive, reliable, and the result of extensive research, both primary and secondary.

              INFORMATION SOURCES

              Primary sources

              • Manufacturers and suppliers
              • Channel partners
              • Industry experts
              • Strategic decision makers

              Secondary sources

              • Industry journals and periodicals
              • Government data
              • Financial reports of key industry players
              • Historical data
              • Press releases

              DATA ANALYSIS

              Data Synthesis

              • Collation of data
              • Estimation of key figures
              • Analysis of derived insights

              Data Validation

              • Triangulation with data models
              • Reference against proprietary databases
              • Corroboration with industry experts

              REPORT WRITING

              Qualitative

              • Market drivers
              • Market challenges
              • Market trends
              • Five forces analysis

              Quantitative

              • Market size and forecast
              • Market segmentation
              • Geographical insights
              • Competitive landscape

              Interested in this report?

              Get your sample now to see our research methodology and insights!

              Download Now

              Frequently Asked Questions

              Specialty Insurance market growth will increase by $ 57.25 bn during 2024-2028 .

              The Specialty Insurance market is expected to grow at a CAGR of 10.36% during 2024-2028 .

              Specialty Insurance market is segmented by Distribution Channel( Brokers, Non-brokers) End-user( Business, Individual)

              Allianz SE, American International Group Inc., Assicurazioni Generali S.p.A., Avolta AG, AXA Group, Beazley Plc, Berkshire Hathaway Inc., Chubb Ltd., Hiscox Ltd., Liberty Mutual Insurance Co., Markel Corp., Munich Reinsurance Co., PICC Property and Casualty Co. Ltd., QBE Insurance Group Ltd., SELECTIVE INSURANCE GROUP INC., THE HANOVER INSURANCE GROUP INC., THE HARTFORD FINANCIAL SERVICES GROUP INC., Tokio Marine Holdings Inc., Zurich Insurance Co. Ltd., ARGO GROUP INTERNATIONAL HOLDINGS LTD. are a few of the key vendors in the Specialty Insurance market.

              Europe will register the highest growth rate of 36% among the other regions. Therefore, the Specialty Insurance market in Europe is expected to garner significant business opportunities for the vendors during the forecast period.

              US, China, Japan, Germany, France

              • Increasing globalization and interconnectedness of businessThe increasing globalization and interconnectedness of business are pivotal drivers for the growth of the global specialty insurance market. As companies expand their operations across borders is the driving factor this market.
              • they encounter a diverse array of risks that necessitate specialized insurance coverage beyond traditional policies. Factors driving this trend include the rise of multinational corporations seeking to access new markets is the driving factor this market.
              • the expansion of international trade agreements facilitating cross-border commerce is the driving factor this market.
              • and advancements in transportation and communication technologies reducing barriers to global business. Examples of risks stemming from globalization include political instability in foreign markets is the driving factor this market.
              • currency fluctuations impacting financial transactions is the driving factor this market.
              • supply chain disruptions due to geopolitical tensions or natural disasters is the driving factor this market.
              • and regulatory complexities varying across jurisdictions. Specialty insurers offer tailored solutions to address these risks such as political risk insurance is the driving factor this market.
              • trade credit insurance is the driving factor this market.
              • marine cargo insurance is the driving factor this market.
              • and international liability insurance. The interconnected nature of the global economy means that disruptions in one region can have widespread implications is the driving factor this market.
              • further emphasizing the need for specialized insurance products that provide comprehensive coverage across multiple geographies. As businesses continue to expand their global footprint is the driving factor this market.
              • the demand for specialty insurance products to mitigate cross-border risks is expected to grow is the driving factor this market.
              • driving further innovation and development in the global specialty insurance market during the forecast period. is the driving factor this market.

              The Specialty Insurance market vendors should focus on grabbing business opportunities from the Brokers segment as it accounted for the largest market share in the base year.