Spectrum Analyzer Market Analysis North America, APAC, Europe, South America, Middle East and Africa - US, China, Germany, India, France - Size and Forecast 2024-2028

Spectrum Analyzer Market Analysis North America, APAC, Europe, South America, Middle East and Africa - US, China, Germany, India, France - Size and Forecast 2024-2028

Published: Aug 2024 164 Pages SKU: IRTNTR76094

Market Overview at a Glance

$890.6 Mn
Market Opportunity
9.04%
CAGR
8.09
YoY growth 2023-2024(%)

Spectrum Analyzer Market Size 2024-2028

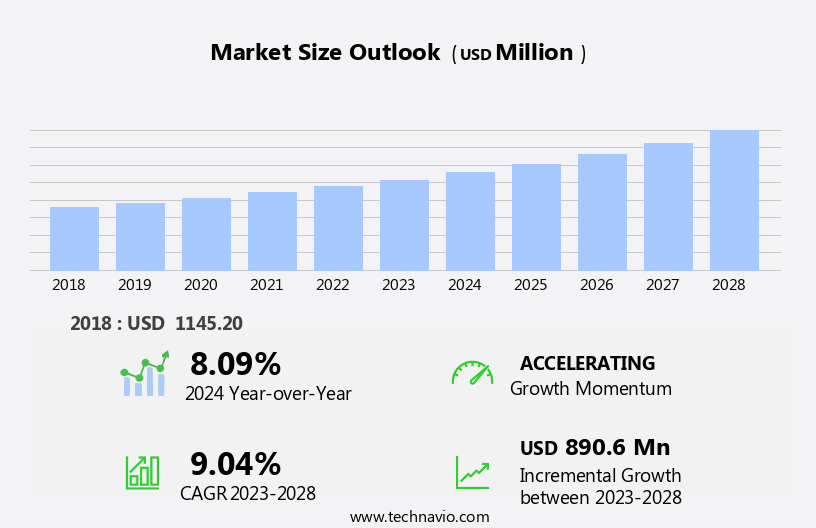
The spectrum analyzer market size is forecast to increase by USD 890.6 million at a CAGR of 9.04% between 2023 and 2028.

  • The market is experiencing significant growth due to the increasing demand for advanced RF testing solutions in various sectors, including military communications and electronics. The proliferation of 5G technology and the Internet of Things (IoT) is driving the need for more efficient and accurate spectrum analysis tools. In electronics manufacturing, spectrum analyzers are essential for ensuring the quality of semiconductor devices and other wireless components. Smart cities, IoT devices, autonomous vehicles, telecommunication networks, and smart wearables, such as ECG and EEG devices, also rely on spectrum analyzers for reliable wireless communication. Despite the high cost associated with these instruments, their importance in ensuring the optimal performance of wireless systems makes them a worthwhile investment.
  • Overall, the market for spectrum analyzers is expected to continue growing as the demand for wireless communication technologies increases in North America and beyond.
  • What will be the Size of the Spectrum Analyzer Market during the forecast period?

    Spectrum Analyzer Market Size

     Request Free Sample

  • The market encompasses advanced measuring instruments used to examine the frequency spectrum of electrical signals in various industries. Key sectors driving market growth include telecommunications, aerospace and defense, electronics manufacturing, broadcasting, and IT and telecommunication. These industries rely on spectrum analyzers to measure signal frequencies, amplitudes, and spectral content of electrical signals in wireless communication systems, such as 5G technology, smartphones, and IoT devices. Modern spectrum analyzers offer digital technologies, functionality, and compact form factors, expanding their application scope. The market's size is significant, with continuous growth attributed to the increasing demand for measuring electrical signals in various industries and the development of advanced spectrum analyzers.
  • The market's direction remains positive, with a focus on expanding frequency ranges, improving measurement accuracy, and enhancing user experience. Swept spectrum analyzers and real-time spectrum analyzers are popular choices due to their ability to analyze electrical signals in real-time and provide detailed spectral information.
  • How is this Spectrum Analyzer Industry segmented?

    The spectrum analyzer industry research report provides comprehensive data (region-wise segment analysis), with forecasts and estimates in "USD million" for the period 2024-2028, as well as historical data from 2018-2022 for the following segments.

    • End-user
      • Communication
      • Aerospace and defense
      • Mechanical
      • Semiconductor and electronics
    • Technology
      • Wired
      • Wireless
    • Geography
      • North America
        • US
      • APAC
        • China
        • India
      • Europe
        • Germany
        • France
      • South America
        • Middle East and Africa

        By End-user Insights

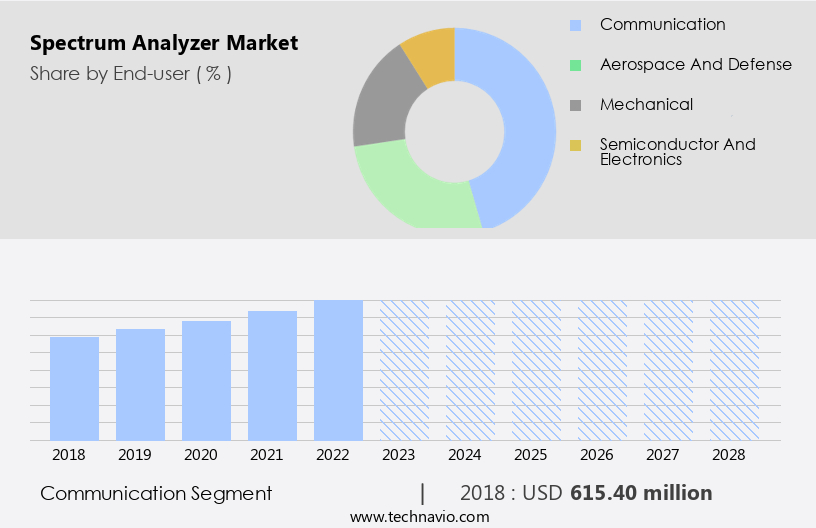
        The communication segment is estimated to witness significant growth during the forecast period.

        Spectrum analyzers are indispensable instruments In the telecommunications and electronics industries, enabling the analysis and monitoring of signals' frequency spectrum, measurement of signal strength, and detection of interference. With the proliferation of advanced technologies such as 5G, IoT, and digital signal processing, the demand for spectrum analyzers has significantly grown. These devices are instrumental In the design, testing, and optimization of wireless communication systems, ensuring network efficiency, troubleshooting, and regulatory compliance. As countries and regions allocate new frequency bands for wireless applications, the importance of spectrum analyzers in managing and monitoring expanded frequency ranges becomes increasingly vital, driving market expansion during the forecast period.

        Spectrum analyzers come in various forms, including swept spectrum analyzers, vector signal analyzers, handheld, portable, benchtop, automotive, and wireless spectrum analyzers, catering to diverse industry needs. Advanced algorithms, artificial intelligence, and machine learning enhance their functionality, making them essential tools for network operators, engineers, and technicians in electronics and semiconductor, IT and telecommunication, and other sectors.

        Spectrum Analyzer Market Size

        Get a glance at the market report of share of various segments Request Free Sample

        The Communication segment was valued at USD 615.40 million in 2018 and showed a gradual increase during the forecast period.

        Regional Analysis

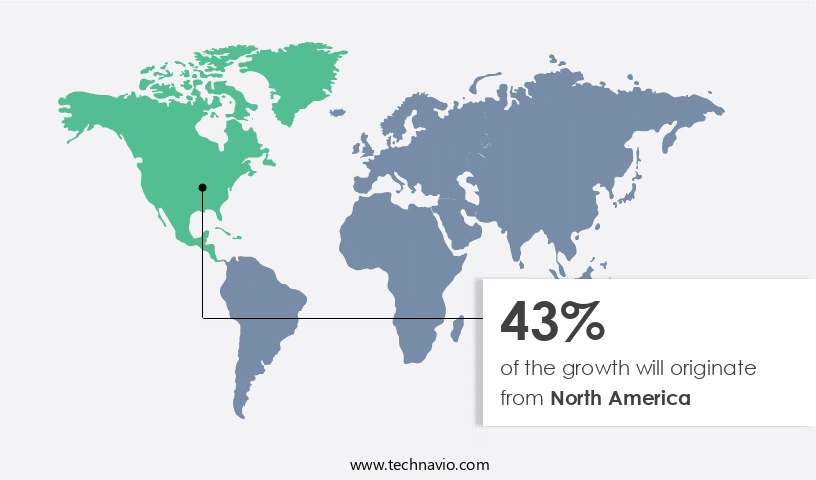
        North America is estimated to contribute 43% to the growth of the global market during the forecast period.

        Technavio’s analysts have elaborately explained the regional trends and drivers that shape the market during the forecast period.

        Spectrum Analyzer Market Share by Geography

        For more insights on the market size of various regions, Request Free Sample

        The market is a significant segment In the advanced instruments industry, focusing on measuring electrical signals In the frequency domain. This market caters to various sectors, including telecommunications, aerospace and defense, electronics manufacturing, broadcasting, and wireless communication systems. Spectrum analyzers are integral to understanding signal frequencies, amplitudes, spectral content, and wireless applications. In North America, which dominates the global market, the deployment and optimization of 5G networks are driving demand. Spectrum analyzers are essential for characterizing and troubleshooting signals in high-frequency bands, ensuring optimal network performance. Telecommunication providers in North America are continuously expanding and optimizing their wireless networks, making spectrum analyzers indispensable tools.

        Additionally, sectors like automotive and transportation, healthcare, and smart cities are also adopting wireless spectrum analyzers for coverage mapping, drive testing, direction finding, transmitter localization, and propagation analysis. Digital signal processing, advanced algorithms, artificial intelligence, and machine learning are enhancing the functionality of modern spectrum analyzers. The hardware and software segments, as well as the network technology segment, are key market categories. Frequency range, form factor, and swept spectrum analyzers, vector signal analyzers, and wireless network solutions are significant product types.

        Market Dynamics

        Our researchers analyzed the data with 2023 as the base year, along with the key drivers, trends, and challenges. A holistic analysis of drivers will help companies refine their marketing strategies to gain a competitive advantage.

        What are the key market drivers leading to the rise In the adoption of Spectrum Analyzer Industry?

        • Increasing demand for spectrum analyzers in defense is the key driver of the market. 
        • Spectrum analyzers play a pivotal role in electronic warfare and signal intelligence, enabling the detection, interception, analysis, and identification of enemy communication signals and radar emissions. In modern military operations, gaining control over the electromagnetic spectrum is crucial for maintaining reliable communications and denying adversaries access to critical frequencies. The military sector is embracing advanced technologies such as cognitive radio and dynamic spectrum access to optimally utilize the spectrum. These technologies allow spectrum analyzers to identify and exploit available frequency bands dynamically, thereby enhancing communication capabilities in complex and congested environments. The dynamic nature of the electromagnetic spectrum necessitates the use of sophisticated spectrum analyzers to ensure effective spectrum management and maintain a competitive edge In the ever-evolving landscape of electronic warfare.

        What are the market trends shaping the Spectrum Analyzer Industry?

        • Robust demand for wireless communication technologies is the upcoming market trend. 
        • The proliferation of wireless communication technologies, such as 5G, IoT, and Wi-Fi, necessitates the use of spectrum analyzers for optimizing, managing, and troubleshooting wireless signals within various frequency bands. The growth of IoT and smart devices relies on efficient wireless communication, making spectrum analyzers indispensable. These tools prevent interference and ensure smooth wireless communication by managing the crowded radio frequency spectrum. Additionally, they verify and ensure compliance with spectrum regulations for devices, reducing the risk of interference and enhancing network reliability. As new wireless standards and technologies, like Wi-Fi 6/6E and future advancements, emerge, spectrum analyzers become essential for testing and certification, ensuring compliance with the latest wireless standards.

        What challenges does the Spectrum Analyzer Industry face during its growth?

        • High cost associated with spectrum analyzers is a key challenge affecting the industry growth. 
        • Spectrum analyzers, essential tools for measuring and analyzing radio frequency (RF) signals, come with advanced capabilities such as wider frequency ranges, high resolution, fast sweep rates, and real-time analysis. These features necessitate sophisticated components and engineering, leading to higher manufacturing costs. High-performance spectrum analyzers, which offer advanced features, can be expensive, making them less accessible to smaller businesses or organizations with budget constraints. Maintaining high calibration accuracy and quality standards is crucial for spectrum analyzers, adding to the manufacturing and maintenance costs. Real-time analysis capabilities require powerful processors and specialized hardware, further increasing the overall cost. Additionally, spectrum analyzers with advanced connectivity options and software integration capabilities necessitate additional hardware and software development, adding to the overall cost.
        • These factors may hinder the growth of the market during the forecast period.

        Exclusive Customer Landscape

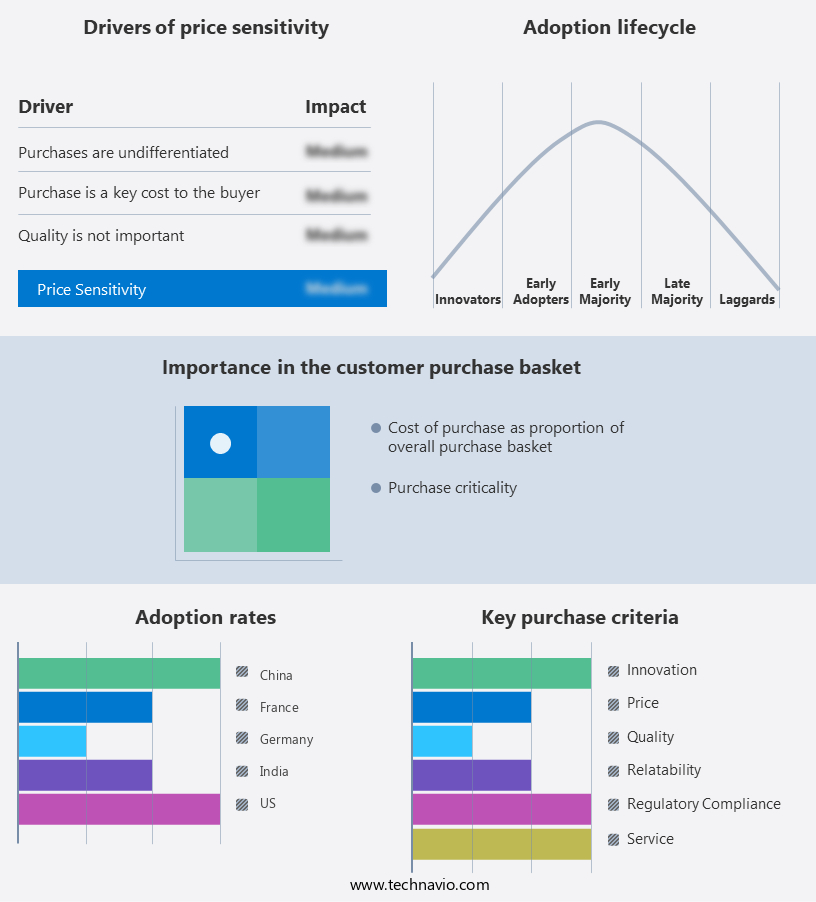
        The spectrum analyzer market forecasting report includes the adoption lifecycle of the market, covering from the innovator’s stage to the laggard’s stage. It focuses on adoption rates in different regions based on penetration. Furthermore, the spectrum analyzer market report also includes key purchase criteria and drivers of price sensitivity to help companies evaluate and develop their market growth analysis strategies.

        Spectrum Analyzer Market Share by Geography

         Customer Landscape

        Key Companies & Market Insights

        Companies are implementing various strategies, such as strategic alliances, spectrum analyzer market forecast, partnerships, mergers and acquisitions, geographical expansion, and product/service launches, to enhance their presence In the industry.

        Aaronia AG - The company provides advanced spectrum analysis solutions, including Real-Time and Sweep Spectrum analysers, enhancing search engine visibility for organizations seeking efficient and informative spectrum analysis tools. These analysers cater to various industry applications, aligning with the company's commitment to delivering cutting-edge technology and expertise.

        The industry research and growth report includes detailed analyses of the competitive landscape of the market and information about key companies, including:

        • Aaronia AG
        • Advantest Corp.
        • AFJ Instruments Srl
        • Aim and Thurlby Thandar Instruments
        • Anritsu Corp.
        • Avcom of Virginia Inc.
        • B and K Precision Corp.
        • Berkeley Nucleonics Corp.
        • CRFS Ltd.
        • Fortive Corp.
        • Giga tronics Inc.
        • Keysight Technologies Inc.
        • LP Technologies Inc.
        • National Instruments Corp.
        • Rohde and Schwarz GmbH and Co. KG
        • Shenzhen Dingyang Technology Co. Ltd.
        • Signal Hound
        • Stanford Research Systems
        • Teledyne Technologies Inc.
        • Yokogawa Electric Corp.

        Qualitative and quantitative analysis of companies has been conducted to help clients understand the wider business environment as well as the strengths and weaknesses of key industry players. Data is qualitatively analyzed to categorize companies as pure play, category-focused, industry-focused, and diversified; it is quantitatively analyzed to categorize companies as dominant, leading, strong, tentative, and weak.

        Research Analyst Overview

        The frequency spectrum market encompasses a diverse range of applications, from telecommunications and aerospace and defense to electronics manufacturing and broadcasting. Signals, In their various forms, are the lifeblood of this industry, with spectral content and amplitudes playing crucial roles in understanding their behavior. In the realm of telecommunications, modern wireless communication systems, including those powering smartphones and IoT devices, necessitate advanced instruments for analyzing and optimizing their performance. The advent of 5G technology has further intensified the demand for spectral analysis tools, as network operators strive to maximize network efficiency and capacity. Digital signal processing and advanced algorithms are integral to the functionality of modern spectrum analyzers.

        These solutions enable engineers to measure and analyze electrical signals, frequency components, and signal levels with precision. The hardware segment of the market comprises swept spectrum analyzers and vector signal analyzers, available in various form factors such as handheld, portable, benchtop, and automotive and transportation applications. The software segment of the market offers solutions for wired network technology, including wired networks and 5G networks, as well as Wi-Fi 6 and Wi-Fi 6e. Spectrum scarcity and frequency spectrum availability are pressing concerns for network operators, necessitating the adoption of spectrum management solutions. Artificial intelligence and machine learning are increasingly being integrated into measuring instruments to enhance their capabilities.

        These technologies enable advanced features such as propagation analysis, coverage mapping, drive testing, direction finding, and transmitter localization. The electronics and semiconductor industry relies on spectrum analyzers for research and development, while IT and telecommunication sectors utilize these tools for network optimization and troubleshooting. Spectrum analyzers are also essential In the aerospace and defense sector for GNSS capabilities and wireless applications. In the automotive and transportation industry, wireless spectrum analyzers are used for autonomous vehicles and smart cities applications. The healthcare sector leverages these tools for medical equipment testing and research. The market for spectrum analyzers is dynamic and evolving, driven by advancements in digital technologies and the increasing demand for high-speed, efficient communication systems.

        The industry is poised for continued growth, as the need for precise spectral analysis solutions becomes increasingly vital across various sectors.

        Market Scope

        Report Coverage

        Details

        Page number

        164

        Base year

        2023

        Historic period

        2018-2022

        Forecast period

        2024-2028

        Growth momentum & CAGR

        Accelerate at a CAGR of 9.04%

        Market growth 2024-2028

        USD 890.6 million

        Market structure

        Fragmented

        YoY growth 2023-2024(%)

        8.09

        Key countries

        US, China, Germany, India, and France

        Competitive landscape

        Leading Companies, Market Positioning of Companies, Competitive Strategies, and Industry Risks

        Request Free Sample

        What are the Key Data Covered in this Spectrum Analyzer Market Research and Growth Report?

        • CAGR of the Spectrum Analyzer industry during the forecast period
        • Detailed information on factors that will drive the growth and forecasting between 2024 and 2028
        • Precise estimation of the size of the market and its contribution of the industry in focus to the parent market
        • Accurate predictions about upcoming growth and trends and changes in consumer behaviour
        • Growth of the market across North America, APAC, Europe, South America, and Middle East and Africa
        • Thorough analysis of the market’s competitive landscape and detailed information about companies
        • Comprehensive analysis of factors that will challenge the spectrum analyzer market growth of industry companies

        We can help! Our analysts can customize this spectrum analyzer market research report to meet your requirements.

        Get in touch


        1 Executive Summary

        • 1.1 Market overview
          • Executive Summary - Chart on Market Overview
          • Executive Summary - Data Table on Market Overview
          • Executive Summary - Chart on Global Market Characteristics
          • Executive Summary - Chart on Market by Geography
          • Executive Summary - Chart on Market Segmentation by End-user
          • Executive Summary - Chart on Market Segmentation by Technology
          • Executive Summary - Chart on Incremental Growth
          • Executive Summary - Data Table on Incremental Growth
          • Executive Summary - Chart on Company Market Positioning

        2 Market Landscape

        • 2.1 Market ecosystem
          • Parent Market
          • Data Table on - Parent Market
        • 2.2 Market characteristics
          • Market characteristics analysis
        • 2.3 Value chain analysis
          • Value Chain Analysis

        3 Market Sizing

        • 3.1 Market definition
          • Offerings of companies included in the market definition
        • 3.2 Market segment analysis
          • Market segments
        • 3.3 Market size 2023
          • 3.4 Market outlook: Forecast for 2023-2028
            • Chart on Global - Market size and forecast 2023-2028 ($ million)
            • Data Table on Global - Market size and forecast 2023-2028 ($ million)
            • Chart on Global Market: Year-over-year growth 2023-2028 (%)
            • Data Table on Global Market: Year-over-year growth 2023-2028 (%)

          4 Historic Market Size

          • 4.1 Global Spectrum Analyzer Market 2018 - 2022
            • Historic Market Size - Data Table on Global Spectrum Analyzer Market 2018 - 2022 ($ million)
          • 4.2 End-user segment analysis 2018 - 2022
            • Historic Market Size - End-user Segment 2018 - 2022 ($ million)
          • 4.3 Technology segment analysis 2018 - 2022
            • Historic Market Size - Technology Segment 2018 - 2022 ($ million)
          • 4.4 Geography segment analysis 2018 - 2022
            • Historic Market Size - Geography Segment 2018 - 2022 ($ million)
          • 4.5 Country segment analysis 2018 - 2022
            • Historic Market Size - Country Segment 2018 - 2022 ($ million)

          5 Five Forces Analysis

          • 5.1 Five forces summary
            • Five forces analysis - Comparison between 2023 and 2028
          • 5.2 Bargaining power of buyers
            • Bargaining power of buyers - Impact of key factors 2023 and 2028
          • 5.3 Bargaining power of suppliers
            • Bargaining power of suppliers - Impact of key factors in 2023 and 2028
          • 5.4 Threat of new entrants
            • Threat of new entrants - Impact of key factors in 2023 and 2028
          • 5.5 Threat of substitutes
            • Threat of substitutes - Impact of key factors in 2023 and 2028
          • 5.6 Threat of rivalry
            • Threat of rivalry - Impact of key factors in 2023 and 2028
          • 5.7 Market condition
            • Chart on Market condition - Five forces 2023 and 2028

          6 Market Segmentation by End-user

          • 6.1 Market segments
            • Chart on End-user - Market share 2023-2028 (%)
            • Data Table on End-user - Market share 2023-2028 (%)
          • 6.2 Comparison by End-user
            • Chart on Comparison by End-user
            • Data Table on Comparison by End-user
          • 6.3 Communication - Market size and forecast 2023-2028
            • Chart on Communication - Market size and forecast 2023-2028 ($ million)
            • Data Table on Communication - Market size and forecast 2023-2028 ($ million)
            • Chart on Communication - Year-over-year growth 2023-2028 (%)
            • Data Table on Communication - Year-over-year growth 2023-2028 (%)
          • 6.4 Aerospace and defense - Market size and forecast 2023-2028
            • Chart on Aerospace and defense - Market size and forecast 2023-2028 ($ million)
            • Data Table on Aerospace and defense - Market size and forecast 2023-2028 ($ million)
            • Chart on Aerospace and defense - Year-over-year growth 2023-2028 (%)
            • Data Table on Aerospace and defense - Year-over-year growth 2023-2028 (%)
          • 6.5 Mechanical - Market size and forecast 2023-2028
            • Chart on Mechanical - Market size and forecast 2023-2028 ($ million)
            • Data Table on Mechanical - Market size and forecast 2023-2028 ($ million)
            • Chart on Mechanical - Year-over-year growth 2023-2028 (%)
            • Data Table on Mechanical - Year-over-year growth 2023-2028 (%)
          • 6.6 Semiconductor and electronics - Market size and forecast 2023-2028
            • Chart on Semiconductor and electronics - Market size and forecast 2023-2028 ($ million)
            • Data Table on Semiconductor and electronics - Market size and forecast 2023-2028 ($ million)
            • Chart on Semiconductor and electronics - Year-over-year growth 2023-2028 (%)
            • Data Table on Semiconductor and electronics - Year-over-year growth 2023-2028 (%)
          • 6.7 Market opportunity by End-user
            • Market opportunity by End-user ($ million)
            • Data Table on Market opportunity by End-user ($ million)

          7 Market Segmentation by Technology

          • 7.1 Market segments
            • Chart on Technology - Market share 2023-2028 (%)
            • Data Table on Technology - Market share 2023-2028 (%)
          • 7.2 Comparison by Technology
            • Chart on Comparison by Technology
            • Data Table on Comparison by Technology
          • 7.3 Wired - Market size and forecast 2023-2028
            • Chart on Wired - Market size and forecast 2023-2028 ($ million)
            • Data Table on Wired - Market size and forecast 2023-2028 ($ million)
            • Chart on Wired - Year-over-year growth 2023-2028 (%)
            • Data Table on Wired - Year-over-year growth 2023-2028 (%)
          • 7.4 Wireless - Market size and forecast 2023-2028
            • Chart on Wireless - Market size and forecast 2023-2028 ($ million)
            • Data Table on Wireless - Market size and forecast 2023-2028 ($ million)
            • Chart on Wireless - Year-over-year growth 2023-2028 (%)
            • Data Table on Wireless - Year-over-year growth 2023-2028 (%)
          • 7.5 Market opportunity by Technology
            • Market opportunity by Technology ($ million)
            • Data Table on Market opportunity by Technology ($ million)

          8 Customer Landscape

          • 8.1 Customer landscape overview
            • Analysis of price sensitivity, lifecycle, customer purchase basket, adoption rates, and purchase criteria

          9 Geographic Landscape

          • 9.1 Geographic segmentation
            • Chart on Market share by geography 2023-2028 (%)
            • Data Table on Market share by geography 2023-2028 (%)
          • 9.2 Geographic comparison
            • Chart on Geographic comparison
            • Data Table on Geographic comparison
          • 9.3 North America - Market size and forecast 2023-2028
            • Chart on North America - Market size and forecast 2023-2028 ($ million)
            • Data Table on North America - Market size and forecast 2023-2028 ($ million)
            • Chart on North America - Year-over-year growth 2023-2028 (%)
            • Data Table on North America - Year-over-year growth 2023-2028 (%)
          • 9.4 APAC - Market size and forecast 2023-2028
            • Chart on APAC - Market size and forecast 2023-2028 ($ million)
            • Data Table on APAC - Market size and forecast 2023-2028 ($ million)
            • Chart on APAC - Year-over-year growth 2023-2028 (%)
            • Data Table on APAC - Year-over-year growth 2023-2028 (%)
          • 9.5 Europe - Market size and forecast 2023-2028
            • Chart on Europe - Market size and forecast 2023-2028 ($ million)
            • Data Table on Europe - Market size and forecast 2023-2028 ($ million)
            • Chart on Europe - Year-over-year growth 2023-2028 (%)
            • Data Table on Europe - Year-over-year growth 2023-2028 (%)
          • 9.6 South America - Market size and forecast 2023-2028
            • Chart on South America - Market size and forecast 2023-2028 ($ million)
            • Data Table on South America - Market size and forecast 2023-2028 ($ million)
            • Chart on South America - Year-over-year growth 2023-2028 (%)
            • Data Table on South America - Year-over-year growth 2023-2028 (%)
          • 9.7 Middle East and Africa - Market size and forecast 2023-2028
            • Chart on Middle East and Africa - Market size and forecast 2023-2028 ($ million)
            • Data Table on Middle East and Africa - Market size and forecast 2023-2028 ($ million)
            • Chart on Middle East and Africa - Year-over-year growth 2023-2028 (%)
            • Data Table on Middle East and Africa - Year-over-year growth 2023-2028 (%)
          • 9.8 US - Market size and forecast 2023-2028
            • Chart on US - Market size and forecast 2023-2028 ($ million)
            • Data Table on US - Market size and forecast 2023-2028 ($ million)
            • Chart on US - Year-over-year growth 2023-2028 (%)
            • Data Table on US - Year-over-year growth 2023-2028 (%)
          • 9.9 China - Market size and forecast 2023-2028
            • Chart on China - Market size and forecast 2023-2028 ($ million)
            • Data Table on China - Market size and forecast 2023-2028 ($ million)
            • Chart on China - Year-over-year growth 2023-2028 (%)
            • Data Table on China - Year-over-year growth 2023-2028 (%)
          • 9.10 Germany - Market size and forecast 2023-2028
            • Chart on Germany - Market size and forecast 2023-2028 ($ million)
            • Data Table on Germany - Market size and forecast 2023-2028 ($ million)
            • Chart on Germany - Year-over-year growth 2023-2028 (%)
            • Data Table on Germany - Year-over-year growth 2023-2028 (%)
          • 9.11 India - Market size and forecast 2023-2028
            • Chart on India - Market size and forecast 2023-2028 ($ million)
            • Data Table on India - Market size and forecast 2023-2028 ($ million)
            • Chart on India - Year-over-year growth 2023-2028 (%)
            • Data Table on India - Year-over-year growth 2023-2028 (%)
          • 9.12 France - Market size and forecast 2023-2028
            • Chart on France - Market size and forecast 2023-2028 ($ million)
            • Data Table on France - Market size and forecast 2023-2028 ($ million)
            • Chart on France - Year-over-year growth 2023-2028 (%)
            • Data Table on France - Year-over-year growth 2023-2028 (%)
          • 9.13 Market opportunity by geography
            • Market opportunity by geography ($ million)
            • Data Tables on Market opportunity by geography ($ million)

          10 Drivers, Challenges, and Opportunity/Restraints

          • 10.1 Market drivers
            • 10.2 Market challenges
              • 10.3 Impact of drivers and challenges
                • Impact of drivers and challenges in 2023 and 2028
              • 10.4 Market opportunities/restraints

                11 Competitive Landscape

                • 11.1 Overview
                  • 11.2 Competitive Landscape
                    • Overview on criticality of inputs and factors of differentiation
                  • 11.3 Landscape disruption
                    • Overview on factors of disruption
                  • 11.4 Industry risks
                    • Impact of key risks on business

                  12 Competitive Analysis

                  • 12.1 Companies profiled
                    • Companies covered
                  • 12.2 Market positioning of companies
                    • Matrix on companies position and classification
                  • 12.3 Aaronia AG
                    • Aaronia AG - Overview
                    • Aaronia AG - Product / Service
                    • Aaronia AG - Key offerings
                  • 12.4 Advantest Corp.
                    • Advantest Corp. - Overview
                    • Advantest Corp. - Business segments
                    • Advantest Corp. - Key news
                    • Advantest Corp. - Key offerings
                    • Advantest Corp. - Segment focus
                  • 12.5 Anritsu Corp.
                    • Anritsu Corp. - Overview
                    • Anritsu Corp. - Business segments
                    • Anritsu Corp. - Key news
                    • Anritsu Corp. - Key offerings
                    • Anritsu Corp. - Segment focus
                  • 12.6 Avcom of Virginia Inc.
                    • Avcom of Virginia Inc. - Overview
                    • Avcom of Virginia Inc. - Product / Service
                    • Avcom of Virginia Inc. - Key offerings
                  • 12.7 B and K Precision Corp.
                    • B and K Precision Corp. - Overview
                    • B and K Precision Corp. - Product / Service
                    • B and K Precision Corp. - Key offerings
                  • 12.8 Fortive Corp.
                    • Fortive Corp. - Overview
                    • Fortive Corp. - Business segments
                    • Fortive Corp. - Key news
                    • Fortive Corp. - Key offerings
                    • Fortive Corp. - Segment focus
                  • 12.9 Giga tronics Inc.
                    • Giga tronics Inc. - Overview
                    • Giga tronics Inc. - Product / Service
                    • Giga tronics Inc. - Key offerings
                  • 12.10 Keysight Technologies Inc.
                    • Keysight Technologies Inc. - Overview
                    • Keysight Technologies Inc. - Business segments
                    • Keysight Technologies Inc. - Key news
                    • Keysight Technologies Inc. - Key offerings
                    • Keysight Technologies Inc. - Segment focus
                  • 12.11 National Instruments Corp.
                    • National Instruments Corp. - Overview
                    • National Instruments Corp. - Product / Service
                    • National Instruments Corp. - Key offerings
                  • 12.12 Rohde and Schwarz GmbH and Co. KG
                    • Rohde and Schwarz GmbH and Co. KG - Overview
                    • Rohde and Schwarz GmbH and Co. KG - Product / Service
                    • Rohde and Schwarz GmbH and Co. KG - Key news
                    • Rohde and Schwarz GmbH and Co. KG - Key offerings
                  • 12.13 Shenzhen Dingyang Technology Co. Ltd.
                    • Shenzhen Dingyang Technology Co. Ltd. - Overview
                    • Shenzhen Dingyang Technology Co. Ltd. - Product / Service
                    • Shenzhen Dingyang Technology Co. Ltd. - Key offerings
                  • 12.14 Signal Hound
                    • Signal Hound - Overview
                    • Signal Hound - Product / Service
                    • Signal Hound - Key offerings
                  • 12.15 Stanford Research Systems
                    • Stanford Research Systems - Overview
                    • Stanford Research Systems - Product / Service
                    • Stanford Research Systems - Key offerings
                  • 12.16 Teledyne Technologies Inc.
                    • Teledyne Technologies Inc. - Overview
                    • Teledyne Technologies Inc. - Business segments
                    • Teledyne Technologies Inc. - Key news
                    • Teledyne Technologies Inc. - Key offerings
                    • Teledyne Technologies Inc. - Segment focus
                  • 12.17 Yokogawa Electric Corp.
                    • Yokogawa Electric Corp. - Overview
                    • Yokogawa Electric Corp. - Business segments
                    • Yokogawa Electric Corp. - Key news
                    • Yokogawa Electric Corp. - Key offerings
                    • Yokogawa Electric Corp. - Segment focus

                  13 Appendix

                  • 13.1 Scope of the report
                    • 13.2 Inclusions and exclusions checklist
                      • Inclusions checklist
                      • Exclusions checklist
                    • 13.3 Currency conversion rates for US$
                      • Currency conversion rates for US$
                    • 13.4 Research methodology
                      • Research methodology
                    • 13.5 Data procurement
                      • Information sources
                    • 13.6 Data validation
                      • Data validation
                    • 13.7 Validation techniques employed for market sizing
                      • Validation techniques employed for market sizing
                    • 13.8 Data synthesis
                      • Data synthesis
                    • 13.9 360 degree market analysis
                      • 360 degree market analysis
                    • 13.10 List of abbreviations
                      • List of abbreviations

                    Research Methodology

                    Technavio presents a detailed picture of the market by way of study, synthesis, and summation of data from multiple sources. The analysts have presented the various facets of the market with a particular focus on identifying the key industry influencers. The data thus presented is comprehensive, reliable, and the result of extensive research, both primary and secondary.

                    INFORMATION SOURCES

                    Primary sources

                    • Manufacturers and suppliers
                    • Channel partners
                    • Industry experts
                    • Strategic decision makers

                    Secondary sources

                    • Industry journals and periodicals
                    • Government data
                    • Financial reports of key industry players
                    • Historical data
                    • Press releases

                    DATA ANALYSIS

                    Data Synthesis

                    • Collation of data
                    • Estimation of key figures
                    • Analysis of derived insights

                    Data Validation

                    • Triangulation with data models
                    • Reference against proprietary databases
                    • Corroboration with industry experts

                    REPORT WRITING

                    Qualitative

                    • Market drivers
                    • Market challenges
                    • Market trends
                    • Five forces analysis

                    Quantitative

                    • Market size and forecast
                    • Market segmentation
                    • Geographical insights
                    • Competitive landscape

                    Interested in this report?

                    Get your sample now to see our research methodology and insights!

                    Download Now

                    Frequently Asked Questions

                    Spectrum Analyzer market growth will increase by $ 890.6 mn during 2024-2028.

                    The Spectrum Analyzer market is expected to grow at a CAGR of 9.04% during 2024-2028.

                    Spectrum Analyzer market is segmented by End-user( Communication, Aerospace and defense, Mechanical, Semiconductor and electronics) Technology( Wired, Wireless)

                    Aaronia AG, Advantest Corp., AFJ Instruments Srl, Aim and Thurlby Thandar Instruments, Anritsu Corp., Avcom of Virginia Inc., B and K Precision Corp., Berkeley Nucleonics Corp., CRFS Ltd., Fortive Corp., Giga tronics Inc., Keysight Technologies Inc., LP Technologies Inc., National Instruments Corp., Rohde and Schwarz GmbH and Co. KG, Shenzhen Dingyang Technology Co. Ltd., Signal Hound, Stanford Research Systems, Teledyne Technologies Inc., Yokogawa Electric Corp. are a few of the key vendors in the Spectrum Analyzer market.

                    North America will register the highest growth rate of 43% among the other regions. Therefore, the Spectrum Analyzer market in North America is expected to garner significant business opportunities for the vendors during the forecast period.

                    US, China, Germany, India, France

                    • Increasing demand for spectrum analyzers in defenseSpectrum analyzers are essential tools in electronic warfare and signal intelligence operations. They are used to detect is the driving factor this market.
                    • intercept is the driving factor this market.
                    • analyze is the driving factor this market.
                    • and identify enemy communication signals is the driving factor this market.
                    • radar emissions is the driving factor this market.
                    • and other electronic activities is the driving factor this market.
                    • providing valuable intelligence for defensive and offensive strategies. In modern warfare is the driving factor this market.
                    • achieving spectrum dominance is critical. Spectrum analyzers aid in spectrum management by allowing military forces to understand and control the electromagnetic spectrum is the driving factor this market.
                    • ensuring reliable communications and denying adversaries the use of critical frequencies. The military is exploring cognitive radio and dynamic spectrum access technologies to make efficient use of the spectrum. Spectrum analyzers are used to identify and exploit available frequency bands dynamically is the driving factor this market.
                    • enhancing communication capabilities in challenging and congested environments. Spectrum analyzers play a role in monitoring the electromagnetic environment to detect unauthorized or malicious wireless activities is the driving factor this market.
                    • contributing to the overall cybersecurity efforts in defense operations. The combination of these factors and the dynamic nature of defense operations drive the increasing demand for spectrum analyzers in the defense industry. As technology continues to evolve is the driving factor this market.
                    • spectrum analyzers will play a critical role in ensuring spectrum superiority is the driving factor this market.
                    • enhancing situational awareness is the driving factor this market.
                    • and securing communication networks for military forces is the driving factor this market.
                    • which will have a positive impact on the growth of the market in focus during the forecast period. is the driving factor this market.

                    The Spectrum Analyzer market vendors should focus on grabbing business opportunities from the Communication segment as it accounted for the largest market share in the base year.