
Spill Containment Decks Market Size 2024-2028
The spill containment decks market size is forecast to increase by USD 63.9 million at a CAGR of 4.87% between 2023 and 2028.
- The market is experiencing significant growth due to the expansion of the global warehousing and storage industry. The proliferation of SKUs in various sectors, including retail and manufacturing, is driving the demand for these decks to prevent potential spills and protect the environment. However, the market is also facing challenges such as the volatility in raw material prices, which can impact the cost-effectiveness of these decks. Moreover, the growth of industries like wind turbines and genetic testing market necessitates the implementation of advanced spill containment systems. Additionally, stringent regulations regarding spill prevention and containment are pushing companies to invest in advanced and reliable spill containment solutions. Overall, the market is expected to witness steady growth In the coming years as businesses prioritize safety and sustainability in their operations.
What will be the Size of the Market During the Forecast Period?

- The spill containment and decks market encompasses the production and supply of barriers and systems designed to prevent or mitigate the release and spread of hazardous substances, such as fuels, chemicals, and hazardous liquids, in various water environments, including interior waterways, seashore waters, and ocean water. Key market drivers include the construction sector's expansion, urbanisation, and infrastructure development in technologically advanced places. This growth is driven by the increasing demand for secondary containment systems in buildings, roads, railroads, and infrastructure and power projects, such as wind turbines. Spill containment decks, including absorbents, berms, and spill containment pallets, play a crucial role in this market.
- Furthermore, government funds and initiatives, as well as private investments, continue to fuel the market's growth. Piling machines and underwater pilings are essential for the construction of these decks in challenging water environments.
How is this Industry segmented and which is the largest segment?
The industry research report provides comprehensive data (region-wise segment analysis), with forecasts and estimates in "USD million" for the period 2024-2028, as well as historical data from 2018-2022 for the following segments.
- Product
- Plastic spill containment decks
- Steel spill containment decks
- Geography
- North America
- Canada
- US
- APAC
- China
- Japan
- Europe
- UK
- South America
- Middle East and Africa
- North America
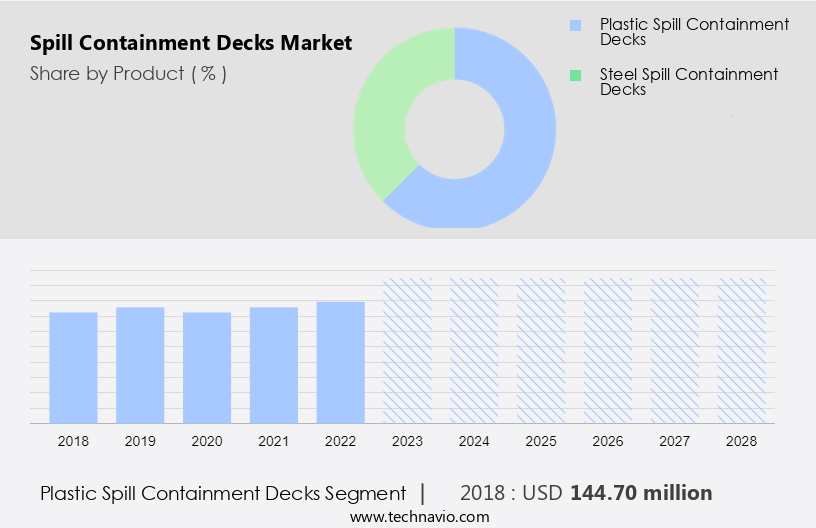
By Product Insights
- The plastic spill containment decks segment is estimated to witness significant growth during the forecast period.
The market is experiencing significant growth due to the increasing demand for secondary containment systems in various industries, including chemicals, oil and gas, pharmaceuticals, and food and beverage. These decks provide lightweight and convenient solutions for handling and storing hazardous substances, making them essential for industries that deal with such materials. The pharmaceutical sector's expansion is particularly driving the demand, as increased logistics and warehousing activities necessitate the use of these decks for storage and transportation. Additionally, the importance of maintaining hygiene and ease of cleanliness In these industries is leading companies to prioritize these decks with these features.
Get a glance at the Spill Containment Decks Industry report of share of various segments Request Free Sample
The plastic spill containment decks segment was valued at USD 144.70 million in 2018 and showed a gradual increase during the forecast period.
Regional Analysis
- APAC is estimated to contribute 37% to the growth of the global market during the forecast period.
Technavio's analysts have elaborately explained the regional trends and drivers that shape the market during the forecast period.

For more insights on the market share of various regions, Request Free Sample
The North American market experiences significant growth due to the expansion of the chemical industry and increased crude oil production In the United States and Canada. As the largest producers and consumers of chemicals and crude oil, these countries necessitate the use of containment systems for storing and transporting these substances. The chemical industry's growth is fueled by the increasing number of ethylene projects and the production of associated products. The United States is anticipated to trail behind the Middle East and Africa (MEA) region in market opportunities, with Canada and the US presenting substantial potential.
Market Dynamics
Our researchers analyzed the data with 2023 as the base year, along with the key drivers, trends, and challenges. A holistic analysis of drivers will help companies refine their marketing strategies to gain a competitive advantage.
What are the key market drivers leading to the rise In the adoption of Spill Containment Decks Industry?
Growth of global warehousing and storage market is the key driver of the market.
- Spill containment decks play a crucial role in safeguarding industries that handle hazardous substances, such as fuels, chemicals, and hazardous liquids, from accidental spills. These decks are essential in various sectors, including food and beverage, pharmaceuticals, and oil and gas, to prevent floor spillages and ensure safe storage of products. The global infrastructure and power sector's expansion, urbanization, and construction activities are driving the demand. Infrastructure projects, such as roads, railroads, and buildings, require the use of these decks during their construction.
- In addition, governments and funds invest in infrastructure projects, which include the use of spill containment technology, creating a favorable market environment. Spill containment pallets, berms, and absorbents are some of the commonly used products in this market. The economic restructuring post-pandemic, travel restrictions, business closures, and product manufacture and delivery schedule disruptions have not significantly impacted the market's growth. Instead, technological advancements, such as lasers and damage control measures, have led to improved treatment outcomes, patient satisfaction, and increased machinery industry efficiency. The spill containment market's future looks promising with continuous technological advancements and the growing need for safe handling and storage of hazardous substances.
What are the market trends shaping the Spill Containment Decks Industry?
Growth in SKU (stock-keeping units) proliferation driving demand for spill containment decks is the upcoming market trend.
- The Spill Containment and Decks Market encompasses the production and sale of containment systems designed to prevent the release of hazardous substances into interior waterways, seashore waters, and ocean water. With the expansion of urbanization and infrastructure development, including buildings, roads, railroads, and wind turbines, the need for effective spill containment solutions has grown. companies provide customized spill containment decks, such as absorbents, berms, and spill containment pallets, tailored to the specific requirements of various industries. These decks cater to the unique properties of hazardous liquids, fuels, and chemicals. The increasing demand for these products in diverse industries poses challenges for supply chains, necessitating the construction sector's investment in piling machines and underwater pilings for the production of these decks.
- Moreover, economic restructuring, travel restrictions, lockdowns, and business closures due to the obesity pandemic and global health concerns have affected product manufacture and delivery schedules, impacting global sales margins and supply systems In the post-pandemic period. Spill containment technology continues to evolve, with advancements in machinery, lasers, and secondary containment systems. The market's growth is further driven by the need for damage control measures and treatment outcomes and patient satisfaction in medical applications, such as pigmented lesions, skin regeneration, and skin toning.
What challenges does the Spill Containment Decks Industry face during its growth?
Volatility in raw material prices is a key challenge affecting the industry growth.
- The Spill Containment and Decks Market encompasses the production and sale of barriers designed to prevent the release and spread of hazardous substances, such as fuels, chemicals, and hazardous liquids, in interior waterways, seashore waters, and ocean water. Spill containment decks, absorbents, berms, and spill containment pallets are key products in this market. The construction sector, urbanisation, infrastructure development, and the proliferation of buildings, roads, railroads, and wind turbines necessitate the use of these containment systems. Raw materials, primarily plastics and steel, significantly impact the cost of spill containment products. Fluctuations In the prices of these materials can pose challenges for companies In the global market.
- Furthermore, for example, the gap between the global demand and supply of plastic polymers and steel prices over the past few years has resulted in a decrease in raw material prices. However, factors such as economic restructuring, travel restrictions, lockdowns, and business closures due to the obesity pandemic and global health concerns have disrupted supply chains and damaged control measures, potentially increasing the cost of spill containment technology and impacting treatment outcomes and patient satisfaction in technologically advanced places. Technological advancements in machinery and the infrastructure and power sectors continue to drive innovation In the spill containment market. Secondary containment systems, lasers, and genetically-tested absorbents are some of the latest developments in this field.
Exclusive Customer Landscape
The market forecasting report includes the adoption lifecycle of the market, covering from the innovator's stage to the laggard's stage. It focuses on adoption rates in different regions based on penetration. Furthermore, the market report also includes key purchase criteria and drivers of price sensitivity to help companies evaluate and develop their market growth analysis strategies.

Customer Landscape
Key Companies & Market Insights
Companies are implementing various strategies, such as strategic alliances,market forecast, partnerships, mergers and acquisitions, geographical expansion, and product/service launches, to enhance their presence in the industry.
The industry research and growth report includes detailed analyses of the competitive landscape of the market and information about key companies, including:
- Atlantic Maritime Services Pvt. Ltd.
- Brady Corp.
- Complete Environmental Products Inc.
- DENIOS INC.
- ENPAC
- EnSafeCo LLC
- EnviroGuard
- Ergen Plastic Industries
- Justrite Mfg. Co. LLC
- New Pig Corp.
- Protective Industrial Products Inc.
- Qingdao CNplast Co. Ltd.
- Rollawaycontainer.com srl
- Sellars Absorbent Materials Inc.
- Shanghai SYSBEL Industry and Technology Co. Ltd.
- SixAxis LLC
- SSI Environmental
- Swift Technoplast Pvt. Ltd.
- UltraTech International Inc.
- United States Plastic Corp.
Qualitative and quantitative analysis of companies has been conducted to help clients understand the wider business environment as well as the strengths and weaknesses of key industry players. Data is qualitatively analyzed to categorize companies as pure play, category-focused, industry-focused, and diversified; it is quantitatively analyzed to categorize companies as dominant, leading, strong, tentative, and weak.
Research Analyst Overview
The spill containment and decks market encompasses the provision of barriers and absorbents designed to prevent the release and spread of hazardous substances in various environments. These containment solutions play a crucial role in safeguarding interior waterways, seashore waters, and ocean water from accidental spills of fuels, chemicals, and hazardous liquids. The construction sector, with its ongoing urbanization and infrastructure development, presents significant opportunities for the growth of the spill containment market. The expansion of buildings, roads, railroads, and other structures necessitates the installation and secondary containment systems to protect against potential accidents. Governments and funds invest heavily In the development of these containment systems, recognizing their importance in mitigating the risks associated with the transportation and storage of hazardous substances.
Furthermore, the use of advanced machinery, such as piling machines and underwater pilings, facilitates the construction of these systems in challenging environments. The infrastructure and power sectors, particularly those involved in wind turbines and other energy production facilities, also rely on spill containment technology to ensure the safety and efficiency of their operations. Economic restructuring, travel restrictions, lockdowns, and business closures due to the post-pandemic period have not deterred the demand for these solutions. Technological advancements continue to shape the spill containment market, with innovations in materials science, machinery, and lasers leading to more effective and efficient containment systems.
Moreover, the market's supply chains have adapted to the challenges of the current business landscape, ensuring the timely delivery of products and services. Damage control measures remain a priority for industries dealing with hazardous substances, and the spill containment market offers essential solutions to minimize the impact of accidents. The market's technological advancements and strong supply chains enable it to respond effectively to the ever-evolving needs of its clients. Its importance is underscored by the ongoing expansion of infrastructure and the increasing demand for advanced containment solutions. The market's ability to adapt to the challenges of the current business landscape and its commitment to technological innovation ensure its continued growth and relevance.
|
Market Scope |
|
|
Report Coverage |
Details |
|
Page number |
140 |
|
Base year |
2023 |
|
Historic period |
2018-2022 |
|
Forecast period |
2024-2028 |
|
Growth momentum & CAGR |
Accelerate at a CAGR of 4.87% |
|
Market growth 2024-2028 |
USD 63.9 million |
|
Market structure |
Fragmented |
|
YoY growth 2023-2024(%) |
4.41 |
|
Key countries |
US, China, UK, Canada, and Japan |
|
Competitive landscape |
Leading Companies, market forecast, market growth and forecasting, Market Positioning of Companies, Competitive Strategies, and Industry Risks |
What are the Key Data Covered in this Spill Containment Decks Market Research and Growth Report?
- CAGR of the Spill Containment Decks industry during the forecast period
- Detailed information on factors that will drive the growth and forecasting between 2024 and 2028
- Precise estimation of the size of the market and its contribution of the industry in focus to the parent market
- Accurate predictions about upcoming growth and trends and changes in consumer behaviour
- Growth of the market across North America, APAC, Europe, South America, and Middle East and Africa
- Thorough analysis of the market's competitive landscape and detailed information about companies
- Comprehensive analysis of factors that will challenge the spill containment decks market growth of industry companies
We can help! Our analysts can customize this spill containment decks market research report to meet your requirements.
 RIA -
RIA - 
