Warehousing And Storage Market Size 2025-2029
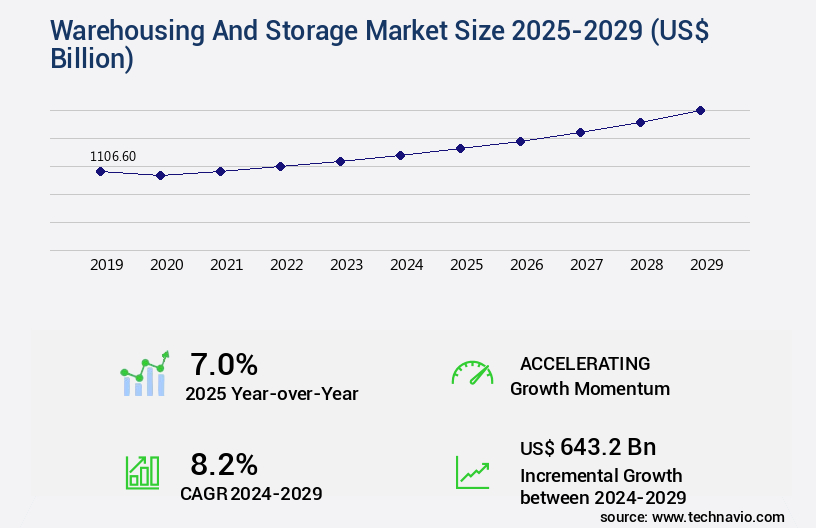
The warehousing and storage market size is forecast to increase by USD 643.2 billion, at a CAGR of 8.2% between 2024 and 2029. The market is experiencing significant growth, driven primarily by the increasing demand for refrigerated warehousing due to the surge in e-commerce sales and the need to maintain temperature-controlled environments for perishable goods. This trend is expected to continue as consumers increasingly opt for online shopping and retailers expand their offerings.
Major Market Trends & Insights
- APAC dominated the market and contributed 40% to the growth during the forecast period.
- The market is expected to grow significantly in Europe region as well over the forecast period.
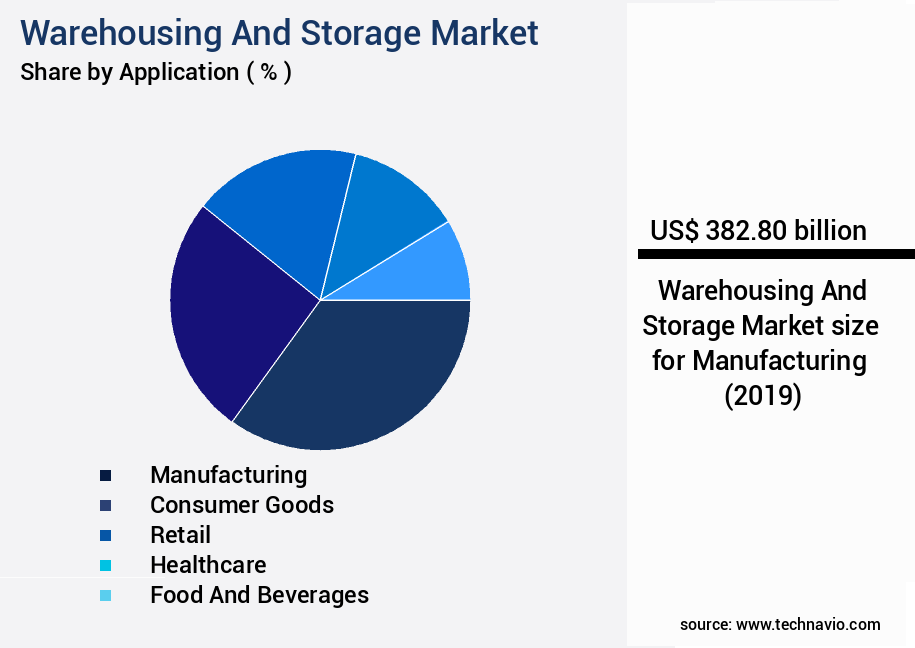
- Based on the Application, the manufacturing segment led the market and was valued at USD 442.40 billion of the global revenue in 2023.
- Based on the Product, the general segment accounted for the largest market revenue share in 2023.
Market Size & Forecast
- Market Opportunities: USD 79.16 Billion
- Future Opportunities: USD 643.2 Billion
- CAGR (2024-2029): 8.2%
- APAC: Largest market in 2023
- The market is experiencing significant shifts, driven by the increasing demand for efficient and flexible logistics solutions. According to recent studies, the market is expected to grow at a steady pace, with the adoption of automation and technology being key factors. For instance, the use of automated storage and retrieval systems (AS/RS) has gained traction, enabling faster order processing and reduced labor costs. Moreover, the integration of Internet of Things (IoT) technologies, such as real-time inventory tracking and predictive maintenance, is transforming the industry.
- Despite these advancements, regulatory compliance remains a challenge for warehousing and storage providers, with stringent regulations impacting operational efficiency. However, the market's ongoing evolution presents opportunities for innovation and growth, particularly in sectors like e-commerce and food and beverage, where the need for temperature-controlled warehousing is on the rise.
What will be the Size of the Warehousing And Storage Market during the forecast period?

Explore in-depth regional segment analysis with market size data - historical 2019-2023 and forecasts 2025-2029 - in the full report.
Request Free Sample
The market continues to evolve, driven by the dynamic needs of various sectors and the constant pursuit of operational efficiency. Inventory tracking software and storage density optimization are key areas of focus, enabling businesses to optimize their warehouse space and reduce costs. For instance, a leading retailer increased its storage capacity by 25% through effective storage density optimization. Warehouse security systems and storage costs analysis are also crucial components of modern warehousing. Automated storage retrieval systems and inventory management techniques streamline distribution center management, while barcode scanning technology ensures picking accuracy and warehouse space utilization. Demand forecasting models and order fulfillment process optimization further enhance logistics management.
Forklift safety procedures and warehouse throughput are essential aspects of warehouse operations. Third-party logistics and warehouse management systems facilitate the efficient handling of inventory, while logistics management software optimizes supply chain operations. Temperature-controlled storage and slotting optimization software cater to specific industry requirements. Industry growth in the warehousing and storage sector is expected to reach 5% annually, driven by the increasing demand for efficient and cost-effective storage solutions. Warehouse labor costs, warehouse automation systems, and cross docking operations are other areas of ongoing development. Humidity control systems, material handling equipment, and storage capacity planning are essential for maintaining optimal warehouse conditions.
Radio frequency identification (RFID) technology and last-mile delivery solutions are transforming the warehousing landscape, offering improved order accuracy metrics and streamlined delivery processes. The reverse logistics process is another evolving area, with businesses focusing on reducing waste and optimizing resources.
How is this Warehousing And Storage Industry segmented?
The warehousing and storage industry research report provides comprehensive data (region-wise segment analysis), with forecasts and estimates in "USD billion" for the period 2025-2029, as well as historical data from 2019-2023 for the following segments.
- Application
- Manufacturing
- Consumer goods
- Retail
- Healthcare
- Food and Beverages
- Others
- Product
- General
- Refrigerated
- Farm products
- Ownership
- Private Warehouses
- Public Warehouses
- Bonded Warehouses
- Type
- General Warehousing and Storage
- Refrigerated Warehousing and Storage
- Specialized Warehousing and Storage
- Farm Product Warehousing and Storage
- Technology
- Manual Warehousing
- Automated Warehousing
- Geography
- North America
- Europe
- Middle East and Africa
- APAC
- China
- India
- Japan
- South Korea
- South America
- Rest of World (ROW)
By Application Insights
The manufacturing segment is estimated to witness significant growth during the forecast period. The segment was valued at USD 442.40 billion in 2023. It continued to the largest segment at a CAGR of 6.19%.

Request Free Sample
Warehouses play a crucial role in various industries, including manufacturing, e-commerce, construction, automotive, and agriculture, by providing a centralized location for storing raw materials and finished products before distribution. The effective management of warehouses is essential for ensuring timely delivery, optimizing distribution, and enhancing customer satisfaction. Inventory tracking software and warehouse management systems facilitate efficient order fulfillment, minimizing errors and damage. Warehouse security systems protect goods from theft and loss during storage. Storage density optimization and slotting optimization software maximize warehouse space utilization, reducing costs. Automated storage retrieval systems streamline the picking process, increasing throughput and productivity.

Request Free Sample
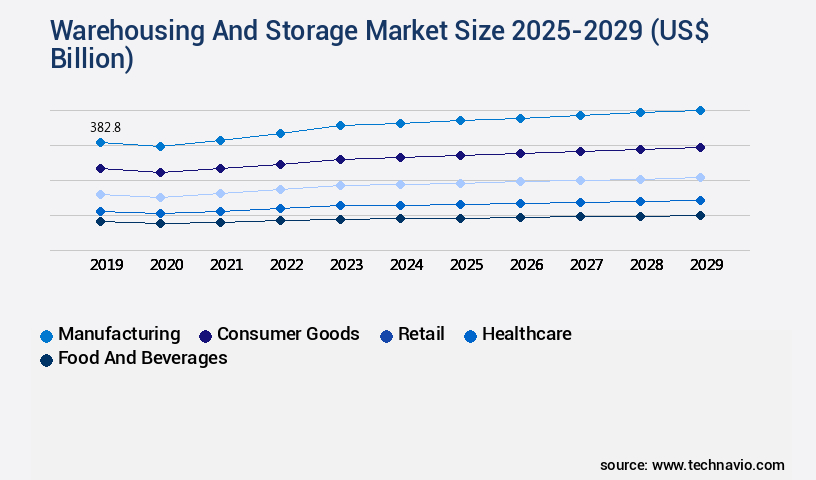
The Manufacturing segment was valued at USD 382.80 billion in 2019 and showed a gradual increase during the forecast period.
Temperature-controlled storage maintains product quality, while humidity control systems preserve sensitive materials. Demand forecasting models help manage inventory levels and reduce holding costs. Third-party logistics providers offer cost-effective solutions for companies with seasonal or fluctuating storage needs. Labor productivity metrics and cross-docking operations further optimize the supply chain, minimizing handling time and reducing costs. Reverse logistics processes ensure the efficient handling of returns, reducing waste and increasing sustainability. The market is expected to grow by 5% annually, driven by the increasing demand for efficient and cost-effective storage solutions. For instance, a manufacturing company implemented a warehouse management system and barcode scanning technology, resulting in a 20% increase in order accuracy and a 15% reduction in labor costs.
The integration of material handling equipment, warehouse automation systems, and radio frequency identification technology further enhances warehouse operations, ensuring a seamless and efficient distribution process.
Regional Analysis
APAC is estimated to contribute 40% to the growth of the global market during the forecast period. Technavio's analysts have elaborately explained the regional trends and drivers that shape the market during the forecast period.

Request Free Sample
The market is experiencing significant growth, particularly in regions like India and China, due to the rising demand for distribution centers to support the burgeoning e-commerce sector. Companies, including GLP, Blogis, Goodman, and Eshang, are expanding their warehouse capacity in China to meet this demand, but limited land availability and increasing land costs near cities pose challenges. Multi-story warehouses are becoming increasingly popular to maximize storage density and optimize warehouse space utilization. In Australia, New Zealand, Japan, Hong Kong, and Singapore, the market is also growing due to the increasing demand for self-storage facilities. According to recent studies, the market in the Asia Pacific region is projected to grow by over 10% annually, driven by the need for advanced inventory management techniques, such as barcode scanning technology and warehouse management systems, to improve picking accuracy and order fulfillment process.
Automated storage retrieval systems and temperature-controlled storage are also gaining popularity to enhance warehouse throughput and ensure proper humidity control for sensitive goods. Labor productivity metrics and supply chain optimization are crucial considerations for warehouse operators, leading to the adoption of cross docking operations and reverse logistics processes. Warehouse automation systems, including forklift safety procedures and slotting optimization software, are essential to increase efficiency and reduce warehouse labor costs. Additionally, the integration of real-time inventory tracking software and radio frequency identification technology enables better demand forecasting models and order accuracy metrics. Last mile delivery solutions are also becoming increasingly important to ensure the timely and efficient delivery of goods to customers.
Market Dynamics
Our researchers analyzed the data with 2024 as the base year, along with the key drivers, trends, and challenges. A holistic analysis of drivers will help companies refine their marketing strategies to gain a competitive advantage.
The Warehousing and Storage Market is driven by efficiency and innovation. Warehouse automation implementation strategies and leveraging warehouse robotics to improve efficiency streamline operations, while optimizing warehouse layout for efficiency and designing efficient warehouse storage racking systems maximize space. Reducing warehouse operating costs through automation and reducing inventory holding costs through optimization enhance profitability. Benefits of implementing a warehouse management system and using AI and ML in warehouse management and optimization improve decision-making.
Improving warehouse picking accuracy with barcode scanning and implementing radio frequency identification in warehousing boost accuracy. Effective temperature control in warehouse facilities, managing humidity levels within warehouse environments, and warehouse security measures and best practices ensure product integrity. Improving supply chain visibility through warehouse technology, integrating warehouse operations with e-commerce platforms, measuring and improving warehouse productivity metrics, analyzing warehouse data for operational improvements, strategies for effective warehouse space utilization, and implementing robust warehouse safety protocols drive market growth.

Request Free Sample
What are the key market drivers leading to the rise in the adoption of Warehousing And Storage Industry?
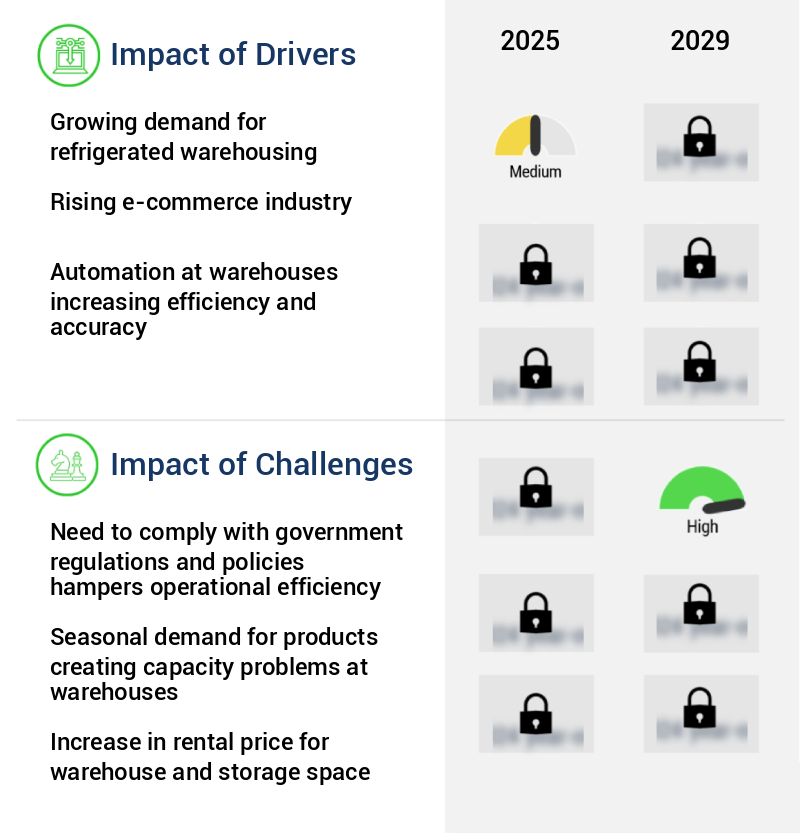
- The increasing need for refrigerated warehousing is the primary market catalyst, driven by the surging demand for perishable goods and the necessity to maintain their quality and freshness throughout the supply chain.
- In the market, refrigerated warehouses have evolved from simple storage facilities to value-add providers. These facilities play a crucial role in the cold supply chain process, preserving temperature-sensitive goods like perishable items, such as meat. Meat, which comprises 50-75% water, 18% protein, and 5-35% fat, requires refrigeration or freezing to prevent the growth of pathogens and spoilage. The demand for refrigerated warehousing is on the rise, with industry growth expected to increase by approximately 3% annually. For instance, a leading food processing company reported a 15% increase in sales after implementing a value-added refrigerated warehousing solution, which included services like order fulfillment and inventory management.
- This shift towards value-added services highlights the evolving role of refrigerated warehouses in the logistics industry.
What are the market trends shaping the Warehousing And Storage Industry?
- The use of drones in warehouse management is an emerging market trend. This innovative technology is increasingly being adopted to streamline operations and enhance efficiency.
- The market is currently experiencing a significant surge in the adoption of advanced technologies to optimize inventory management. One such innovation is the integration of unmanned aerial vehicles (UAVs), or drones, for inventory checking. These drones, which do not require pilots on board, offer increased efficiency and accuracy in inventory management. According to recent studies, the implementation of drones in warehouses has resulted in a 25% reduction in inventory checking time. Furthermore, future growth expectations indicate a robust increase of around 30% in the implementation of drone technology in warehousing operations.
- This trend is driven by the need for real-time inventory monitoring and improved operational efficiency. Warehouse and logistics businesses are embracing these advanced solutions to enhance their overall performance and remain competitive in the market.
What challenges does the Warehousing And Storage Industry face during its growth?
- Complying with government regulations and policies is a significant challenge that can hamper operational efficiency and hinder industry growth by imposing additional costs and complexities on businesses. Adhering to these requirements is mandatory, but their implementation can sometimes impede the ability to optimize processes and achieve maximum productivity. This issue is particularly pertinent in industries that are heavily regulated or undergo frequent regulatory changes.
- The market is subject to diverse regulations based on the nature of the warehouses, the industries they serve, and the specific services provided. For example, chemical warehouses face distinct regulations compared to those used in e-commerce. Compliance with regulations is essential for companies constructing warehousing and storage facilities. Regulations such as the European Regulation 1989/654/EC, German Regulations ArbStattV, and US Regulations 29CFR1910 are just a few examples. Companies must also adhere to guidelines from various regulatory bodies, including the Occupational Safety and Health Administration (OSHA), the Warehouse Development and Regulatory Authority (WDRA), and the International Organization for Standardization (ISO).
- According to recent market research, the warehousing and storage industry is projected to grow by over 5% annually, driven by the increasing demand for efficient and automated storage solutions. For instance, a leading e-commerce company reported a 30% increase in sales following the implementation of an automated storage and retrieval system.
Exclusive Customer Landscape
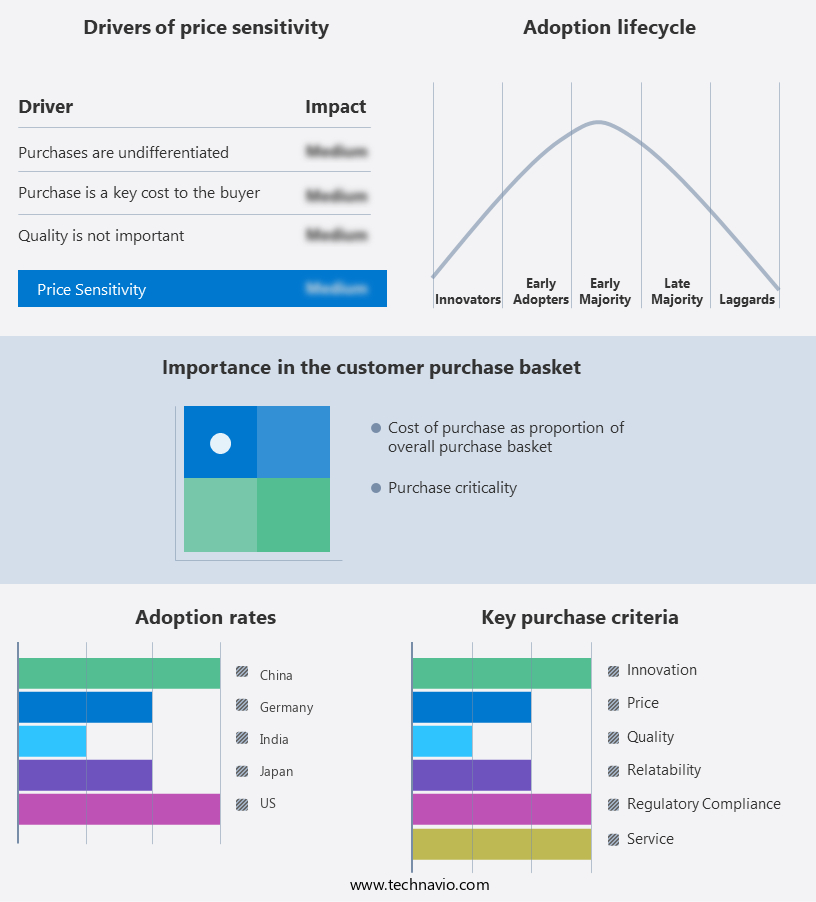
The warehousing and storage market forecasting report includes the adoption lifecycle of the market, covering from the innovator's stage to the laggard's stage. It focuses on adoption rates in different regions based on penetration. Furthermore, the warehousing and storage market report also includes key purchase criteria and drivers of price sensitivity to help companies evaluate and develop their market growth analysis strategies.

Customer Landscape
Key Companies & Market Insights
Companies are implementing various strategies, such as strategic alliances, warehousing and storage market forecast, partnerships, mergers and acquisitions, geographical expansion, and product/service launches, to enhance their presence in the industry.
Agility Public Warehousing Co. K.S.C.P - The company specializes in warehousing innovations, including agility logistics parks.
The industry research and growth report includes detailed analyses of the competitive landscape of the market and information about key companies, including:
- Agility Public Warehousing Co. K.S.C.P
- AP Moller Maersk AS
- Aramex International LLC
- C H Robinson Worldwide Inc.
- CJ CheilJedang Corp.
- CMA CGM SA Group
- Deutsche Bahn AG
- Deutsche Post AG
- DSV AS
- FedEx Corp.
- Gati Ltd
- Kerry Logistics Network Ltd.
- Kuehne Nagel Management AG
- NFI Industries Inc.
- Nippon Express Holdings Inc.
- Omni Logistics LLC
- Singapore Post Ltd.
- SNCF Group
- United Parcel Service Inc.
- XPO Inc.
Qualitative and quantitative analysis of companies has been conducted to help clients understand the wider business environment as well as the strengths and weaknesses of key industry players. Data is qualitatively analyzed to categorize companies as pure play, category-focused, industry-focused, and diversified; it is quantitatively analyzed to categorize companies as dominant, leading, strong, tentative, and weak.
Recent Development and News in Warehousing And Storage Market
- In January 2024, DHL Supply Chain announced the launch of its new Robotic Picking Solution in partnership with Swisslog, enhancing their automated warehouse services to improve efficiency and reduce errors (DHL Press Release).
- In March 2024, Amazon announced a strategic partnership with Microsoft to integrate Microsoft's Azure IoT and AI technologies into Amazon's warehouses, aiming to optimize inventory management and automate processes (Amazon Press Release).
- In May 2024, Prologis, a leading global real estate company, acquired a 1.2 million square meter logistics park in Poland from Panattoni Europe for 350 million Euros, expanding its European footprint (Prologis Press Release).
- In April 2025, the European Union passed the Green Deal Industrial Plan, allocating 43 billion Euros to modernize European industries, including the warehousing and storage sector, with a focus on sustainable and digital transformation (European Commission Press Release).
Research Analyst Overview
- The market for warehousing and storage solutions continues to evolve, driven by the diverse requirements of various sectors and the ongoing pursuit of operational efficiency. Cold chain management, a critical aspect of the market, ensures the preservation of temperature-sensitive goods, with the global cold chain logistics market projected to grow by 6.2% annually. Warehouse space planning, climate control technology, and warehouse facility design are essential components of this growth, with companies investing in advanced warehouse racking systems, such as vertical lift modules, and conveyor belt systems, to optimize warehouse throughput and material handling efficiency. Warehouse data analytics plays a significant role in reducing shipping costs, improving order processing, and enhancing inventory control.
- For instance, a leading retailer achieved a 15% reduction in shipping costs by implementing real-time inventory tracking and delivery route optimization. Additionally, the adoption of automated guided vehicles, warehouse control systems, and robotics in warehousing further boosts efficiency improvements and safety regulations. The market's focus on warehouse operations management, inventory optimization strategies, and employee training programs ensures that the sector remains at the forefront of supply chain innovation.
Dive into Technavio's robust research methodology, blending expert interviews, extensive data synthesis, and validated models for unparalleled Warehousing And Storage Market insights. See full methodology.
Market Scope
|
Report Coverage
|
Details
|
Page number
|
215
|
Base year
|
2024
|
Historic period
|
2019-2023 |
Forecast period
|
2025-2029
|
Growth momentum & CAGR
|
Accelerate at a CAGR of 8.2%
|
Market growth 2025-2029
|
USD 643.2 billion
|
Market structure
|
Fragmented
|
YoY growth 2024-2025(%)
|
7.0
|
Key countries
|
US, China, Germany, Japan, Canada, India, UK, South Korea, France, Italy, Brazil, and UAE
|
Competitive landscape
|
Leading Companies, Market Positioning of Companies, Competitive Strategies, and Industry Risks
|
Request Free Sample
What are the Key Data Covered in this Warehousing And Storage Market Research and Growth Report?
- CAGR of the Warehousing And Storage industry during the forecast period
- Detailed information on factors that will drive the growth and forecasting between 2025 and 2029
- Precise estimation of the size of the market and its contribution of the industry in focus to the parent market
- Accurate predictions about upcoming growth and trends and changes in consumer behaviour
- Growth of the market across APAC, North America, Europe, South America, and Middle East and Africa
- Thorough analysis of the market's competitive landscape and detailed information about companies
- Comprehensive analysis of factors that will challenge the warehousing and storage market growth of industry companies
We can help! Our analysts can customize this warehousing and storage market research report to meet your requirements.
Get in touch
1 Executive Summary
- 1.1 Market overview
- Executive Summary - Chart on Market Overview
- Executive Summary - Data Table on Market Overview
- Executive Summary - Chart on Global Market Characteristics
- Executive Summary - Chart on Market by Geography
- Executive Summary - Chart on Market Segmentation by Application
- Executive Summary - Chart on Market Segmentation by Product
- Executive Summary - Chart on Incremental Growth
- Executive Summary - Data Table on Incremental Growth
- Executive Summary - Chart on Company Market Positioning
2 Technavio Analysis
- 2.1 Analysis of price sensitivity, lifecycle, customer purchase basket, adoption rates, and purchase criteria
- Analysis of price sensitivity, lifecycle, customer purchase basket, adoption rates, and purchase criteria
- 2.2 Criticality of inputs and Factors of differentiation
- Overview on criticality of inputs and factors of differentiation
- 2.3 Factors of disruption
- Overview on factors of disruption
- 2.4 Impact of drivers and challenges
- Impact of drivers and challenges in 2024 and 2029
3 Market Landscape
- 3.1 Market ecosystem
- Parent Market
- Data Table on - Parent Market
- 3.2 Market characteristics
- Market characteristics analysis
4 Market Sizing
- 4.1 Market definition
- Offerings of companies included in the market definition
- 4.2 Market segment analysis
- 4.4 Market outlook: Forecast for 2024-2029
- Chart on Global - Market size and forecast 2024-2029 ($ billion)
- Data Table on Global - Market size and forecast 2024-2029 ($ billion)
- Chart on Global Market: Year-over-year growth 2024-2029 (%)
- Data Table on Global Market: Year-over-year growth 2024-2029 (%)
5 Historic Market Size
- 5.1 Global Warehousing And Storage Market 2019 - 2023
- Historic Market Size - Data Table on Global Warehousing And Storage Market 2019 - 2023 ($ billion)
- 5.2 Application segment analysis 2019 - 2023
- Historic Market Size - Application Segment 2019 - 2023 ($ billion)
- 5.3 Product segment analysis 2019 - 2023
- Historic Market Size - Product Segment 2019 - 2023 ($ billion)
- 5.4 Geography segment analysis 2019 - 2023
- Historic Market Size - Geography Segment 2019 - 2023 ($ billion)
- 5.5 Country segment analysis 2019 - 2023
- Historic Market Size - Country Segment 2019 - 2023 ($ billion)
6 Qualitative Analysis
- 6.1 The Impact of AI global warehousing and storage market
7 Five Forces Analysis
- 7.1 Five forces summary
- Five forces analysis - Comparison between 2024 and 2029
- 7.2 Bargaining power of buyers
- Bargaining power of buyers - Impact of key factors 2024 and 2029
- 7.3 Bargaining power of suppliers
- Bargaining power of suppliers - Impact of key factors in 2024 and 2029
- 7.4 Threat of new entrants
- Threat of new entrants - Impact of key factors in 2024 and 2029
- 7.5 Threat of substitutes
- Threat of substitutes - Impact of key factors in 2024 and 2029
- 7.6 Threat of rivalry
- Threat of rivalry - Impact of key factors in 2024 and 2029
- 7.7 Market condition
- Chart on Market condition - Five forces 2024 and 2029
8 Market Segmentation by Application
- 8.1 Market segments
- Chart on Application - Market share (2024-2029) (%)
- Data Table on Application - Market share (2024-2029) (%)
- 8.2 Comparison by Application
- Chart on Comparison by Application
- Data Table on Comparison by Application
- 8.3 Manufacturing - Market size and forecast (2024-2029)
- Chart on Manufacturing - Market size and forecast (2024-2029) ($ billion)
- Data Table on Manufacturing - Market size and forecast (2024-2029) ($ billion)
- Chart on Manufacturing - Year-over-year growth (2024-2029) (%)
- Data Table on Manufacturing - Year-over-year growth (2024-2029) (%)
- 8.4 Consumer goods - Market size and forecast (2024-2029)
- Chart on Consumer goods - Market size and forecast (2024-2029) ($ billion)
- Data Table on Consumer goods - Market size and forecast (2024-2029) ($ billion)
- Chart on Consumer goods - Year-over-year growth (2024-2029) (%)
- Data Table on Consumer goods - Year-over-year growth (2024-2029) (%)
- 8.5 Retail - Market size and forecast (2024-2029)
- Chart on Retail - Market size and forecast (2024-2029) ($ billion)
- Data Table on Retail - Market size and forecast (2024-2029) ($ billion)
- Chart on Retail - Year-over-year growth (2024-2029) (%)
- Data Table on Retail - Year-over-year growth (2024-2029) (%)
- 8.6 Healthcare - Market size and forecast (2024-2029)
- Chart on Healthcare - Market size and forecast (2024-2029) ($ billion)
- Data Table on Healthcare - Market size and forecast (2024-2029) ($ billion)
- Chart on Healthcare - Year-over-year growth (2024-2029) (%)
- Data Table on Healthcare - Year-over-year growth (2024-2029) (%)
- 8.7 Food and Beverages - Market size and forecast (2024-2029)
- Chart on Food and Beverages - Market size and forecast (2024-2029) ($ billion)
- Data Table on Food and Beverages - Market size and forecast (2024-2029) ($ billion)
- Chart on Food and Beverages - Year-over-year growth (2024-2029) (%)
- Data Table on Food and Beverages - Year-over-year growth (2024-2029) (%)
- 8.8 Others - Market size and forecast (2024-2029)
- Chart on Others - Market size and forecast (2024-2029) ($ billion)
- Data Table on Others - Market size and forecast (2024-2029) ($ billion)
- Chart on Others - Year-over-year growth (2024-2029) (%)
- Data Table on Others - Year-over-year growth (2024-2029) (%)
- 8.9 Market opportunity by Application
- Market opportunity by Application ($ billion)
- Data Table on Market opportunity by Application ($ billion)
9 Market Segmentation by Product
- 9.1 Market segments
- Chart on Product - Market share (2024-2029) (%)
- Data Table on Product - Market share (2024-2029) (%)
- 9.2 Comparison by Product
- Chart on Comparison by Product
- Data Table on Comparison by Product
- 9.3 General - Market size and forecast (2024-2029)
- Chart on General - Market size and forecast (2024-2029) ($ billion)
- Data Table on General - Market size and forecast (2024-2029) ($ billion)
- Chart on General - Year-over-year growth (2024-2029) (%)
- Data Table on General - Year-over-year growth (2024-2029) (%)
- 9.4 Refrigerated - Market size and forecast (2024-2029)
- Chart on Refrigerated - Market size and forecast (2024-2029) ($ billion)
- Data Table on Refrigerated - Market size and forecast (2024-2029) ($ billion)
- Chart on Refrigerated - Year-over-year growth (2024-2029) (%)
- Data Table on Refrigerated - Year-over-year growth (2024-2029) (%)
- 9.5 Farm products - Market size and forecast (2024-2029)
- Chart on Farm products - Market size and forecast (2024-2029) ($ billion)
- Data Table on Farm products - Market size and forecast (2024-2029) ($ billion)
- Chart on Farm products - Year-over-year growth (2024-2029) (%)
- Data Table on Farm products - Year-over-year growth (2024-2029) (%)
- 9.6 Market opportunity by Product
- Market opportunity by Product ($ billion)
- Data Table on Market opportunity by Product ($ billion)
10 Market Segmentation by Ownership
- 10.1 Market segments
- Chart on Ownership - Market share (2024-2029) (%)
- Data Table on Ownership - Market share (2024-2029) (%)
- 10.2 Comparison by Ownership
- Chart on Comparison by Ownership
- Data Table on Comparison by Ownership
- 10.3 Private Warehouses - Market size and forecast (2024-2029)
- Chart on Private Warehouses - Market size and forecast (2024-2029) ($ billion)
- Data Table on Private Warehouses - Market size and forecast (2024-2029) ($ billion)
- Chart on Private Warehouses - Year-over-year growth (2024-2029) (%)
- Data Table on Private Warehouses - Year-over-year growth (2024-2029) (%)
- 10.4 Public Warehouses - Market size and forecast (2024-2029)
- Chart on Public Warehouses - Market size and forecast (2024-2029) ($ billion)
- Data Table on Public Warehouses - Market size and forecast (2024-2029) ($ billion)
- Chart on Public Warehouses - Year-over-year growth (2024-2029) (%)
- Data Table on Public Warehouses - Year-over-year growth (2024-2029) (%)
- 10.5 Bonded Warehouses - Market size and forecast (2024-2029)
- Chart on Bonded Warehouses - Market size and forecast (2024-2029) ($ billion)
- Data Table on Bonded Warehouses - Market size and forecast (2024-2029) ($ billion)
- Chart on Bonded Warehouses - Year-over-year growth (2024-2029) (%)
- Data Table on Bonded Warehouses - Year-over-year growth (2024-2029) (%)
- 10.6 Market opportunity by Ownership
- Market opportunity by Ownership ($ billion)
- Data Table on Market opportunity by Ownership ($ billion)
11 Market Segmentation by Type
- 11.1 Market segments
- Chart on Type - Market share (2024-2029) (%)
- Data Table on Type - Market share (2024-2029) (%)
- 11.2 Comparison by Type
- Chart on Comparison by Type
- Data Table on Comparison by Type
- 11.3 General Warehousing and Storage - Market size and forecast (2024-2029)
- Chart on General Warehousing and Storage - Market size and forecast (2024-2029) ($ billion)
- Data Table on General Warehousing and Storage - Market size and forecast (2024-2029) ($ billion)
- Chart on General Warehousing and Storage - Year-over-year growth (2024-2029) (%)
- Data Table on General Warehousing and Storage - Year-over-year growth (2024-2029) (%)
- 11.4 Refrigerated Warehousing and Storage - Market size and forecast (2024-2029)
- Chart on Refrigerated Warehousing and Storage - Market size and forecast (2024-2029) ($ billion)
- Data Table on Refrigerated Warehousing and Storage - Market size and forecast (2024-2029) ($ billion)
- Chart on Refrigerated Warehousing and Storage - Year-over-year growth (2024-2029) (%)
- Data Table on Refrigerated Warehousing and Storage - Year-over-year growth (2024-2029) (%)
- 11.5 Specialized Warehousing and Storage - Market size and forecast (2024-2029)
- Chart on Specialized Warehousing and Storage - Market size and forecast (2024-2029) ($ billion)
- Data Table on Specialized Warehousing and Storage - Market size and forecast (2024-2029) ($ billion)
- Chart on Specialized Warehousing and Storage - Year-over-year growth (2024-2029) (%)
- Data Table on Specialized Warehousing and Storage - Year-over-year growth (2024-2029) (%)
- 11.6 Farm Product Warehousing and Storage - Market size and forecast (2024-2029)
- Chart on Farm Product Warehousing and Storage - Market size and forecast (2024-2029) ($ billion)
- Data Table on Farm Product Warehousing and Storage - Market size and forecast (2024-2029) ($ billion)
- Chart on Farm Product Warehousing and Storage - Year-over-year growth (2024-2029) (%)
- Data Table on Farm Product Warehousing and Storage - Year-over-year growth (2024-2029) (%)
- 11.7 Market opportunity by Type
- Market opportunity by Type ($ billion)
- Data Table on Market opportunity by Type ($ billion)
12 Market Segmentation by Technology
- 12.1 Market segments
- Chart on Technology - Market share (2024-2029) (%)
- Data Table on Technology - Market share (2024-2029) (%)
- 12.2 Comparison by Technology
- Chart on Comparison by Technology
- Data Table on Comparison by Technology
- 12.3 Manual Warehousing - Market size and forecast (2024-2029)
- Chart on Manual Warehousing - Market size and forecast (2024-2029) ($ billion)
- Data Table on Manual Warehousing - Market size and forecast (2024-2029) ($ billion)
- Chart on Manual Warehousing - Year-over-year growth (2024-2029) (%)
- Data Table on Manual Warehousing - Year-over-year growth (2024-2029) (%)
- 12.4 Automated Warehousing - Market size and forecast (2024-2029)
- Chart on Automated Warehousing - Market size and forecast (2024-2029) ($ billion)
- Data Table on Automated Warehousing - Market size and forecast (2024-2029) ($ billion)
- Chart on Automated Warehousing - Year-over-year growth (2024-2029) (%)
- Data Table on Automated Warehousing - Year-over-year growth (2024-2029) (%)
- 12.5 Market opportunity by Technology
- Market opportunity by Technology ($ billion)
- Data Table on Market opportunity by Technology ($ billion)
13 Customer Landscape
- 13.1 Customer landscape overview
- Analysis of price sensitivity, lifecycle, customer purchase basket, adoption rates, and purchase criteria
14 Geographic Landscape
- 14.1 Geographic segmentation
- Chart on Market share by geography 2024-2029 (%)
- Data Table on Market share by geography 2024-2029 (%)
- 14.2 Geographic comparison
- Chart on Geographic comparison
- Data Table on Geographic comparison
- 14.3 APAC - Market size and forecast 2024-2029
- Chart on APAC - Market size and forecast 2024-2029 ($ billion)
- Data Table on APAC - Market size and forecast 2024-2029 ($ billion)
- Chart on APAC - Year-over-year growth 2024-2029 (%)
- Data Table on APAC - Year-over-year growth 2024-2029 (%)
- 14.4 North America - Market size and forecast 2024-2029
- Chart on North America - Market size and forecast 2024-2029 ($ billion)
- Data Table on North America - Market size and forecast 2024-2029 ($ billion)
- Chart on North America - Year-over-year growth 2024-2029 (%)
- Data Table on North America - Year-over-year growth 2024-2029 (%)
- 14.5 Europe - Market size and forecast 2024-2029
- Chart on Europe - Market size and forecast 2024-2029 ($ billion)
- Data Table on Europe - Market size and forecast 2024-2029 ($ billion)
- Chart on Europe - Year-over-year growth 2024-2029 (%)
- Data Table on Europe - Year-over-year growth 2024-2029 (%)
- 14.6 South America - Market size and forecast 2024-2029
- Chart on South America - Market size and forecast 2024-2029 ($ billion)
- Data Table on South America - Market size and forecast 2024-2029 ($ billion)
- Chart on South America - Year-over-year growth 2024-2029 (%)
- Data Table on South America - Year-over-year growth 2024-2029 (%)
- 14.7 Middle East and Africa - Market size and forecast 2024-2029
- Chart on Middle East and Africa - Market size and forecast 2024-2029 ($ billion)
- Data Table on Middle East and Africa - Market size and forecast 2024-2029 ($ billion)
- Chart on Middle East and Africa - Year-over-year growth 2024-2029 (%)
- Data Table on Middle East and Africa - Year-over-year growth 2024-2029 (%)
- 14.8 US - Market size and forecast 2024-2029
- Chart on US - Market size and forecast 2024-2029 ($ billion)
- Data Table on US - Market size and forecast 2024-2029 ($ billion)
- Chart on US - Year-over-year growth 2024-2029 (%)
- Data Table on US - Year-over-year growth 2024-2029 (%)
- 14.9 China - Market size and forecast 2024-2029
- Chart on China - Market size and forecast 2024-2029 ($ billion)
- Data Table on China - Market size and forecast 2024-2029 ($ billion)
- Chart on China - Year-over-year growth 2024-2029 (%)
- Data Table on China - Year-over-year growth 2024-2029 (%)
- 14.10 Germany - Market size and forecast 2024-2029
- Chart on Germany - Market size and forecast 2024-2029 ($ billion)
- Data Table on Germany - Market size and forecast 2024-2029 ($ billion)
- Chart on Germany - Year-over-year growth 2024-2029 (%)
- Data Table on Germany - Year-over-year growth 2024-2029 (%)
- 14.11 Japan - Market size and forecast 2024-2029
- Chart on Japan - Market size and forecast 2024-2029 ($ billion)
- Data Table on Japan - Market size and forecast 2024-2029 ($ billion)
- Chart on Japan - Year-over-year growth 2024-2029 (%)
- Data Table on Japan - Year-over-year growth 2024-2029 (%)
- 14.12 Canada - Market size and forecast 2024-2029
- Chart on Canada - Market size and forecast 2024-2029 ($ billion)
- Data Table on Canada - Market size and forecast 2024-2029 ($ billion)
- Chart on Canada - Year-over-year growth 2024-2029 (%)
- Data Table on Canada - Year-over-year growth 2024-2029 (%)
- 14.13 India - Market size and forecast 2024-2029
- Chart on India - Market size and forecast 2024-2029 ($ billion)
- Data Table on India - Market size and forecast 2024-2029 ($ billion)
- Chart on India - Year-over-year growth 2024-2029 (%)
- Data Table on India - Year-over-year growth 2024-2029 (%)
- 14.14 UK - Market size and forecast 2024-2029
- Chart on UK - Market size and forecast 2024-2029 ($ billion)
- Data Table on UK - Market size and forecast 2024-2029 ($ billion)
- Chart on UK - Year-over-year growth 2024-2029 (%)
- Data Table on UK - Year-over-year growth 2024-2029 (%)
- 14.15 South Korea - Market size and forecast 2024-2029
- Chart on South Korea - Market size and forecast 2024-2029 ($ billion)
- Data Table on South Korea - Market size and forecast 2024-2029 ($ billion)
- Chart on South Korea - Year-over-year growth 2024-2029 (%)
- Data Table on South Korea - Year-over-year growth 2024-2029 (%)
- 14.16 France - Market size and forecast 2024-2029
- Chart on France - Market size and forecast 2024-2029 ($ billion)
- Data Table on France - Market size and forecast 2024-2029 ($ billion)
- Chart on France - Year-over-year growth 2024-2029 (%)
- Data Table on France - Year-over-year growth 2024-2029 (%)
- 14.17 Italy - Market size and forecast 2024-2029
- Chart on Italy - Market size and forecast 2024-2029 ($ billion)
- Data Table on Italy - Market size and forecast 2024-2029 ($ billion)
- Chart on Italy - Year-over-year growth 2024-2029 (%)
- Data Table on Italy - Year-over-year growth 2024-2029 (%)
- 14.18 Market opportunity by geography
- Market opportunity by geography ($ billion)
- Data Tables on Market opportunity by geography ($ billion)
- 14.19 Brazil - Market size and forecast (2024-2029)
- Chart on Brazil - Market size and forecast (2024-2029) ($ billion)
- Data Table on Brazil - Market size and forecast (2024-2029) ($ billion)
- Chart on Brazil - Year-over-year growth (2024-2029) (%)
- Data Table on Brazil - Year-over-year growth (2024-2029) (%)
- 14.20 UAE - Market size and forecast (2024-2029)
- Chart on UAE - Market size and forecast (2024-2029) ($ billion)
- Data Table on UAE - Market size and forecast (2024-2029) ($ billion)
- Chart on UAE - Year-over-year growth (2024-2029) (%)
- Data Table on UAE - Year-over-year growth (2024-2029) (%)
- 14.21 Rest of World (ROW) - Market size and forecast (2024-2029)
- Chart on Rest of World (ROW) - Market size and forecast (2024-2029) ($ billion)
- Data Table on Rest of World (ROW) - Market size and forecast (2024-2029) ($ billion)
- Chart on Rest of World (ROW) - Year-over-year growth (2024-2029) (%)
- Data Table on Rest of World (ROW) - Year-over-year growth (2024-2029) (%)
15 Drivers, Challenges, and Opportunity/Restraints
- 15.3 Impact of drivers and challenges
- Impact of drivers and challenges in 2024 and 2029
- 15.4 Market opportunities/restraints
16 Competitive Landscape
- 16.2 Competitive Landscape
- Overview on criticality of inputs and factors of differentiation
- 16.3 Landscape disruption
- Overview on factors of disruption
- 16.4 Industry risks
- Impact of key risks on business
17 Competitive Analysis
- 17.2 Company ranking index
- 17.3 Market positioning of companies
- Matrix on companies position and classification
- 17.4 Agility Public Warehousing Co. K.S.C.P
- Agility Public Warehousing Co. K.S.C.P - Overview
- Agility Public Warehousing Co. K.S.C.P - Business segments
- Agility Public Warehousing Co. K.S.C.P - Key offerings
- Agility Public Warehousing Co. K.S.C.P - Segment focus
- SWOT
- 17.5 AP Moller Maersk AS
- AP Moller Maersk AS - Overview
- AP Moller Maersk AS - Business segments
- AP Moller Maersk AS - Key news
- AP Moller Maersk AS - Key offerings
- AP Moller Maersk AS - Segment focus
- SWOT
- 17.6 Aramex International LLC
- Aramex International LLC - Overview
- Aramex International LLC - Product / Service
- Aramex International LLC - Key news
- Aramex International LLC - Key offerings
- SWOT
- 17.7 C H Robinson Worldwide Inc.
- C H Robinson Worldwide Inc. - Overview
- C H Robinson Worldwide Inc. - Business segments
- C H Robinson Worldwide Inc. - Key news
- C H Robinson Worldwide Inc. - Key offerings
- C H Robinson Worldwide Inc. - Segment focus
- SWOT
- 17.8 CJ CheilJedang Corp.
- CJ CheilJedang Corp. - Overview
- CJ CheilJedang Corp. - Business segments
- CJ CheilJedang Corp. - Key news
- CJ CheilJedang Corp. - Key offerings
- CJ CheilJedang Corp. - Segment focus
- SWOT
- 17.9 CMA CGM SA Group
- CMA CGM SA Group - Overview
- CMA CGM SA Group - Product / Service
- CMA CGM SA Group - Key news
- CMA CGM SA Group - Key offerings
- SWOT
- 17.10 Deutsche Bahn AG
- Deutsche Bahn AG - Overview
- Deutsche Bahn AG - Product / Service
- Deutsche Bahn AG - Key offerings
- SWOT
- 17.11 Deutsche Post AG
- Deutsche Post AG - Overview
- Deutsche Post AG - Business segments
- Deutsche Post AG - Key news
- Deutsche Post AG - Key offerings
- Deutsche Post AG - Segment focus
- SWOT
- 17.12 DSV AS
- DSV AS - Overview
- DSV AS - Business segments
- DSV AS - Key offerings
- DSV AS - Segment focus
- SWOT
- 17.13 FedEx Corp.
- FedEx Corp. - Overview
- FedEx Corp. - Business segments
- FedEx Corp. - Key news
- FedEx Corp. - Key offerings
- FedEx Corp. - Segment focus
- SWOT
- 17.14 Gati Ltd
- Gati Ltd - Overview
- Gati Ltd - Business segments
- Gati Ltd - Key offerings
- Gati Ltd - Segment focus
- SWOT
- 17.15 Kuehne Nagel Management AG
- Kuehne Nagel Management AG - Overview
- Kuehne Nagel Management AG - Business segments
- Kuehne Nagel Management AG - Key news
- Kuehne Nagel Management AG - Key offerings
- Kuehne Nagel Management AG - Segment focus
- SWOT
- 17.16 SNCF Group
- SNCF Group - Overview
- SNCF Group - Product / Service
- SNCF Group - Key offerings
- SWOT
- 17.17 United Parcel Service Inc.
- United Parcel Service Inc. - Overview
- United Parcel Service Inc. - Business segments
- United Parcel Service Inc. - Key news
- United Parcel Service Inc. - Key offerings
- United Parcel Service Inc. - Segment focus
- SWOT
- 17.18 XPO Inc.
- XPO Inc. - Overview
- XPO Inc. - Business segments
- XPO Inc. - Key news
- XPO Inc. - Key offerings
- XPO Inc. - Segment focus
- SWOT
18 Appendix
- 18.2 Inclusions and exclusions checklist
- Inclusions checklist
- Exclusions checklist
- 18.3 Currency conversion rates for US$
- Currency conversion rates for US$
- 18.4 Research methodology
- 18.7 Validation techniques employed for market sizing
- Validation techniques employed for market sizing
- 18.9 360 degree market analysis
- 360 degree market analysis
- 18.10 List of abbreviations