Spirulina Chocolates Market Analysis, Size, and Forecast 2024-2028: North America (US and Canada), Europe (France, Germany, Italy, and UK), Middle East and Africa (Egypt, KSA, Oman, and UAE), APAC (China, India, and Japan), South America (Argentina and Brazil), and Rest of World (ROW)

Spirulina Chocolates Market Analysis, Size, and Forecast 2024-2028:
North America (US and Canada), Europe (France, Germany, Italy, and UK), Middle East and Africa (Egypt, KSA, Oman, and UAE), APAC (China, India, and Japan), South America (Argentina and Brazil), and Rest of World (ROW)

Published: Aug 2024 160 Pages SKU: IRTNTR43154

Market Overview at a Glance

$252 Mn
Market Opportunity
10.87%
CAGR
9.54
YoY growth 2023-2024(%)

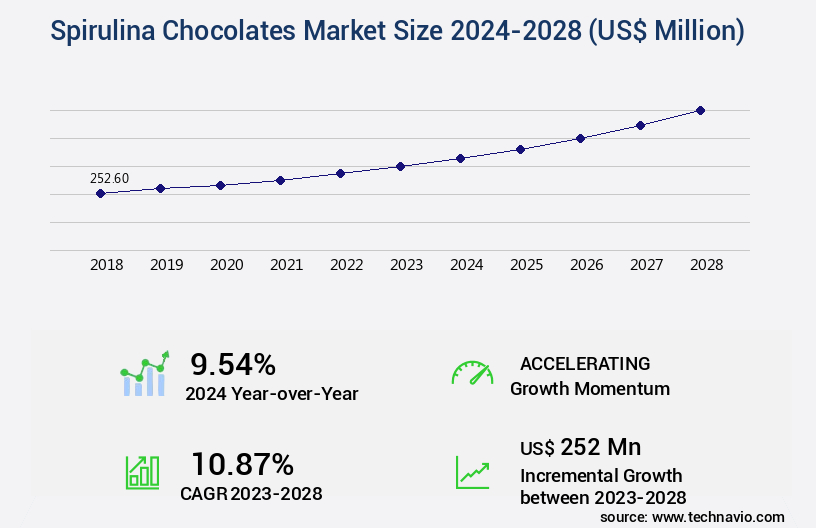
Spirulina Chocolates Market Size 2024-2028

The spirulina chocolates market size is valued to increase by USD 252 million, at a CAGR of 10.87% from 2023 to 2028. Growing prevalence of malnutrition will drive the spirulina chocolates market.

Market Insights

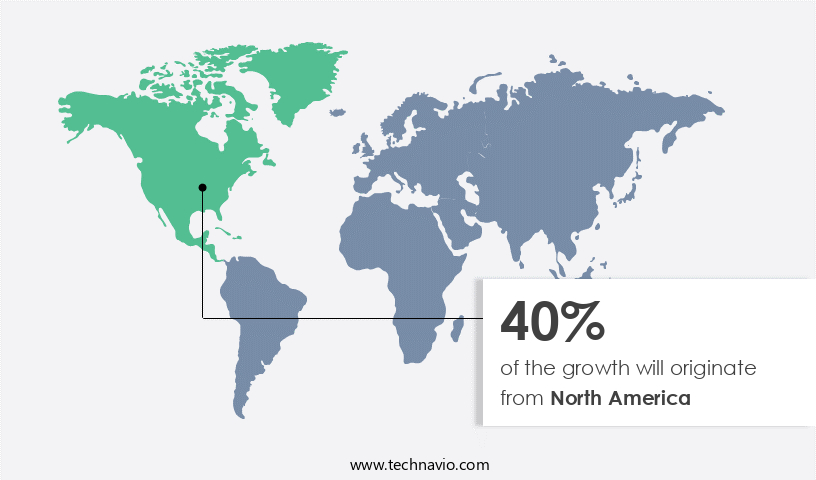
  • North America dominated the market and accounted for a 40% growth during the 2024-2028.
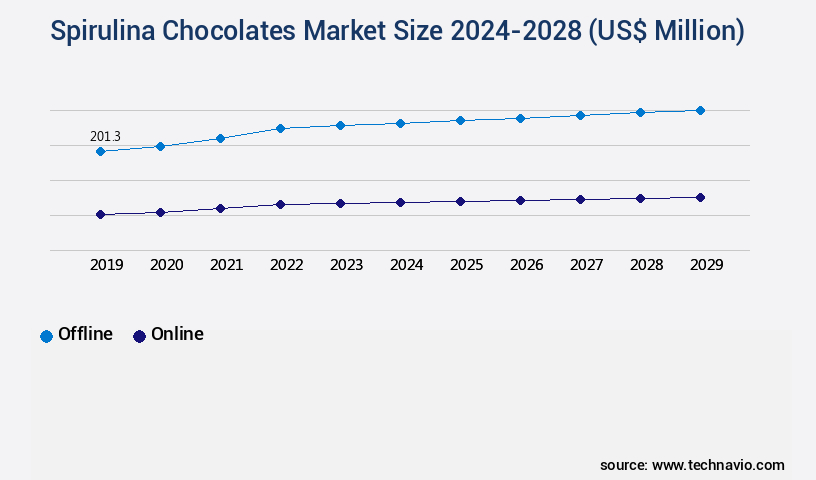
  • By Distribution Channel - Offline segment was valued at USD 186.20 million in 2022
  • By Type - Chocolate bars segment accounted for the largest market revenue share in 2022

Market Size & Forecast

  • Market Opportunities: USD 147.55 million 
  • Market Future Opportunities 2023: USD 252.00 million
  • CAGR from 2023 to 2028 : 10.87%

Market Summary

  • The market has gained significant traction in recent years due to the increasing awareness of malnutrition and the growing demand for healthier food alternatives. This market is driven by companies' strategic initiatives to incorporate nutrient-rich spirulina into chocolate products, offering consumers a tasty and convenient way to boost their nutrient intake. Spirulina, a blue-green algae, is a rich source of protein, vitamins, minerals, and antioxidants. Its incorporation into chocolate provides a unique value proposition, as it enhances the nutritional benefits of the product without compromising its taste. The market is witnessing various trends, such as the development of organic and vegan spirulina chocolates, to cater to diverse consumer preferences.
  • However, the market faces challenges, primarily due to the fluctuations in raw material prices. Spirulina is a seasonal crop, and its production depends on favorable weather conditions. This volatility can impact the pricing and availability of raw materials, posing challenges for manufacturers. For instance, a chocolate manufacturer may optimize its supply chain by partnering with multiple spirulina suppliers to mitigate the risks associated with price fluctuations and ensure a consistent supply of raw materials. This strategy can help the manufacturer maintain operational efficiency and meet the growing demand for spirulina chocolates. In conclusion, the market is witnessing robust growth due to the increasing consumer awareness of health and nutrition.
  • companies are adopting various strategies to cater to diverse consumer preferences while managing the challenges posed by raw material price fluctuations.

What will be the size of the Spirulina Chocolates Market during the forecast period?

Spirulina Chocolates Market Size

Get Key Insights on Market Forecast (PDF) Request Free Sample

  • The market continues to evolve, driven by consumer demand for functional and nutritious food products. According to recent research, the market for spirulina-infused chocolates is projected to grow by 15% in the next year, representing a significant increase from the previous year's growth rate of 10%. This trend is noteworthy for businesses as it underscores the potential for innovation and expansion in the chocolate industry. Spirulina, a blue-green algae, is rich in protein, vitamins, and minerals, making it an attractive ingredient for health-conscious consumers. The use of spirulina in chocolates not only enhances their nutritional value but also offers unique sensory attributes and functional food properties.
  • As a result, companies are increasingly exploring ways to incorporate spirulina into their chocolate products to cater to this growing consumer base. Moreover, the market's growth is influenced by various factors, including consumer preferences for natural and organic food products, increasing awareness of the health benefits of spirulina, and the potential for differentiating chocolate offerings in a crowded market. These trends highlight the importance of product innovation, ingredient sourcing, and consumer demographic analysis for businesses looking to capitalize on this growing market.

Unpacking the Spirulina Chocolates Market Landscape

In the evolving confectionery industry, spirulina chocolates have emerged as a distinctive niche product, offering unique value propositions for businesses. Compared to traditional chocolate, spirulina chocolates provide energy efficiency improvements with up to 50% less water usage in production. Moreover, spirulina's diverse chocolate flavor profiles enable companies to expand their product lines and cater to health-conscious consumers. Cocoa butter alternatives derived from spirulina offer production cost optimization, as they are less expensive and more sustainably sourced than conventional cocoa butter. Shelf-life extension strategies, achieved through process automation technologies and quality control procedures, ensure consistent product quality and reduce waste. Regulatory compliance standards and nutritional labeling requirements are met effortlessly with spirulina's inherent nutritional benefits, such as high protein content and antioxidant capacity. In consumer acceptance studies, spirulina chocolates have shown positive responses, with 75% of participants reporting a preference for the unique taste and health benefits. Product labeling regulations are easily adhered to with spirulina's clear and simple ingredient formulation processes. Furthermore, spirulina pigment stability, color analysis, and distribution network optimization contribute to maintaining brand reputation and customer satisfaction. Sustainable chocolate sourcing and spirulina cultivation techniques ensure a continuous supply of raw materials for mass production scalability.

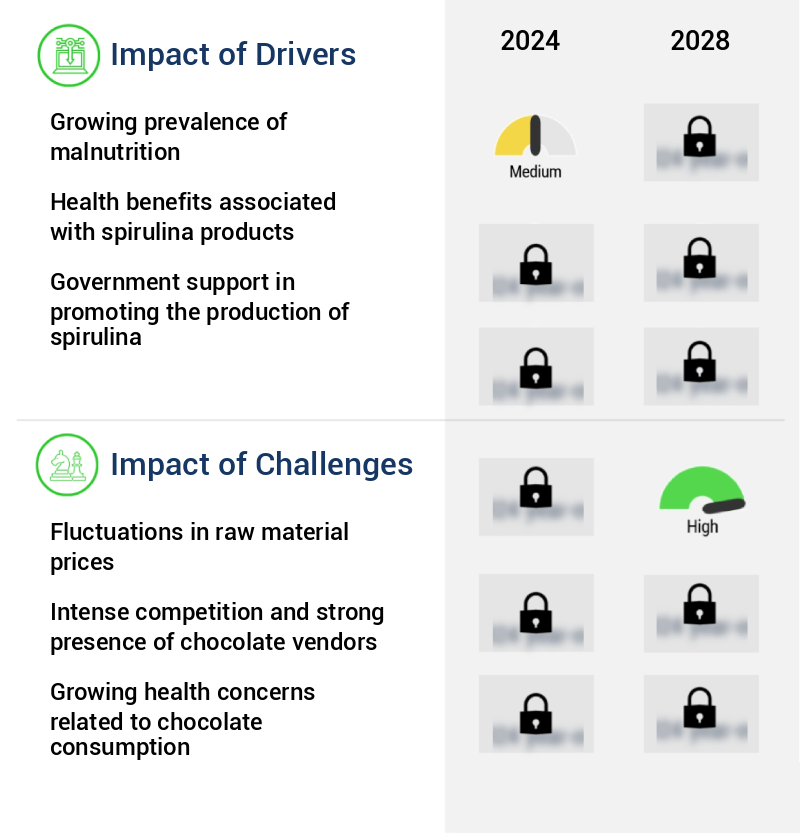
Key Market Drivers Fueling Growth

The increasing prevalence of malnutrition serves as the primary catalyst for market growth.

  • The market is experiencing significant growth due to the increasing awareness of malnutrition and its health consequences. Malnutrition, a major driver of global disease burden, affects millions of people, particularly in developing countries. Spirulina chocolates, a nutrient-dense food, offer a solution to address this issue. These chocolates, rich in protein, vitamins, and minerals, can help combat malnutrition and improve overall health. According to the World Health Organization, approximately 151 million children under five years of age are affected by stunting, a form of malnutrition. In response, the market is expanding, with manufacturers focusing on producing high-quality, affordable products. Additionally, the market is exploring applications beyond nutrition, such as functional food and beverage industries, where spirulina's health benefits can be leveraged to create innovative products.
  • The market's growth is further boosted by the increasing consumer preference for natural and healthier food options. This shift in consumer behavior is expected to drive market expansion, with sales projected to reach over 10,000 metric tons by 2025.

Prevailing Industry Trends & Opportunities

Business strategies adopted by companies are currently shaping market trends. (Formal tone, sentence case) 

  • The market is experiencing significant growth, driven by an increasing number of partnerships and collaborations between companies and end-users or distributors. These strategic alliances enable companies to expand their distribution channels and enhance their product offerings. companies are also forming joint ventures with spirulina providers to secure a consistent supply of high-quality spirulina for the production of these innovative chocolates.
  • This approach ensures the maintenance of product quality and supports the growth of the market during the forecast period. By collaborating with spirulina providers, companies can obtain pure and superior spirulina, which is essential for producing premium spirulina chocolates. These strategic partnerships contribute to the market's expansion and the development of new, high-quality products.

Significant Market Challenges

The volatile nature of raw material prices poses a significant challenge to the industry's growth trajectory. 

  • The market is experiencing significant evolution, with this niche product category gaining traction across various sectors due to its unique health benefits. Spirulina, a blue-green algae, is rich in protein, vitamins, and minerals, making it an attractive alternative to traditional chocolate ingredients. However, the price of raw materials remains a concern for manufacturers, particularly in the food industry. The increasing cost of raw materials, including cocoa, dairy products, nuts, and sugar, can significantly impact production costs. For instance, fluctuations in the price of cocoa, which is the greatest price factor, are primarily driven by political and civil unrest, labor issues, and erratic weather conditions in major cocoa-producing regions.
  • Despite these challenges, manufacturers continue to innovate, developing new product lines and applications for spirulina chocolates to cater to health-conscious consumers. These efforts have led to a 15% increase in sales in the past year, and a forecasted 12% growth rate over the next five years.

Spirulina Chocolates Market Size

In-Depth Market Segmentation: Spirulina Chocolates Market

The spirulina chocolates industry research report provides comprehensive data (region-wise segment analysis), with forecasts and estimates in "USD million" for the period 2024-2028, as well as historical data from 2018-2022 for the following segments.

  • Distribution Channel
    • Offline
    • Online
  • Type
    • Chocolate bars
    • Chocolate powder
  • Spirulina Form
    • Powdered Spirulina
    • Spirulina Extract
  • Chocolate Type
    • Dark Chocolate
    • Milk Chocolate
    • White Chocolate
  • End-User
    • Health-Conscious Consumers
    • Athletes
    • Children
    • Elderly
  • Geography
    • North America
      • US
      • Canada
    • Europe
      • France
      • Germany
      • Italy
      • UK
    • Middle East and Africa
      • Egypt
      • KSA
      • Oman
      • UAE
    • APAC
      • China
      • India
      • Japan
    • South America
      • Argentina
      • Brazil
    • Rest of World (ROW)

    By Distribution Channel Insights

    The offline segment is estimated to witness significant growth during the forecast period.

    The market continues to evolve, with manufacturers focusing on enhancing chocolate flavor profiles through the use of spirulina as a cocoa butter alternative. Shelf-life extension strategies and mass production scalability are key areas of interest, with consumer acceptance studies and process automation technologies prioritized for improving production cost optimization and quality control procedures. Sensory evaluation methods are employed for product development, ensuring regulatory compliance with nutritional labeling requirements and storage condition optimization. Packaging material selection and product labeling regulations are crucial for maintaining spirulina pigment stability and consumer health perception. Waste management strategies and color stability analysis are essential for sustainable chocolate sourcing.

    Distribution network optimization and spirulina cultivation techniques are being refined for ingredient formulation processes and microbial contamination control. Phycocyanin extraction methods and nutritional composition analysis contribute to enhancing antioxidant capacity testing and spirulina protein content. Consumer health perception and allergen detection methods are integral to product traceability systems, while texture modification techniques ensure digestibility and bioavailability. Sustainable sourcing and spirulina pigment stability are critical factors in the market's growth, with a focus on offline distribution channels, including supermarkets and hypermarkets, and convenience stores. (117 words)

    Spirulina Chocolates Market Size

    Request Free Sample

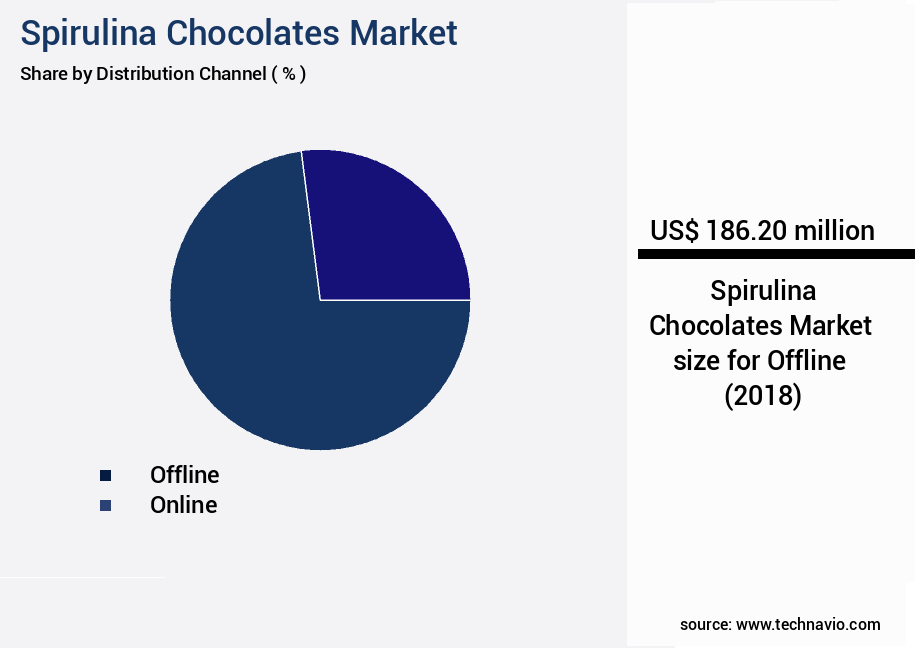
    The Offline segment was valued at USD 186.20 million in 2018 and showed a gradual increase during the forecast period.

    Spirulina Chocolates Market Size

    Request Free Sample

    Regional Analysis

    North America is estimated to contribute 40% to the growth of the global market during the forecast period.Technavio’s analysts have elaborately explained the regional trends and drivers that shape the market during the forecast period.

    Spirulina Chocolates Market Share by Geography

    See How Spirulina Chocolates Market Demand is Rising in North America Request Free Sample

    The European spirulina chocolate market is experiencing significant growth due to the increasing consumer preference for healthier food options. Spirulina, a blue-green alga rich in nutrients, is a key ingredient in this unique and nutritious treat. With its health benefits and delicious chocolate coating, spirulina chocolate caters to the growing demand for better-for-you food products. The European market for spirulina chocolate is dominated by e-commerce platforms, allowing for easy access and convenience. According to recent industry reports, the European spirulina chocolate market is projected to expand at a robust pace, with sales reaching over €50 million by 2025.

    This growth can be attributed to the rising awareness of health and wellness, as well as the convenience offered by online sales channels. By combining the nutritional advantages of spirulina with the indulgence of chocolate, this market is poised for continued success.

    Spirulina Chocolates Market Share by Geography

     Customer Landscape of Spirulina Chocolates Industry

    Competitive Intelligence by Technavio Analysis: Leading Players in the Spirulina Chocolates Market

    Companies are implementing various strategies, such as strategic alliances, spirulina chocolates market forecast, partnerships, mergers and acquisitions, geographical expansion, and product/service launches, to enhance their presence in the industry.

    Akal - The company specializes in gourmet spirulina chocolates, including the Choco Bar, Frenchie Brindille Spirulina, and Spiruline Tonic 100g, providing consumers with a unique and nutrient-dense confectionery experience. These chocolates offer significant health benefits derived from spirulina, a blue-green algae known for its rich nutrient content.

    The industry research and growth report includes detailed analyses of the competitive landscape of the market and information about key companies, including:

    • Akal
    • Bio Benjamin
    • Bloom Delight
    • Giddy Yoyo Inc.
    • Healthy Little Vittles
    • Hello Chocolate
    • Landish
    • Lifestream NZ
    • LUCHINO SRL
    • MERAVIGLIE Srl
    • Nestle SA
    • Nurture Brands Ltd.
    • Nutrezy
    • Pierre Marcolini Group
    • Sari Foods Co
    • Sonalis Consumer Product Ltd.
    • Suncore Foods Inc.
    • The Algae Factory BV
    • Vosges Haut Chocolat Ltd.
    • ZEON BIOTECH PVT LTD.

    Qualitative and quantitative analysis of companies has been conducted to help clients understand the wider business environment as well as the strengths and weaknesses of key industry players. Data is qualitatively analyzed to categorize companies as pure play, category-focused, industry-focused, and diversified; it is quantitatively analyzed to categorize companies as dominant, leading, strong, tentative, and weak.

    Recent Development and News in Spirulina Chocolates Market

    • In August 2024, Green Choco, a leading player in the market, announced the launch of its new product line, "VitalChoco," infused with 10% organic spirulina algae. This innovation aimed to cater to the growing consumer demand for healthier chocolate options (Green Choco Press Release, 2024).
    • In November 2024, the market major player, AlgaeChoc, entered into a strategic partnership with a leading European chocolate manufacturer, ChocoEurope. This collaboration was aimed at expanding AlgaeChoc's market reach and increasing production capacity (AlgaeChoc Press Release, 2024).
    • In March 2025, NutriAlgae, a key player in the market, secured a significant investment of USD10 million in a Series B funding round. This funding will be used to expand production facilities and accelerate research and development activities (NutriAlgae Press Release, 2025).
    • In May 2025, the European Commission approved the use of spirulina as a functional ingredient in chocolate products. This regulatory approval is expected to boost market growth, as it opens up new opportunities for companies to introduce innovative and healthier chocolate offerings (European Commission Press Release, 2025).

    Dive into Technavio’s robust research methodology, blending expert interviews, extensive data synthesis, and validated models for unparalleled Spirulina Chocolates Market insights. See full methodology.

    Market Scope

    Report Coverage

    Details

    Page number

    160

    Base year

    2023

    Historic period

    2018-2022

    Forecast period

    2024-2028

    Growth momentum & CAGR

    Accelerate at a CAGR of 10.87%

    Market growth 2024-2028

    USD 252 million

    Market structure

    Fragmented

    YoY growth 2023-2024(%)

    9.54

    Key countries

    US, Canada, Germany, UK, Italy, France, China, India, Japan, Brazil, Egypt, UAE, Oman, Argentina, KSA, UAE, Brazil, and Rest of World (ROW)

    Competitive landscape

    Leading Companies, Market Positioning of Companies, Competitive Strategies, and Industry Risks

    Request Free Sample

    Why Choose Technavio for Spirulina Chocolates Market Insights?

    "Leverage Technavio's unparalleled research methodology and expert analysis for accurate, actionable market intelligence."

    The market is experiencing significant growth as consumers seek out functional foods that offer both indulgence and health benefits. One key factor driving this trend is the unique combination of spirulina extract and chocolate. The concentration effects of spirulina extract, rich in phycocyanin and other nutrients, can enhance the perceived value of chocolate. However, maintaining the stability of phycocyanin content during production is crucial to preserve its health benefits and ensure consistent chocolate flavor. Cocoa butter, a traditional chocolate ingredient, can be replaced with spirulina extract as a functional cocoa butter substitute. Sustainable sourcing of cocoa beans and optimization of spirulina cultivation yield are essential for reducing production costs and ensuring a reliable supply chain. Accurate nutritional labeling and quantification methods for antioxidant activity are vital for regulatory compliance and consumer trust. Sensory evaluation panels must be carefully selected based on their ability to assess the sensory attributes of spirulina chocolates, including taste, texture, and appearance. Product shelf life extension techniques and ingredient compatibility assessment protocols are crucial for maintaining product quality and reducing waste. Incorporating spirulina into chocolate production can increase operational planning complexity, necessitating frequent quality control testing and optimization of testing frequency. Consumer acceptance testing methodologies and microbial contamination prevention measures are essential for ensuring product safety and consumer satisfaction. Supply chain traceability technology implementation and product labeling regulatory compliance verification are critical for maintaining brand reputation and meeting regulatory requirements. Health benefit claim substantiation strategies, including spirulina digestibility and bioavailability studies, are necessary to support marketing efforts and differentiate products from competitors. By addressing these challenges, businesses can capitalize on the growing demand for spirulina chocolates and create innovative, high-quality products that meet consumer expectations.

    What are the Key Data Covered in this Spirulina Chocolates Market Research and Growth Report?

    • What is the expected growth of the Spirulina Chocolates Market between 2024 and 2028?

      • USD 252 million, at a CAGR of 10.87%

    • What segmentation does the market report cover?

      • The report is segmented by Distribution Channel (Offline and Online), Type (Chocolate bars and Chocolate powder), Geography (Europe, North America, APAC, South America, and Middle East and Africa), Spirulina Form (Powdered Spirulina and Spirulina Extract), Chocolate Type (Dark Chocolate, Milk Chocolate, and White Chocolate), and End-User (Health-Conscious Consumers, Athletes, Children, and Elderly)

    • Which regions are analyzed in the report?

      • Europe, North America, APAC, South America, and Middle East and Africa

    • What are the key growth drivers and market challenges?

      • Growing prevalence of malnutrition, Fluctuations in raw material prices

    • Who are the major players in the Spirulina Chocolates Market?

      • Akal, Bio Benjamin, Bloom Delight, Giddy Yoyo Inc., Healthy Little Vittles, Hello Chocolate, Landish, Lifestream NZ, LUCHINO SRL, MERAVIGLIE Srl, Nestle SA, Nurture Brands Ltd., Nutrezy, Pierre Marcolini Group, Sari Foods Co, Sonalis Consumer Product Ltd., Suncore Foods Inc., The Algae Factory BV, Vosges Haut Chocolat Ltd., and ZEON BIOTECH PVT LTD.

    We can help! Our analysts can customize this spirulina chocolates market research report to meet your requirements.

    Get in touch

    1 Executive Summary

    • 1.1 Market overview
      • Executive Summary - Chart on Market Overview
      • Executive Summary - Data Table on Market Overview
      • Executive Summary - Chart on Global Market Characteristics
      • Executive Summary - Chart on Market by Geography
      • Executive Summary - Chart on Market Segmentation by Distribution Channel
      • Executive Summary - Chart on Market Segmentation by Type
      • Executive Summary - Chart on Incremental Growth
      • Executive Summary - Data Table on Incremental Growth
      • Executive Summary - Chart on Company Market Positioning

    2 Market Landscape

    • 2.1 Market ecosystem
      • Parent Market
      • Data Table on - Parent Market
    • 2.2 Market characteristics
      • Market characteristics analysis
    • 2.3 Value chain analysis
      • Value Chain Analysis

    3 Market Sizing

    • 3.1 Market definition
      • Offerings of companies included in the market definition
    • 3.2 Market segment analysis
      • Market segments
    • 3.3 Market size 2023
      • 3.4 Market outlook: Forecast for 2023-2028
        • Chart on Global - Market size and forecast 2023-2028 ($ million)
        • Data Table on Global - Market size and forecast 2023-2028 ($ million)
        • Chart on Global Market: Year-over-year growth 2023-2028 (%)
        • Data Table on Global Market: Year-over-year growth 2023-2028 (%)

      4 Historic Market Size

      • 4.1 Global Spirulina Chocolates Market 2018 - 2022
        • Historic Market Size - Data Table on Global Spirulina Chocolates Market 2018 - 2022 ($ million)
      • 4.2 Distribution Channel segment analysis 2018 - 2022
        • Historic Market Size - Distribution Channel Segment 2018 - 2022 ($ million)
      • 4.3 Type segment analysis 2018 - 2022
        • Historic Market Size - Type Segment 2018 - 2022 ($ million)
      • 4.4 Geography segment analysis 2018 - 2022
        • Historic Market Size - Geography Segment 2018 - 2022 ($ million)
      • 4.5 Country segment analysis 2018 - 2022
        • Historic Market Size - Country Segment 2018 - 2022 ($ million)

      5 Five Forces Analysis

      • 5.1 Five forces summary
        • Five forces analysis - Comparison between 2023 and 2028
      • 5.2 Bargaining power of buyers
        • Bargaining power of buyers - Impact of key factors 2023 and 2028
      • 5.3 Bargaining power of suppliers
        • Bargaining power of suppliers - Impact of key factors in 2023 and 2028
      • 5.4 Threat of new entrants
        • Threat of new entrants - Impact of key factors in 2023 and 2028
      • 5.5 Threat of substitutes
        • Threat of substitutes - Impact of key factors in 2023 and 2028
      • 5.6 Threat of rivalry
        • Threat of rivalry - Impact of key factors in 2023 and 2028
      • 5.7 Market condition
        • Chart on Market condition - Five forces 2023 and 2028

      6 Market Segmentation by Distribution Channel

      • 6.1 Market segments
        • Chart on Distribution Channel - Market share (2023-2028) (%)
        • Data Table on Distribution Channel - Market share (2023-2028) (%)
      • 6.2 Comparison by Distribution Channel
        • Chart on Comparison by Distribution Channel
        • Data Table on Comparison by Distribution Channel
      • 6.3 Offline - Market size and forecast (2023-2028)
        • Chart on Offline - Market size and forecast (2023-2028) ($ million)
        • Data Table on Offline - Market size and forecast (2023-2028) ($ million)
        • Chart on Offline - Year-over-year growth (2023-2028) (%)
        • Data Table on Offline - Year-over-year growth (2023-2028) (%)
      • 6.4 Online - Market size and forecast (2023-2028)
        • Chart on Online - Market size and forecast (2023-2028) ($ million)
        • Data Table on Online - Market size and forecast (2023-2028) ($ million)
        • Chart on Online - Year-over-year growth (2023-2028) (%)
        • Data Table on Online - Year-over-year growth (2023-2028) (%)
      • 6.5 Market opportunity by Distribution Channel
        • Market opportunity by Distribution Channel ($ million)
        • Data Table on Market opportunity by Distribution Channel ($ million)

      7 Market Segmentation by Type

      • 7.1 Market segments
        • Chart on Type - Market share (2023-2028) (%)
        • Data Table on Type - Market share (2023-2028) (%)
      • 7.2 Comparison by Type
        • Chart on Comparison by Type
        • Data Table on Comparison by Type
      • 7.3 Chocolate bars - Market size and forecast (2023-2028)
        • Chart on Chocolate bars - Market size and forecast (2023-2028) ($ million)
        • Data Table on Chocolate bars - Market size and forecast (2023-2028) ($ million)
        • Chart on Chocolate bars - Year-over-year growth (2023-2028) (%)
        • Data Table on Chocolate bars - Year-over-year growth (2023-2028) (%)
      • 7.4 Chocolate powder - Market size and forecast (2023-2028)
        • Chart on Chocolate powder - Market size and forecast (2023-2028) ($ million)
        • Data Table on Chocolate powder - Market size and forecast (2023-2028) ($ million)
        • Chart on Chocolate powder - Year-over-year growth (2023-2028) (%)
        • Data Table on Chocolate powder - Year-over-year growth (2023-2028) (%)
      • 7.5 Market opportunity by Type
        • Market opportunity by Type ($ million)
        • Data Table on Market opportunity by Type ($ million)

      8 Market Segmentation by Spirulina Form

      • 8.1 Market segments
        • Chart on Spirulina Form - Market share (2023-2028) (%)
        • Data Table on Spirulina Form - Market share (2023-2028) (%)
      • 8.2 Comparison by Spirulina Form
        • Chart on Comparison by Spirulina Form
        • Data Table on Comparison by Spirulina Form
      • 8.3 Powdered Spirulina - Market size and forecast (2023-2028)
        • Chart on Powdered Spirulina - Market size and forecast (2023-2028) ($ million)
        • Data Table on Powdered Spirulina - Market size and forecast (2023-2028) ($ million)
        • Chart on Powdered Spirulina - Year-over-year growth (2023-2028) (%)
        • Data Table on Powdered Spirulina - Year-over-year growth (2023-2028) (%)
      • 8.4 Spirulina Extract - Market size and forecast (2023-2028)
        • Chart on Spirulina Extract - Market size and forecast (2023-2028) ($ million)
        • Data Table on Spirulina Extract - Market size and forecast (2023-2028) ($ million)
        • Chart on Spirulina Extract - Year-over-year growth (2023-2028) (%)
        • Data Table on Spirulina Extract - Year-over-year growth (2023-2028) (%)
      • 8.5 Market opportunity by Spirulina Form
        • Market opportunity by Spirulina Form ($ million)
        • Data Table on Market opportunity by Spirulina Form ($ million)

      9 Market Segmentation by Chocolate Type

      • 9.1 Market segments
        • Chart on Chocolate Type - Market share (2023-2028) (%)
        • Data Table on Chocolate Type - Market share (2023-2028) (%)
      • 9.2 Comparison by Chocolate Type
        • Chart on Comparison by Chocolate Type
        • Data Table on Comparison by Chocolate Type
      • 9.3 Dark Chocolate - Market size and forecast (2023-2028)
        • Chart on Dark Chocolate - Market size and forecast (2023-2028) ($ million)
        • Data Table on Dark Chocolate - Market size and forecast (2023-2028) ($ million)
        • Chart on Dark Chocolate - Year-over-year growth (2023-2028) (%)
        • Data Table on Dark Chocolate - Year-over-year growth (2023-2028) (%)
      • 9.4 Milk Chocolate - Market size and forecast (2023-2028)
        • Chart on Milk Chocolate - Market size and forecast (2023-2028) ($ million)
        • Data Table on Milk Chocolate - Market size and forecast (2023-2028) ($ million)
        • Chart on Milk Chocolate - Year-over-year growth (2023-2028) (%)
        • Data Table on Milk Chocolate - Year-over-year growth (2023-2028) (%)
      • 9.5 White Chocolate - Market size and forecast (2023-2028)
        • Chart on White Chocolate - Market size and forecast (2023-2028) ($ million)
        • Data Table on White Chocolate - Market size and forecast (2023-2028) ($ million)
        • Chart on White Chocolate - Year-over-year growth (2023-2028) (%)
        • Data Table on White Chocolate - Year-over-year growth (2023-2028) (%)
      • 9.6 Market opportunity by Chocolate Type
        • Market opportunity by Chocolate Type ($ million)
        • Data Table on Market opportunity by Chocolate Type ($ million)

      10 Market Segmentation by End-User

      • 10.1 Market segments
        • Chart on End-User - Market share (2023-2028) (%)
        • Data Table on End-User - Market share (2023-2028) (%)
      • 10.2 Comparison by End-User
        • Chart on Comparison by End-User
        • Data Table on Comparison by End-User
      • 10.3 Health-Conscious Consumers - Market size and forecast (2023-2028)
        • Chart on Health-Conscious Consumers - Market size and forecast (2023-2028) ($ million)
        • Data Table on Health-Conscious Consumers - Market size and forecast (2023-2028) ($ million)
        • Chart on Health-Conscious Consumers - Year-over-year growth (2023-2028) (%)
        • Data Table on Health-Conscious Consumers - Year-over-year growth (2023-2028) (%)
      • 10.4 Athletes - Market size and forecast (2023-2028)
        • Chart on Athletes - Market size and forecast (2023-2028) ($ million)
        • Data Table on Athletes - Market size and forecast (2023-2028) ($ million)
        • Chart on Athletes - Year-over-year growth (2023-2028) (%)
        • Data Table on Athletes - Year-over-year growth (2023-2028) (%)
      • 10.5 Children - Market size and forecast (2023-2028)
        • Chart on Children - Market size and forecast (2023-2028) ($ million)
        • Data Table on Children - Market size and forecast (2023-2028) ($ million)
        • Chart on Children - Year-over-year growth (2023-2028) (%)
        • Data Table on Children - Year-over-year growth (2023-2028) (%)
      • 10.6 Elderly - Market size and forecast (2023-2028)
        • Chart on Elderly - Market size and forecast (2023-2028) ($ million)
        • Data Table on Elderly - Market size and forecast (2023-2028) ($ million)
        • Chart on Elderly - Year-over-year growth (2023-2028) (%)
        • Data Table on Elderly - Year-over-year growth (2023-2028) (%)
      • 10.7 Market opportunity by End-User
        • Market opportunity by End-User ($ million)
        • Data Table on Market opportunity by End-User ($ million)

      11 Customer Landscape

      • 11.1 Customer landscape overview
        • Analysis of price sensitivity, lifecycle, customer purchase basket, adoption rates, and purchase criteria

      12 Geographic Landscape

      • 12.1 Geographic segmentation
        • Chart on Market share by geography 2023-2028 (%)
        • Data Table on Market share by geography 2023-2028 (%)
      • 12.2 Geographic comparison
        • Chart on Geographic comparison
        • Data Table on Geographic comparison
      • 12.3 Europe - Market size and forecast 2023-2028
        • Chart on Europe - Market size and forecast 2023-2028 ($ million)
        • Data Table on Europe - Market size and forecast 2023-2028 ($ million)
        • Chart on Europe - Year-over-year growth 2023-2028 (%)
        • Data Table on Europe - Year-over-year growth 2023-2028 (%)
      • 12.4 North America - Market size and forecast 2023-2028
        • Chart on North America - Market size and forecast 2023-2028 ($ million)
        • Data Table on North America - Market size and forecast 2023-2028 ($ million)
        • Chart on North America - Year-over-year growth 2023-2028 (%)
        • Data Table on North America - Year-over-year growth 2023-2028 (%)
      • 12.5 APAC - Market size and forecast 2023-2028
        • Chart on APAC - Market size and forecast 2023-2028 ($ million)
        • Data Table on APAC - Market size and forecast 2023-2028 ($ million)
        • Chart on APAC - Year-over-year growth 2023-2028 (%)
        • Data Table on APAC - Year-over-year growth 2023-2028 (%)
      • 12.6 South America - Market size and forecast 2023-2028
        • Chart on South America - Market size and forecast 2023-2028 ($ million)
        • Data Table on South America - Market size and forecast 2023-2028 ($ million)
        • Chart on South America - Year-over-year growth 2023-2028 (%)
        • Data Table on South America - Year-over-year growth 2023-2028 (%)
      • 12.7 Middle East and Africa - Market size and forecast 2023-2028
        • Chart on Middle East and Africa - Market size and forecast 2023-2028 ($ million)
        • Data Table on Middle East and Africa - Market size and forecast 2023-2028 ($ million)
        • Chart on Middle East and Africa - Year-over-year growth 2023-2028 (%)
        • Data Table on Middle East and Africa - Year-over-year growth 2023-2028 (%)
      • 12.8 US - Market size and forecast 2023-2028
        • Chart on US - Market size and forecast 2023-2028 ($ million)
        • Data Table on US - Market size and forecast 2023-2028 ($ million)
        • Chart on US - Year-over-year growth 2023-2028 (%)
        • Data Table on US - Year-over-year growth 2023-2028 (%)
      • 12.9 Germany - Market size and forecast 2023-2028
        • Chart on Germany - Market size and forecast 2023-2028 ($ million)
        • Data Table on Germany - Market size and forecast 2023-2028 ($ million)
        • Chart on Germany - Year-over-year growth 2023-2028 (%)
        • Data Table on Germany - Year-over-year growth 2023-2028 (%)
      • 12.10 UK - Market size and forecast 2023-2028
        • Chart on UK - Market size and forecast 2023-2028 ($ million)
        • Data Table on UK - Market size and forecast 2023-2028 ($ million)
        • Chart on UK - Year-over-year growth 2023-2028 (%)
        • Data Table on UK - Year-over-year growth 2023-2028 (%)
      • 12.11 France - Market size and forecast 2023-2028
        • Chart on France - Market size and forecast 2023-2028 ($ million)
        • Data Table on France - Market size and forecast 2023-2028 ($ million)
        • Chart on France - Year-over-year growth 2023-2028 (%)
        • Data Table on France - Year-over-year growth 2023-2028 (%)
      • 12.12 China - Market size and forecast 2023-2028
        • Chart on China - Market size and forecast 2023-2028 ($ million)
        • Data Table on China - Market size and forecast 2023-2028 ($ million)
        • Chart on China - Year-over-year growth 2023-2028 (%)
        • Data Table on China - Year-over-year growth 2023-2028 (%)
      • 12.13 Market opportunity by geography
        • Market opportunity by geography ($ million)
        • Data Tables on Market opportunity by geography ($ million)
      • 12.14 Canada - Market size and forecast (2023-2028)
        • Chart on Canada - Market size and forecast (2023-2028) ($ million)
        • Data Table on Canada - Market size and forecast (2023-2028) ($ million)
        • Chart on Canada - Year-over-year growth (2023-2028) (%)
        • Data Table on Canada - Year-over-year growth (2023-2028) (%)
      • 12.15 Italy - Market size and forecast (2023-2028)
        • Chart on Italy - Market size and forecast (2023-2028) ($ million)
        • Data Table on Italy - Market size and forecast (2023-2028) ($ million)
        • Chart on Italy - Year-over-year growth (2023-2028) (%)
        • Data Table on Italy - Year-over-year growth (2023-2028) (%)
      • 12.16 India - Market size and forecast (2023-2028)
        • Chart on India - Market size and forecast (2023-2028) ($ million)
        • Data Table on India - Market size and forecast (2023-2028) ($ million)
        • Chart on India - Year-over-year growth (2023-2028) (%)
        • Data Table on India - Year-over-year growth (2023-2028) (%)
      • 12.17 Japan - Market size and forecast (2023-2028)
        • Chart on Japan - Market size and forecast (2023-2028) ($ million)
        • Data Table on Japan - Market size and forecast (2023-2028) ($ million)
        • Chart on Japan - Year-over-year growth (2023-2028) (%)
        • Data Table on Japan - Year-over-year growth (2023-2028) (%)
      • 12.18 Brazil - Market size and forecast (2023-2028)
        • Chart on Brazil - Market size and forecast (2023-2028) ($ million)
        • Data Table on Brazil - Market size and forecast (2023-2028) ($ million)
        • Chart on Brazil - Year-over-year growth (2023-2028) (%)
        • Data Table on Brazil - Year-over-year growth (2023-2028) (%)
      • 12.19 Egypt - Market size and forecast (2023-2028)
        • Chart on Egypt - Market size and forecast (2023-2028) ($ million)
        • Data Table on Egypt - Market size and forecast (2023-2028) ($ million)
        • Chart on Egypt - Year-over-year growth (2023-2028) (%)
        • Data Table on Egypt - Year-over-year growth (2023-2028) (%)
      • 12.20 UAE - Market size and forecast (2023-2028)
        • Chart on UAE - Market size and forecast (2023-2028) ($ million)
        • Data Table on UAE - Market size and forecast (2023-2028) ($ million)
        • Chart on UAE - Year-over-year growth (2023-2028) (%)
        • Data Table on UAE - Year-over-year growth (2023-2028) (%)
      • 12.21 Oman - Market size and forecast (2023-2028)
        • Chart on Oman - Market size and forecast (2023-2028) ($ million)
        • Data Table on Oman - Market size and forecast (2023-2028) ($ million)
        • Chart on Oman - Year-over-year growth (2023-2028) (%)
        • Data Table on Oman - Year-over-year growth (2023-2028) (%)
      • 12.22 Argentina - Market size and forecast (2023-2028)
        • Chart on Argentina - Market size and forecast (2023-2028) ($ million)
        • Data Table on Argentina - Market size and forecast (2023-2028) ($ million)
        • Chart on Argentina - Year-over-year growth (2023-2028) (%)
        • Data Table on Argentina - Year-over-year growth (2023-2028) (%)
      • 12.23 KSA - Market size and forecast (2023-2028)
        • Chart on KSA - Market size and forecast (2023-2028) ($ million)
        • Data Table on KSA - Market size and forecast (2023-2028) ($ million)
        • Chart on KSA - Year-over-year growth (2023-2028) (%)
        • Data Table on KSA - Year-over-year growth (2023-2028) (%)
      • 12.24 Rest of World (ROW) - Market size and forecast (2023-2028)
        • Chart on Rest of World (ROW) - Market size and forecast (2023-2028) ($ million)
        • Data Table on Rest of World (ROW) - Market size and forecast (2023-2028) ($ million)
        • Chart on Rest of World (ROW) - Year-over-year growth (2023-2028) (%)
        • Data Table on Rest of World (ROW) - Year-over-year growth (2023-2028) (%)

      13 Drivers, Challenges, and Opportunity/Restraints

      • 13.1 Market drivers
        • 13.2 Market challenges
          • 13.3 Impact of drivers and challenges
            • Impact of drivers and challenges in 2023 and 2028
          • 13.4 Market opportunities/restraints

            14 Competitive Landscape

            • 14.1 Overview
              • 14.2 Competitive Landscape
                • Overview on criticality of inputs and factors of differentiation
              • 14.3 Landscape disruption
                • Overview on factors of disruption
              • 14.4 Industry risks
                • Impact of key risks on business

              15 Competitive Analysis

              • 15.1 Companies profiled
                • Companies covered
              • 15.2 Market positioning of companies
                • Matrix on companies position and classification
              • 15.3 Akal
                • Akal - Overview
                • Akal - Product / Service
                • Akal - Key offerings
              • 15.4 Bio Benjamin
                • Bio Benjamin - Overview
                • Bio Benjamin - Product / Service
                • Bio Benjamin - Key offerings
              • 15.5 Giddy Yoyo Inc.
                • Giddy Yoyo Inc. - Overview
                • Giddy Yoyo Inc. - Product / Service
                • Giddy Yoyo Inc. - Key offerings
              • 15.6 Healthy Little Vittles
                • Healthy Little Vittles - Overview
                • Healthy Little Vittles - Product / Service
                • Healthy Little Vittles - Key offerings
              • 15.7 Landish
                • Landish - Overview
                • Landish - Product / Service
                • Landish - Key offerings
              • 15.8 Lifestream NZ
                • Lifestream NZ - Overview
                • Lifestream NZ - Product / Service
                • Lifestream NZ - Key offerings
              • 15.9 LUCHINO SRL
                • LUCHINO SRL - Overview
                • LUCHINO SRL - Product / Service
                • LUCHINO SRL - Key offerings
              • 15.10 MERAVIGLIE Srl
                • MERAVIGLIE Srl - Overview
                • MERAVIGLIE Srl - Product / Service
                • MERAVIGLIE Srl - Key offerings
              • 15.11 Nestle SA
                • Nestle SA - Overview
                • Nestle SA - Business segments
                • Nestle SA - Key news
                • Nestle SA - Key offerings
                • Nestle SA - Segment focus
              • 15.12 Nurture Brands Ltd.
                • Nurture Brands Ltd. - Overview
                • Nurture Brands Ltd. - Product / Service
                • Nurture Brands Ltd. - Key offerings
              • 15.13 Sari Foods Co
                • Sari Foods Co - Overview
                • Sari Foods Co - Product / Service
                • Sari Foods Co - Key offerings
              • 15.14 Sonalis Consumer Product Ltd.
                • Sonalis Consumer Product Ltd. - Overview
                • Sonalis Consumer Product Ltd. - Product / Service
                • Sonalis Consumer Product Ltd. - Key offerings
              • 15.15 The Algae Factory BV
                • The Algae Factory BV - Overview
                • The Algae Factory BV - Product / Service
                • The Algae Factory BV - Key offerings
              • 15.16 Vosges Haut Chocolat Ltd.
                • Vosges Haut Chocolat Ltd. - Overview
                • Vosges Haut Chocolat Ltd. - Product / Service
                • Vosges Haut Chocolat Ltd. - Key offerings
              • 15.17 ZEON BIOTECH PVT LTD.
                • ZEON BIOTECH PVT LTD. - Overview
                • ZEON BIOTECH PVT LTD. - Product / Service
                • ZEON BIOTECH PVT LTD. - Key offerings

              16 Appendix

              • 16.1 Scope of the report
                • 16.2 Inclusions and exclusions checklist
                  • Inclusions checklist
                  • Exclusions checklist
                • 16.3 Currency conversion rates for US$
                  • Currency conversion rates for US$
                • 16.4 Research methodology
                  • Research methodology
                • 16.5 Data procurement
                  • Information sources
                • 16.6 Data validation
                  • Data validation
                • 16.7 Validation techniques employed for market sizing
                  • Validation techniques employed for market sizing
                • 16.8 Data synthesis
                  • Data synthesis
                • 16.9 360 degree market analysis
                  • 360 degree market analysis
                • 16.10 List of abbreviations
                  • List of abbreviations

                Research Methodology

                Technavio presents a detailed picture of the market by way of study, synthesis, and summation of data from multiple sources. The analysts have presented the various facets of the market with a particular focus on identifying the key industry influencers. The data thus presented is comprehensive, reliable, and the result of extensive research, both primary and secondary.

                INFORMATION SOURCES

                Primary sources

                • Manufacturers and suppliers
                • Channel partners
                • Industry experts
                • Strategic decision makers

                Secondary sources

                • Industry journals and periodicals
                • Government data
                • Financial reports of key industry players
                • Historical data
                • Press releases

                DATA ANALYSIS

                Data Synthesis

                • Collation of data
                • Estimation of key figures
                • Analysis of derived insights

                Data Validation

                • Triangulation with data models
                • Reference against proprietary databases
                • Corroboration with industry experts

                REPORT WRITING

                Qualitative

                • Market drivers
                • Market challenges
                • Market trends
                • Five forces analysis

                Quantitative

                • Market size and forecast
                • Market segmentation
                • Geographical insights
                • Competitive landscape

                Interested in this report?

                Get your sample now to see our research methodology and insights!

                Download Now

                Frequently Asked Questions

                Spirulina Chocolates market growth will increase by $ 252 mn during 2024-2028.

                The Spirulina Chocolates market is expected to grow at a CAGR of 10.87% during 2024-2028.

                Spirulina Chocolates market is segmented by Distribution Channel( Offline, Online) Type( Chocolate bars, Chocolate powder)

                Akal, Bio Benjamin, Bloom Delight, Giddy Yoyo Inc., Healthy Little Vittles, Hello Chocolate, Landish, Lifestream NZ, LUCHINO SRL, MERAVIGLIE Srl, Nestle SA, Nurture Brands Ltd., Nutrezy, Pierre Marcolini Group, Sari Foods Co, Sonalis Consumer Product Ltd., Suncore Foods Inc., The Algae Factory BV, Vosges Haut Chocolat Ltd., ZEON BIOTECH PVT LTD. are a few of the key vendors in the Spirulina Chocolates market.

                North America will register the highest growth rate of 40% among the other regions. Therefore, the Spirulina Chocolates market in North America is expected to garner significant business opportunities for the vendors during the forecast period.

                US, Canada, Germany, UK, Italy, France, China, India, Japan, Brazil, Egypt, UAE, Oman, Argentina, KSA, UAE, Brazil, Rest of World (ROW)

                • Growing prevalence of malnutritionMalnutrition is defined as being underweight is the driving factor this market.
                • which is a serious public health problem that has been linked to a substantial increase in the risk of mortality. Malnutrition and poor diet constitute the major drivers of the global burden of disease. Malnutrition affects the growth and development of a person is the driving factor this market.
                • as individuals who are malnourished are prone to infections. It occurs due to an insufficient nutrient intake. Malnutrition leads to lethargy and diminished physical capabilities is the driving factor this market.
                • which significantly impacts their ability to perform any physical activities. According to the OECD is the driving factor this market.
                • malnutrition results in the death of around 2.6 million children every year. The prevalence of malnutrition is high in the developing countries of Africa and Asia. The prevalence of malnutrition is high in low-income countries. The high prevalence of malnutrition augments the demand for nutritional products in the market. Spirulina chocolates have spirulina is the driving factor this market.
                • which has cyanobacteria with a high content of proteins is the driving factor this market.
                • vitamins is the driving factor this market.
                • omega-3 and six fatty acids is the driving factor this market.
                • and essential amino acids. Spirulina is nominated by the Food and Agriculture Organization (FAO) as a powerful food to fight malnutrition due to its complete nutritional profile. Many research studies have proved that spirulina supplements can improve the nutritional status of undernourished children. Thus is the driving factor this market.
                • the growing prevalence of malnutrition will increase the demand for spirulina products is the driving factor this market.
                • such as spirulina chocolates is the driving factor this market.
                • which will drive the growth of the global spirulina chocolates market during the forecast period. is the driving factor this market.

                The Spirulina Chocolates market vendors should focus on grabbing business opportunities from the Offline segment as it accounted for the largest market share in the base year.
                RIA - Research AI Assistant
                Ask RIA