Sports Mouthguard Market Analysis, Size, and Forecast 2026-2030: North America (US, Canada, and Mexico), Europe (Germany, UK, and France), APAC (China, Japan, and India), South America (Brazil, Argentina, and Colombia), Middle East and Africa (South Africa, Saudi Arabia, and UAE), and Rest of World (ROW)

Sports Mouthguard Market Analysis, Size, and Forecast 2026-2030:
North America (US, Canada, and Mexico), Europe (Germany, UK, and France), APAC (China, Japan, and India), South America (Brazil, Argentina, and Colombia), Middle East and Africa (South Africa, Saudi Arabia, and UAE), and Rest of World (ROW)

Published: Dec 2025 289 Pages SKU: IRTNTR76522

Market Overview at a Glance

$1.44 B
Market Opportunity
5.7%
CAGR 2025 - 2030
38.5%
North America Growth
$1.94 B
Boil and bite mouth guard segment 2024

Sports Mouthguard Market Size 2026-2030

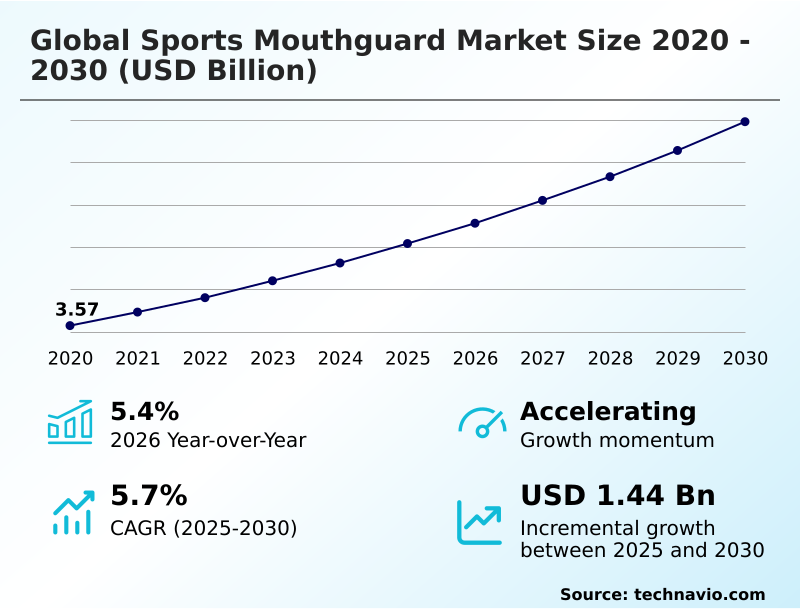
The sports mouthguard market size is valued to increase by USD 1.44 billion, at a CAGR of 5.7% from 2025 to 2030. Rising implementation of strict player welfare mandates will drive the sports mouthguard market.

Major Market Trends & Insights

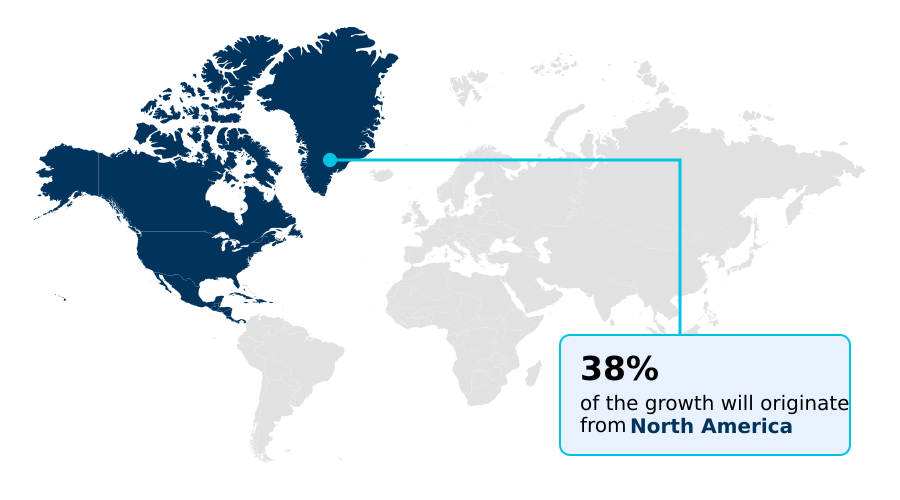
  • North America dominated the market and accounted for a 38.5% growth during the forecast period.
  • By Product Type - Boil and bite mouth guard segment was valued at USD 1.94 billion in 2024
  • By Distribution Channel - Offline segment accounted for the largest market revenue share in 2024

Market Size & Forecast

  • Market Opportunities: USD 2.40 billion
  • Market Future Opportunities: USD 1.44 billion
  • CAGR from 2025 to 2030 : 5.7%

Market Summary

  • The sports mouthguard market is undergoing a significant transformation, moving beyond simple protective equipment to technologically advanced safety systems. This evolution is driven by heightened awareness of long-term athlete health and stringent player welfare mandates that now require more than basic protection.
  • Innovation in polymer engineering is leading to superior pre-formed configurations and specialized lip guard designs with enhanced airflow channels for better performance. A pivotal shift is occurring in manufacturing, where digital workflows incorporating intraoral scanning and chairside fabrication are replacing traditional methods, allowing for greater customization and precision.
  • This digital wave extends to the product itself, with the integration of sensors for data analytics capabilities. A key business scenario involves companies offering home impression kits, which democratize access to custom-fit technology without requiring a dental visit.
  • However, the reliability of these smart devices is a critical concern, necessitating continuous firmware refinement and algorithm calibration to ensure data integrity and user trust.
  • The market is thus characterized by a dual focus: enhancing the material science of passive protection while simultaneously navigating the complexities of embedding reliable, active monitoring technology into athletic gear, ultimately changing the value proposition from a simple device to a comprehensive safety service.

What will be the Size of the Sports Mouthguard Market during the forecast period?

Get Key Insights on Market Forecast (PDF) Request Free Sample

How is the Sports Mouthguard Market Segmented?

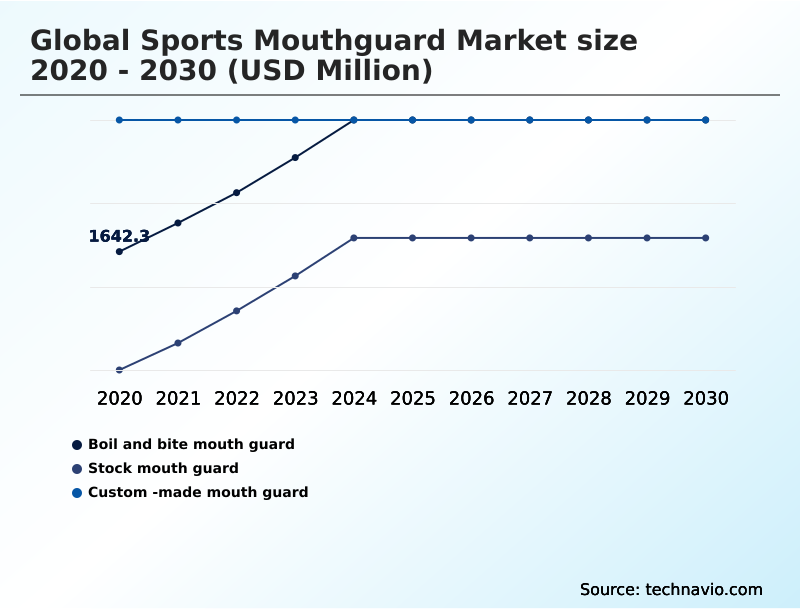
The sports mouthguard industry research report provides comprehensive data (region-wise segment analysis), with forecasts and estimates in "USD million" for the period 2026-2030, as well as historical data from 2020-2024 for the following segments.

  • Product type
    • Boil and bite mouth guard
    • Stock mouth guard
    • Custom-made mouth guard
  • Distribution channel
    • Offline
    • Online
  • Material
    • Ethylene vinyl acetate
    • Natural rubber
    • Acrylic resins
  • Geography
    • North America
      • US
      • Canada
      • Mexico
    • Europe
      • Germany
      • UK
      • France
    • APAC
      • China
      • Japan
      • India
    • South America
      • Brazil
      • Argentina
      • Colombia
    • Middle East and Africa
      • South Africa
      • Saudi Arabia
      • UAE
    • Rest of World (ROW)

By Product Type Insights

The boil and bite mouth guard segment is estimated to witness significant growth during the forecast period.

The boil-and-bite segment, predominantly using ethylene vinyl acetate (EVA), serves as a crucial market bridge by employing thermoplastic adaptation for user molding. Innovations include multi-layered construction, integrating a soft gel-like inner liner with a harder shell for superior impact absorption.

To meet rising player welfare mandates, manufacturers now incorporate antimicrobial properties. This segment addresses the demand for affordable custom-fit technology alternatives, appealing to consumers facing economic barriers.

Its evolution is also shaped by aesthetic diversification, making it a high-volume category that balances cost with performance, contributing to over 38% of new growth opportunities in the North America region.

Request Free Sample

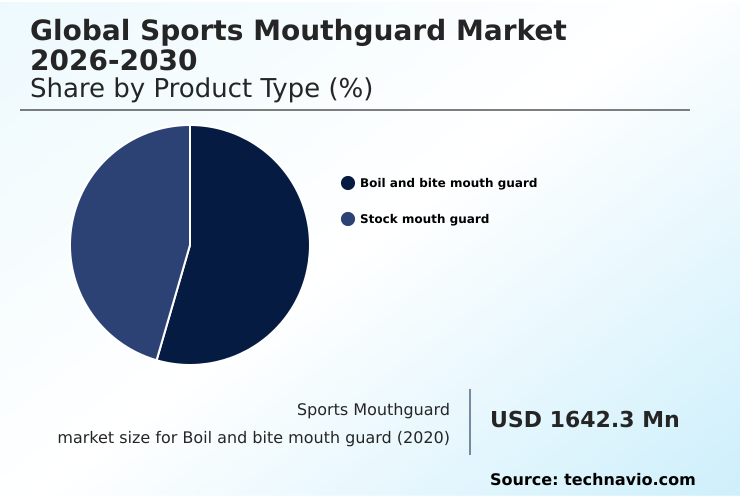
The Boil and bite mouth guard segment was valued at USD 1.94 billion in 2024 and showed a gradual increase during the forecast period.

Request Free Sample

Regional Analysis

North America is estimated to contribute 38.5% to the growth of the global market during the forecast period.Technavio’s analysts have elaborately explained the regional trends and drivers that shape the market during the forecast period.

See How Sports Mouthguard Market Demand is Rising in North America Request Free Sample

The North America region is seeing rapid adoption of intraoral scanning to combat dental trauma. Europe is pioneering the use of guards with embedded accelerometers and gyroscopes, requiring constant firmware refinement to ensure data accuracy.

The APAC market shows a strong contrast between advanced adoption in Australia and the reliance on legacy manufacturing in developing economies.

A major hurdle across all emerging regions is achieving mass market penetration for devices made from advanced protective polymer, as costs remain high.

This geographic variance highlights the global challenge of balancing technological innovation with market accessibility, with some custom digital workflows proving over 50% more efficient than traditional supply chains.

Market Dynamics

Our researchers analyzed the data with 2025 as the base year, along with the key drivers, trends, and challenges. A holistic analysis of drivers will help companies refine their marketing strategies to gain a competitive advantage.

  • The strategic direction of the sports mouthguard market is increasingly influenced by detailed performance evaluations and specific use-case demands. The debate over boil and bite vs custom-made mouthguards continues, but the focus is shifting toward measurable outcomes, such as the evidence from 3d printed mouthguard energy absorption studies.
  • The emergence of the smart mouthguard for head impact monitoring is a game-changer, fundamentally altering the role of mouthguards in concussion prevention. This is particularly critical in youth sports, where mouthguard technology for youth sports safety is a major parental concern.
  • The impact of material science on mouthguard performance is undeniable, with ongoing comparisons between ethylene vinyl acetate vs photopolymer resins driving innovation. The growth of additive manufacturing in custom oral appliances highlights a major industrial pivot. However, vendors face significant hurdles, including the challenges in smart mouthguard data accuracy and the complexities of integrating sensors into athletic protective gear.
  • The implementation of mandates for instrumented mouthguards in sports by governing bodies is forcing a market-wide upgrade, though the cost-effectiveness of different mouthguard types remains a key factor for amateur leagues. These advancements are a core part of modern advancements in sports dentistry and protection.
  • From a design perspective, optimizing the airflow design in high-performance mouthguards and optimizing the mouthguard fit for athlete comfort are critical for user compliance. While the market penetration of custom-fit mouthguards is growing, it is still limited. Compliance with evolving regulatory standards for sports mouthguards is non-negotiable for all manufacturers.
  • On the consumer front, the niche but growing market for flavored mouthguards in the youth sports market cannot be ignored. Ultimately, proving the superior shock absorption properties of multi-layer guards and clearly communicating how sports mouthguards reduce dental injuries are essential for brand success.
  • For instance, supply chains that can deliver custom digital products are proving to be over 50% more efficient than those reliant on traditional, multi-step molding and shipping processes.

What are the key market drivers leading to the rise in the adoption of Sports Mouthguard Industry?

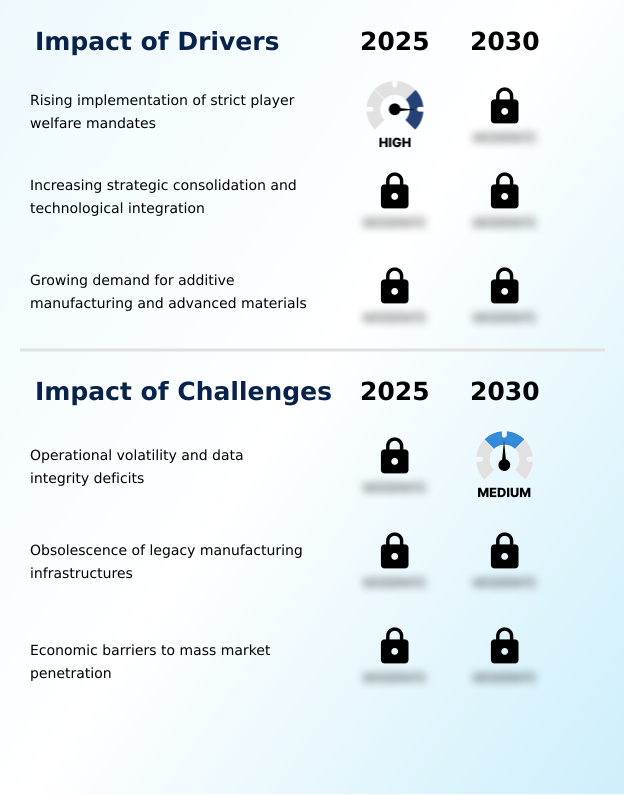
  • The rising implementation of strict player welfare mandates across sporting leagues is a primary driver fueling market growth.

  • A primary market driver is the intensified focus on a comprehensive concussion management strategy to prevent orofacial injury. This has led to the development of devices with superior impact dispersion.
  • Innovations in manufacturing, such as additive manufacturing (3D printing) and fused filament fabrication, are enabling a new level of instant custom-fit solutions. Technologies like compression cage technology mimic a lab-quality fit at a retail level.
  • Furthermore, the integration of sensors provides rich data analytics capabilities, supported by ongoing algorithm calibration for accuracy.
  • The market is also seeing a rise in home impression kits, which democratize access to personalized protection and have increased the adoption of custom-fit guards by an estimated 20% among amateur athletes.

What are the market trends shaping the Sports Mouthguard Industry?

  • The market is witnessing a defining trend toward the commercialization and mass-market retail integration of smart safety technology. This evolution is shifting product focus from passive protection to connected, data-driven ecosystems.

  • A defining trend is the rapid digital technology integration that enables the creation of instrumented smart mouthguards. These devices are now being integrated into retail channels, supported by sophisticated digital workflows. The focus on user experience is driving the trend of lifestyle branding, where products like the lip guard are designed with enhanced airflow channels and even flavor fusion technology.
  • On the manufacturing front, the shift towards chairside fabrication is enabled by advanced materials like photopolymer resins and biocompatible resins, allowing for on-demand production. This trend decentralizes manufacturing and provides athletes with immediate access to custom-fit protection, with some processes reducing delivery times from days to under an hour.

What challenges does the Sports Mouthguard Industry face during its growth?

  • Operational volatility and data integrity deficits in smart sensor technology pose a key challenge to industry growth.

  • The integration of smart technology introduces significant operational volatility and data integrity deficits. Issues such as false positives and bluetooth latency challenge the reliability of head impact telemetry and overall sensor performance, hindering widespread adoption. For passive protection, even basic pre-formed configurations with external tethers face competition from devices created through advanced polymer engineering.
  • Manufacturers are challenged to design complex energy-dissipating lattice structures that provide superior protection without being cost-prohibitive. This creates a difficult balancing act between innovating beyond simple protection and ensuring that new technologies are reliable and affordable enough for the broader market.

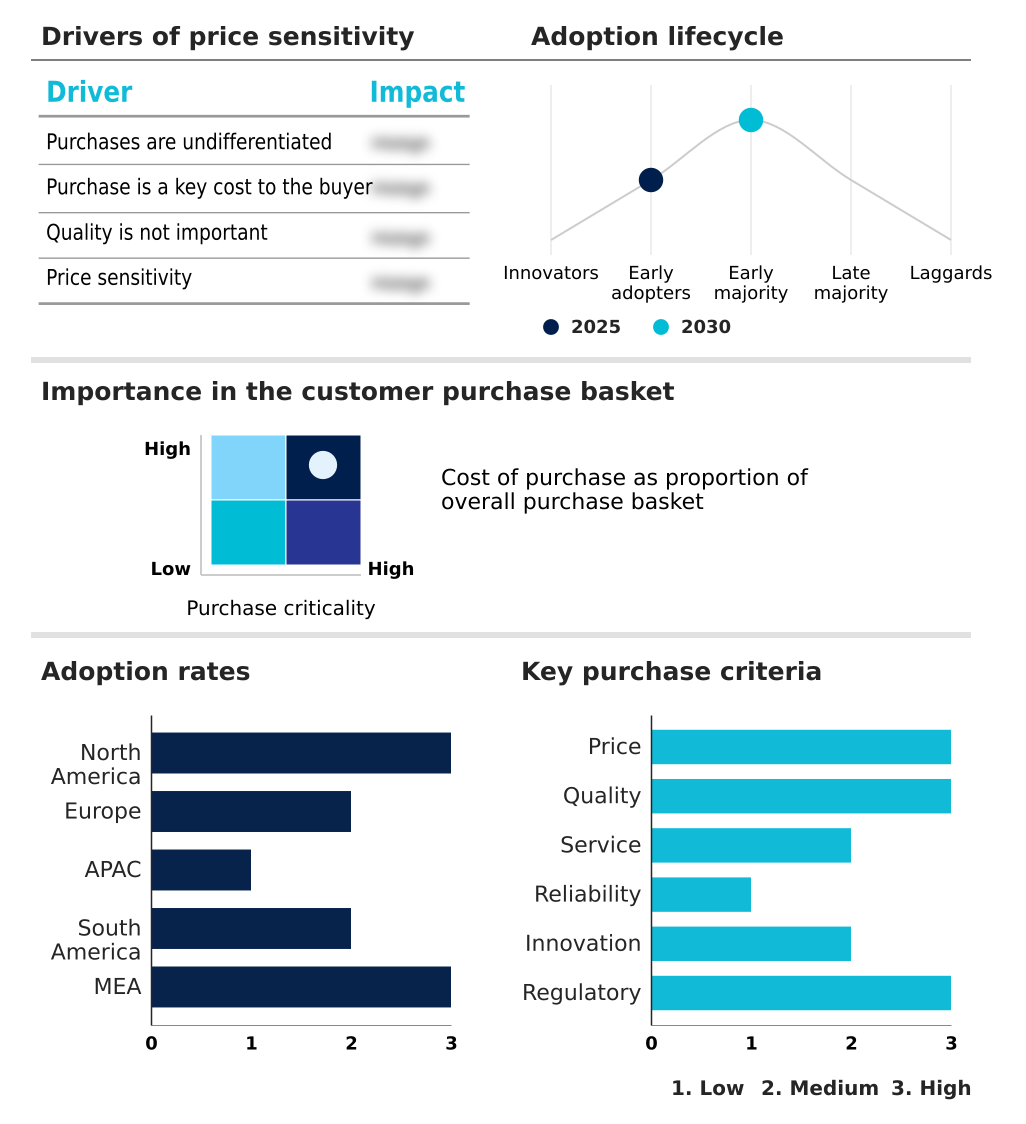
Exclusive Technavio Analysis on Customer Landscape

The sports mouthguard market forecasting report includes the adoption lifecycle of the market, covering from the innovator’s stage to the laggard’s stage. It focuses on adoption rates in different regions based on penetration. Furthermore, the sports mouthguard market report also includes key purchase criteria and drivers of price sensitivity to help companies evaluate and develop their market growth analysis strategies.

Customer Landscape of Sports Mouthguard Industry

Competitive Landscape

Companies are implementing various strategies, such as strategic alliances, sports mouthguard market forecast, partnerships, mergers and acquisitions, geographical expansion, and product/service launches, to enhance their presence in the industry.

Battle Sports Science LLC - Key offerings include athletic mouthguards engineered with impact-absorbing boil-and-bite technology, specifically designed to provide protection and enhance performance in high-contact sports.

The industry research and growth report includes detailed analyses of the competitive landscape of the market and information about key companies, including:

  • Battle Sports Science LLC
  • Brain Pad Inc.
  • Decathlon SA
  • GuardLab, Inc.
  • Makura Co., Ltd
  • MAX MOUTHGUARDS CC
  • MoGo Sports
  • Mueller Sports Medicine Inc.
  • Nike Inc.
  • OPROGROUP
  • RDX Inc.
  • Robust Dental Lab
  • Shock Doctor Inc.
  • Sisu Aero Mouthguard
  • Under Armour Inc.
  • Venum

Qualitative and quantitative analysis of companies has been conducted to help clients understand the wider business environment as well as the strengths and weaknesses of key industry players. Data is qualitatively analyzed to categorize companies as pure play, category-focused, industry-focused, and diversified; it is quantitatively analyzed to categorize companies as dominant, leading, strong, tentative, and weak.

Recent Development and News in Sports mouthguard market

  • In November 2024, OPRO announced a strategic partnership with Crostyx to launch a co-branded Instant Custom-Fit mouthguard line featuring patented compression cage technology.
  • In January 2025, researchers at the Ohio State University College of Dentistry published a study providing empirical evidence that specific 3D-printed mouthguard designs exhibit superior energy absorption capabilities compared to traditional EVA guards.
  • In February 2025, SprintRay launched its proprietary SportsGuard resin, a material specifically engineered for fabricating high-performance custom athletic mouthguards using digital light processing (DLP) 3D printers.
  • In June 2025, Shock Doctor and HITIQ Limited announced a strategic collaboration to embed HITIQ's PROTEQT impact-sensing platform into Shock Doctor's mass-market product portfolio.

Dive into Technavio’s robust research methodology, blending expert interviews, extensive data synthesis, and validated models for unparalleled Sports Mouthguard Market insights. See full methodology.

Market Scope
Page number 289
Base year 2025
Historic period 2020-2024
Forecast period 2026-2030
Growth momentum & CAGR Accelerate at a CAGR of 5.7%
Market growth 2026-2030 USD 1439.8 million
Market structure Fragmented
YoY growth 2025-2026(%) 5.4%
Key countries US, Canada, Mexico, Germany, UK, France, Spain, Italy, The Netherlands, China, Japan, India, Australia, South Korea, Indonesia, Brazil, Argentina, Colombia, South Africa, Saudi Arabia, UAE, Egypt and Turkey
Competitive landscape Leading Companies, Market Positioning of Companies, Competitive Strategies, and Industry Risks

Request Free Sample

Research Analyst Overview

  • The sports mouthguard market is rapidly evolving from basic protective gear to sophisticated safety systems, driven by advancements in material science and digital health. Traditional products made from ethylene vinyl acetate (EVA) are being enhanced through thermoplastic adaptation and multi-layered construction to improve impact dispersion. These often feature a gel-like inner liner for better fit.
  • The goal is to create an instant custom-fit experience, supported by technologies like the compression cage technology. This innovation in polymer engineering is moving beyond simple pre-formed configurations. Specialized products like the lip guard are now designed with advanced airflow channels and secure external tethers.
  • A significant industry shift involves the adoption of additive manufacturing (3D printing), enabled by intraoral scanning, to create devices with complex energy-dissipating lattice structures from biocompatible resins. The most advanced segment now includes instrumented smart mouthguards equipped with accelerometers and gyroscopes for real-time head impact telemetry.
  • These sensors are embedded within the protective polymer, often made from next-generation photopolymer resins using techniques like fused filament fabrication.
  • Boardroom decisions are now heavily influenced by the proven efficacy of these technologies; for example, a recent study showed that certain 3D printed designs provided a 20% improvement in impact energy absorption over conventional guards, directly impacting product strategy and R&D budgets.

What are the Key Data Covered in this Sports Mouthguard Market Research and Growth Report?

  • What is the expected growth of the Sports Mouthguard Market between 2026 and 2030?

    • USD 1.44 billion, at a CAGR of 5.7%

  • What segmentation does the market report cover?

    • The report is segmented by Product Type (Boil and bite mouth guard, Stock mouth guard, and Custom -made mouth guard), Distribution Channel (Offline, and Online), Material (Ethylene vinyl acetate, Natural rubber, and Acrylic resins) and Geography (North America, Europe, APAC, South America, Middle East and Africa)

  • Which regions are analyzed in the report?

    • North America, Europe, APAC, South America and Middle East and Africa

  • What are the key growth drivers and market challenges?

    • Rising implementation of strict player welfare mandates, Operational volatility and data integrity deficits

  • Who are the major players in the Sports Mouthguard Market?

    • Battle Sports Science LLC, Brain Pad Inc., Decathlon SA, GuardLab, Inc., Makura Co., Ltd, MAX MOUTHGUARDS CC, MoGo Sports, Mueller Sports Medicine Inc., Nike Inc., OPROGROUP, RDX Inc., Robust Dental Lab, Shock Doctor Inc., Sisu Aero Mouthguard, Under Armour Inc. and Venum

Market Research Insights

  • The sports mouthguard market's dynamics are shaped by a push toward a comprehensive concussion management strategy, which is accelerating digital technology integration. The focus has expanded from passive protection to active head impact telemetry, with devices now incorporating data analytics capabilities.
  • This shift has shown tangible results, with some advanced systems improving the detection of significant impact events by over 40% compared to visual assessment alone. Concurrently, the consumer segment is influenced by aesthetic diversification and lifestyle branding. However, challenges persist. Operational volatility and data integrity deficits in smart devices create adoption hurdles.
  • Firms are also grappling with the obsolescence of legacy manufacturing, as transitioning to digital workflows can increase initial production costs by up to 25%. Economic barriers further restrain the mass-market penetration of custom-fit technology, creating a divided market.

We can help! Our analysts can customize this sports mouthguard market research report to meet your requirements.

Get in touch

1. Executive Summary

1.1 Market overview

Executive Summary - Chart on Market Overview
Executive Summary - Data Table on Market Overview
Executive Summary - Chart on Global Market Characteristics
Executive Summary - Chart on Market by Geography
Executive Summary - Chart on Market Segmentation by Product Type
Executive Summary - Chart on Market Segmentation by Distribution Channel
Executive Summary - Chart on Market Segmentation by Material
Executive Summary - Chart on Incremental Growth
Executive Summary - Data Table on Incremental Growth
Executive Summary - Chart on Company Market Positioning

2. Technavio Analysis

2.1 Analysis of price sensitivity, lifecycle, customer purchase basket, adoption rates, and purchase criteria

2.2 Criticality of inputs and Factors of differentiation

Chart on Overview on criticality of inputs and factors of differentiation

2.3 Factors of disruption

Chart on Overview on factors of disruption

2.4 Impact of drivers and challenges

Chart on Impact of drivers and challenges in 2025 and 2030

3. Market Landscape

3.1 Market ecosystem

Chart on Parent Market
Data Table on - Parent Market

3.2 Market characteristics

Chart on Market characteristics analysis

3.3 Value chain analysis

Chart on Value chain analysis

4. Market Sizing

4.1 Market definition

Data Table on Offerings of companies included in the market definition

4.2 Market segment analysis

Market segments

4.3 Market size 2025

4.4 Market outlook: Forecast for 2025-2030

Chart on Global - Market size and forecast 2025-2030 ($ million)
Data Table on Global - Market size and forecast 2025-2030 ($ million)
Chart on Global Market: Year-over-year growth 2025-2030 (%)
Data Table on Global Market: Year-over-year growth 2025-2030 (%)

5. Historic Market Size

5.1 Global Sports Mouthguard Market 2020 - 2024

Historic Market Size - Data Table on Global Sports Mouthguard Market 2020 - 2024 ($ million)

5.2 Product Type segment analysis 2020 - 2024

Historic Market Size - Product Type Segment 2020 - 2024 ($ million)

5.3 Distribution Channel segment analysis 2020 - 2024

Historic Market Size - Distribution Channel Segment 2020 - 2024 ($ million)

5.4 Material segment analysis 2020 - 2024

Historic Market Size - Material Segment 2020 - 2024 ($ million)

5.5 Geography segment analysis 2020 - 2024

Historic Market Size - Geography Segment 2020 - 2024 ($ million)

5.6 Country segment analysis 2020 - 2024

Historic Market Size - Country Segment 2020 - 2024 ($ million)

6. Qualitative Analysis

6.1 Impact of AI in the Global Sports Mouthguard Market

7. Five Forces Analysis

7.1 Five forces summary

Five forces analysis - Comparison between 2025 and 2030

7.2 Bargaining power of buyers

Bargaining power of buyers - Impact of key factors 2025 and 2030

7.3 Bargaining power of suppliers

Bargaining power of suppliers - Impact of key factors in 2025 and 2030

7.4 Threat of new entrants

Threat of new entrants - Impact of key factors in 2025 and 2030

7.5 Threat of substitutes

Threat of substitutes - Impact of key factors in 2025 and 2030

7.6 Threat of rivalry

Threat of rivalry - Impact of key factors in 2025 and 2030

7.7 Market condition

Chart on Market condition - Five forces 2025 and 2030

8. Market Segmentation by Product Type

8.1 Market segments

Chart on Product Type - Market share 2025-2030 (%)
Data Table on Product Type - Market share 2025-2030 (%)

8.2 Comparison by Product Type

Chart on Comparison by Product Type
Data Table on Comparison by Product Type

8.3 Boil and bite mouth guard - Market size and forecast 2025-2030

Chart on Boil and bite mouth guard - Market size and forecast 2025-2030 ($ million)
Data Table on Boil and bite mouth guard - Market size and forecast 2025-2030 ($ million)
Chart on Boil and bite mouth guard - Year-over-year growth 2025-2030 (%)
Data Table on Boil and bite mouth guard - Year-over-year growth 2025-2030 (%)

8.4 Stock mouth guard - Market size and forecast 2025-2030

Chart on Stock mouth guard - Market size and forecast 2025-2030 ($ million)
Data Table on Stock mouth guard - Market size and forecast 2025-2030 ($ million)
Chart on Stock mouth guard - Year-over-year growth 2025-2030 (%)
Data Table on Stock mouth guard - Year-over-year growth 2025-2030 (%)

8.5 Custom-made mouth guard - Market size and forecast 2025-2030

Chart on Custom-made mouth guard - Market size and forecast 2025-2030 ($ million)
Data Table on Custom-made mouth guard - Market size and forecast 2025-2030 ($ million)
Chart on Custom-made mouth guard - Year-over-year growth 2025-2030 (%)
Data Table on Custom-made mouth guard - Year-over-year growth 2025-2030 (%)

8.6 Market opportunity by Product Type

Market opportunity by Product Type ($ million)
Data Table on Market opportunity by Product Type ($ million)

9. Market Segmentation by Distribution Channel

9.1 Market segments

Chart on Distribution Channel - Market share 2025-2030 (%)
Data Table on Distribution Channel - Market share 2025-2030 (%)

9.2 Comparison by Distribution Channel

Chart on Comparison by Distribution Channel
Data Table on Comparison by Distribution Channel

9.3 Offline - Market size and forecast 2025-2030

Chart on Offline - Market size and forecast 2025-2030 ($ million)
Data Table on Offline - Market size and forecast 2025-2030 ($ million)
Chart on Offline - Year-over-year growth 2025-2030 (%)
Data Table on Offline - Year-over-year growth 2025-2030 (%)

9.4 Online - Market size and forecast 2025-2030

Chart on Online - Market size and forecast 2025-2030 ($ million)
Data Table on Online - Market size and forecast 2025-2030 ($ million)
Chart on Online - Year-over-year growth 2025-2030 (%)
Data Table on Online - Year-over-year growth 2025-2030 (%)

9.5 Market opportunity by Distribution Channel

Market opportunity by Distribution Channel ($ million)
Data Table on Market opportunity by Distribution Channel ($ million)

10. Market Segmentation by Material

10.1 Market segments

Chart on Material - Market share 2025-2030 (%)
Data Table on Material - Market share 2025-2030 (%)

10.2 Comparison by Material

Chart on Comparison by Material
Data Table on Comparison by Material

10.3 Ethylene vinyl acetate - Market size and forecast 2025-2030

Chart on Ethylene vinyl acetate - Market size and forecast 2025-2030 ($ million)
Data Table on Ethylene vinyl acetate - Market size and forecast 2025-2030 ($ million)
Chart on Ethylene vinyl acetate - Year-over-year growth 2025-2030 (%)
Data Table on Ethylene vinyl acetate - Year-over-year growth 2025-2030 (%)

10.4 Natural rubber - Market size and forecast 2025-2030

Chart on Natural rubber - Market size and forecast 2025-2030 ($ million)
Data Table on Natural rubber - Market size and forecast 2025-2030 ($ million)
Chart on Natural rubber - Year-over-year growth 2025-2030 (%)
Data Table on Natural rubber - Year-over-year growth 2025-2030 (%)

10.5 Acrylic resins - Market size and forecast 2025-2030

Chart on Acrylic resins - Market size and forecast 2025-2030 ($ million)
Data Table on Acrylic resins - Market size and forecast 2025-2030 ($ million)
Chart on Acrylic resins - Year-over-year growth 2025-2030 (%)
Data Table on Acrylic resins - Year-over-year growth 2025-2030 (%)

10.6 Market opportunity by Material

Market opportunity by Material ($ million)
Data Table on Market opportunity by Material ($ million)

11. Customer Landscape

11.1 Customer landscape overview

Analysis of price sensitivity, lifecycle, customer purchase basket, adoption rates, and purchase criteria

12. Geographic Landscape

12.1 Geographic segmentation

Chart on Market share by geography 2025-2030 (%)
Data Table on Market share by geography 2025-2030 (%)

12.2 Geographic comparison

Chart on Geographic comparison
Data Table on Geographic comparison

12.3 North America - Market size and forecast 2025-2030

Chart on North America - Market size and forecast 2025-2030 ($ million)
Data Table on North America - Market size and forecast 2025-2030 ($ million)
Chart on North America - Year-over-year growth 2025-2030 (%)
Data Table on North America - Year-over-year growth 2025-2030 (%)
Chart on Regional Comparison - North America
Data Table on Regional Comparison - North America

12.3.1 US - Market size and forecast 2025-2030

Chart on US - Market size and forecast 2025-2030 ($ million)
Data Table on US - Market size and forecast 2025-2030 ($ million)
Chart on US - Year-over-year growth 2025-2030 (%)
Data Table on US - Year-over-year growth 2025-2030 (%)

12.3.2 Canada - Market size and forecast 2025-2030

Chart on Canada - Market size and forecast 2025-2030 ($ million)
Data Table on Canada - Market size and forecast 2025-2030 ($ million)
Chart on Canada - Year-over-year growth 2025-2030 (%)
Data Table on Canada - Year-over-year growth 2025-2030 (%)

12.3.3 Mexico - Market size and forecast 2025-2030

Chart on Mexico - Market size and forecast 2025-2030 ($ million)
Data Table on Mexico - Market size and forecast 2025-2030 ($ million)
Chart on Mexico - Year-over-year growth 2025-2030 (%)
Data Table on Mexico - Year-over-year growth 2025-2030 (%)

12.4 Europe - Market size and forecast 2025-2030

Chart on Europe - Market size and forecast 2025-2030 ($ million)
Data Table on Europe - Market size and forecast 2025-2030 ($ million)
Chart on Europe - Year-over-year growth 2025-2030 (%)
Data Table on Europe - Year-over-year growth 2025-2030 (%)
Chart on Regional Comparison - Europe
Data Table on Regional Comparison - Europe

12.4.1 Germany - Market size and forecast 2025-2030

Chart on Germany - Market size and forecast 2025-2030 ($ million)
Data Table on Germany - Market size and forecast 2025-2030 ($ million)
Chart on Germany - Year-over-year growth 2025-2030 (%)
Data Table on Germany - Year-over-year growth 2025-2030 (%)

12.4.2 UK - Market size and forecast 2025-2030

Chart on UK - Market size and forecast 2025-2030 ($ million)
Data Table on UK - Market size and forecast 2025-2030 ($ million)
Chart on UK - Year-over-year growth 2025-2030 (%)
Data Table on UK - Year-over-year growth 2025-2030 (%)

12.4.3 France - Market size and forecast 2025-2030

Chart on France - Market size and forecast 2025-2030 ($ million)
Data Table on France - Market size and forecast 2025-2030 ($ million)
Chart on France - Year-over-year growth 2025-2030 (%)
Data Table on France - Year-over-year growth 2025-2030 (%)

12.4.4 Spain - Market size and forecast 2025-2030

Chart on Spain - Market size and forecast 2025-2030 ($ million)
Data Table on Spain - Market size and forecast 2025-2030 ($ million)
Chart on Spain - Year-over-year growth 2025-2030 (%)
Data Table on Spain - Year-over-year growth 2025-2030 (%)

12.4.5 Italy - Market size and forecast 2025-2030

Chart on Italy - Market size and forecast 2025-2030 ($ million)
Data Table on Italy - Market size and forecast 2025-2030 ($ million)
Chart on Italy - Year-over-year growth 2025-2030 (%)
Data Table on Italy - Year-over-year growth 2025-2030 (%)

12.4.6 The Netherlands - Market size and forecast 2025-2030

Chart on The Netherlands - Market size and forecast 2025-2030 ($ million)
Data Table on The Netherlands - Market size and forecast 2025-2030 ($ million)
Chart on The Netherlands - Year-over-year growth 2025-2030 (%)
Data Table on The Netherlands - Year-over-year growth 2025-2030 (%)

12.5 APAC - Market size and forecast 2025-2030

Chart on APAC - Market size and forecast 2025-2030 ($ million)
Data Table on APAC - Market size and forecast 2025-2030 ($ million)
Chart on APAC - Year-over-year growth 2025-2030 (%)
Data Table on APAC - Year-over-year growth 2025-2030 (%)
Chart on Regional Comparison - APAC
Data Table on Regional Comparison - APAC

12.5.1 China - Market size and forecast 2025-2030

Chart on China - Market size and forecast 2025-2030 ($ million)
Data Table on China - Market size and forecast 2025-2030 ($ million)
Chart on China - Year-over-year growth 2025-2030 (%)
Data Table on China - Year-over-year growth 2025-2030 (%)

12.5.2 Japan - Market size and forecast 2025-2030

Chart on Japan - Market size and forecast 2025-2030 ($ million)
Data Table on Japan - Market size and forecast 2025-2030 ($ million)
Chart on Japan - Year-over-year growth 2025-2030 (%)
Data Table on Japan - Year-over-year growth 2025-2030 (%)

12.5.3 India - Market size and forecast 2025-2030

Chart on India - Market size and forecast 2025-2030 ($ million)
Data Table on India - Market size and forecast 2025-2030 ($ million)
Chart on India - Year-over-year growth 2025-2030 (%)
Data Table on India - Year-over-year growth 2025-2030 (%)

12.5.4 Australia - Market size and forecast 2025-2030

Chart on Australia - Market size and forecast 2025-2030 ($ million)
Data Table on Australia - Market size and forecast 2025-2030 ($ million)
Chart on Australia - Year-over-year growth 2025-2030 (%)
Data Table on Australia - Year-over-year growth 2025-2030 (%)

12.5.5 South Korea - Market size and forecast 2025-2030

Chart on South Korea - Market size and forecast 2025-2030 ($ million)
Data Table on South Korea - Market size and forecast 2025-2030 ($ million)
Chart on South Korea - Year-over-year growth 2025-2030 (%)
Data Table on South Korea - Year-over-year growth 2025-2030 (%)

12.5.6 Indonesia - Market size and forecast 2025-2030

Chart on Indonesia - Market size and forecast 2025-2030 ($ million)
Data Table on Indonesia - Market size and forecast 2025-2030 ($ million)
Chart on Indonesia - Year-over-year growth 2025-2030 (%)
Data Table on Indonesia - Year-over-year growth 2025-2030 (%)

12.6 South America - Market size and forecast 2025-2030

Chart on South America - Market size and forecast 2025-2030 ($ million)
Data Table on South America - Market size and forecast 2025-2030 ($ million)
Chart on South America - Year-over-year growth 2025-2030 (%)
Data Table on South America - Year-over-year growth 2025-2030 (%)
Chart on Regional Comparison - South America
Data Table on Regional Comparison - South America

12.6.1 Brazil - Market size and forecast 2025-2030

Chart on Brazil - Market size and forecast 2025-2030 ($ million)
Data Table on Brazil - Market size and forecast 2025-2030 ($ million)
Chart on Brazil - Year-over-year growth 2025-2030 (%)
Data Table on Brazil - Year-over-year growth 2025-2030 (%)

12.6.2 Argentina - Market size and forecast 2025-2030

Chart on Argentina - Market size and forecast 2025-2030 ($ million)
Data Table on Argentina - Market size and forecast 2025-2030 ($ million)
Chart on Argentina - Year-over-year growth 2025-2030 (%)
Data Table on Argentina - Year-over-year growth 2025-2030 (%)

12.6.3 Colombia - Market size and forecast 2025-2030

Chart on Colombia - Market size and forecast 2025-2030 ($ million)
Data Table on Colombia - Market size and forecast 2025-2030 ($ million)
Chart on Colombia - Year-over-year growth 2025-2030 (%)
Data Table on Colombia - Year-over-year growth 2025-2030 (%)

12.7 Middle East and Africa - Market size and forecast 2025-2030

Chart on Middle East and Africa - Market size and forecast 2025-2030 ($ million)
Data Table on Middle East and Africa - Market size and forecast 2025-2030 ($ million)
Chart on Middle East and Africa - Year-over-year growth 2025-2030 (%)
Data Table on Middle East and Africa - Year-over-year growth 2025-2030 (%)
Chart on Regional Comparison - Middle East and Africa
Data Table on Regional Comparison - Middle East and Africa

12.7.1 South Africa - Market size and forecast 2025-2030

Chart on South Africa - Market size and forecast 2025-2030 ($ million)
Data Table on South Africa - Market size and forecast 2025-2030 ($ million)
Chart on South Africa - Year-over-year growth 2025-2030 (%)
Data Table on South Africa - Year-over-year growth 2025-2030 (%)

12.7.2 Saudi Arabia - Market size and forecast 2025-2030

Chart on Saudi Arabia - Market size and forecast 2025-2030 ($ million)
Data Table on Saudi Arabia - Market size and forecast 2025-2030 ($ million)
Chart on Saudi Arabia - Year-over-year growth 2025-2030 (%)
Data Table on Saudi Arabia - Year-over-year growth 2025-2030 (%)

12.7.3 UAE - Market size and forecast 2025-2030

Chart on UAE - Market size and forecast 2025-2030 ($ million)
Data Table on UAE - Market size and forecast 2025-2030 ($ million)
Chart on UAE - Year-over-year growth 2025-2030 (%)
Data Table on UAE - Year-over-year growth 2025-2030 (%)

12.7.4 Egypt - Market size and forecast 2025-2030

Chart on Egypt - Market size and forecast 2025-2030 ($ million)
Data Table on Egypt - Market size and forecast 2025-2030 ($ million)
Chart on Egypt - Year-over-year growth 2025-2030 (%)
Data Table on Egypt - Year-over-year growth 2025-2030 (%)

12.7.5 Turkey - Market size and forecast 2025-2030

Chart on Turkey - Market size and forecast 2025-2030 ($ million)
Data Table on Turkey - Market size and forecast 2025-2030 ($ million)
Chart on Turkey - Year-over-year growth 2025-2030 (%)
Data Table on Turkey - Year-over-year growth 2025-2030 (%)

12.8 Market opportunity by geography

Market opportunity by geography ($ million)
Data Tables on Market opportunity by geography ($ million)

13. Drivers, Challenges, and Opportunity

13.1 Market drivers

Rising implementation of strict player welfare mandates
Increasing strategic consolidation and technological integration
Growing demand for additive manufacturing and advanced materials

13.2 Market challenges

Operational volatility and data integrity deficits
Obsolescence of legacy manufacturing infrastructures
Economic barriers to mass market penetration

13.3 Impact of drivers and challenges

Impact of drivers and challenges in 2025 and 2030

13.4 Market opportunities

Commercialization and retail integration of smart safety technology
Digital transformation of manufacturing via additive technologies
Aesthetic diversification and lifestyle branding in youth sports

14. Competitive Landscape

14.1 Overview

14.2

Overview on criticality of inputs and factors of differentiation

14.3 Landscape disruption

Overview on factors of disruption

14.4 Industry risks

Impact of key risks on business

15. Competitive Analysis

15.1 Companies profiled

Companies covered

15.2 Company ranking index

15.3 Market positioning of companies

Matrix on companies position and classification

15.4 Battle Sports Science LLC

Battle Sports Science LLC - Overview
Battle Sports Science LLC - Product / Service
Battle Sports Science LLC - Key offerings
SWOT

15.5 Brain Pad Inc.

Brain Pad Inc. - Overview
Brain Pad Inc. - Product / Service
Brain Pad Inc. - Key offerings
SWOT

15.6 Decathlon SA

Decathlon SA - Overview
Decathlon SA - Product / Service
Decathlon SA - Key offerings
SWOT

15.7 GuardLab, Inc.

GuardLab, Inc. - Overview
GuardLab, Inc. - Product / Service
GuardLab, Inc. - Key offerings
SWOT

15.8 Makura Co., Ltd

Makura Co., Ltd - Overview
Makura Co., Ltd - Product / Service
Makura Co., Ltd - Key offerings
SWOT

15.9 MAX MOUTHGUARDS CC

MAX MOUTHGUARDS CC - Overview
MAX MOUTHGUARDS CC - Product / Service
MAX MOUTHGUARDS CC - Key offerings
SWOT

15.10 MoGo Sports

MoGo Sports - Overview
MoGo Sports - Product / Service
MoGo Sports - Key offerings
SWOT

15.11 Mueller Sports Medicine Inc.

Mueller Sports Medicine Inc. - Overview
Mueller Sports Medicine Inc. - Product / Service
Mueller Sports Medicine Inc. - Key offerings
SWOT

15.12 Nike Inc.

Nike Inc. - Overview
Nike Inc. - Business segments
Nike Inc. - Key news
Nike Inc. - Key offerings
Nike Inc. - Segment focus
SWOT

15.13 OPROGROUP

OPROGROUP - Overview
OPROGROUP - Product / Service
OPROGROUP - Key offerings
SWOT

15.14 RDX Inc.

RDX Inc. - Overview
RDX Inc. - Product / Service
RDX Inc. - Key offerings
SWOT

15.15 Robust Dental Lab

Robust Dental Lab - Overview
Robust Dental Lab - Product / Service
Robust Dental Lab - Key offerings
SWOT

15.16 Shock Doctor Inc.

Shock Doctor Inc. - Overview
Shock Doctor Inc. - Product / Service
Shock Doctor Inc. - Key offerings
SWOT

15.17 Under Armour Inc.

Under Armour Inc. - Overview
Under Armour Inc. - Business segments
Under Armour Inc. - Key news
Under Armour Inc. - Key offerings
Under Armour Inc. - Segment focus
SWOT

15.18 Venum

Venum - Overview
Venum - Product / Service
Venum - Key offerings
SWOT

16. Appendix

16.1 Scope of the report

Market definition
Objectives
Notes and caveats

16.2 Inclusions and exclusions checklist

Inclusions checklist
Exclusions checklist

16.3 Currency conversion rates for US$

16.4 Research methodology

16.5 Data procurement

Information sources

16.6 Data validation

16.7 Validation techniques employed for market sizing

16.8 Data synthesis

16.9 360 degree market analysis

16.10 List of abbreviations

Research Methodology

Technavio presents a detailed picture of the market by way of study, synthesis, and summation of data from multiple sources. The analysts have presented the various facets of the market with a particular focus on identifying the key industry influencers. The data thus presented is comprehensive, reliable, and the result of extensive research, both primary and secondary.

INFORMATION SOURCES

Primary sources

  • Manufacturers and suppliers
  • Channel partners
  • Industry experts
  • Strategic decision makers

Secondary sources

  • Industry journals and periodicals
  • Government data
  • Financial reports of key industry players
  • Historical data
  • Press releases

DATA ANALYSIS

Data Synthesis

  • Collation of data
  • Estimation of key figures
  • Analysis of derived insights

Data Validation

  • Triangulation with data models
  • Reference against proprietary databases
  • Corroboration with industry experts

REPORT WRITING

Qualitative

  • Market drivers
  • Market challenges
  • Market trends
  • Five forces analysis

Quantitative

  • Market size and forecast
  • Market segmentation
  • Geographical insights
  • Competitive landscape

Interested in this report?

Get your sample now to see our research methodology and insights!

Download Now

Frequently Asked Questions

Sports Mouthguard market growth will increase by USD 1439.8 million during 2026-2030.

The Sports Mouthguard market is expected to grow at a CAGR of 5.7% during 2026-2030.

Sports Mouthguard market is segmented by Product type (Boil and bite mouth guard, Stock mouth guard, Custom-made mouth guard) Distribution channel (Offline, Online) Material (Ethylene vinyl acetate, Natural rubber, Acrylic resins)

Battle Sports Science LLC, Brain Pad Inc., Decathlon SA, GuardLab, Inc., Makura Co., Ltd, MAX MOUTHGUARDS CC, MoGo Sports, Mueller Sports Medicine Inc., Nike Inc., OPROGROUP, RDX Inc., Robust Dental Lab, Shock Doctor Inc., Sisu Aero Mouthguard, Under Armour Inc., Venum are a few of the key vendors in the Sports Mouthguard market.

North America will register the highest growth rate of 38.5% among the other regions. Therefore, the Sports Mouthguard market in North America is expected to garner significant business opportunities for the vendors during the forecast period.

US, Canada, Mexico, Germany, UK, France, Spain, Italy, The Netherlands, China, Japan, India, Australia, South Korea, Indonesia, Brazil, Argentina, Colombia, South Africa, Saudi Arabia, UAE, Egypt, Turkey

  • Rising implementation of strict player welfare mandates is the driving factor this market.

The Sports Mouthguard market vendors should focus on grabbing business opportunities from the Product type segment as it accounted for the largest market share in the base year.