
Spreads Market Size 2026-2030
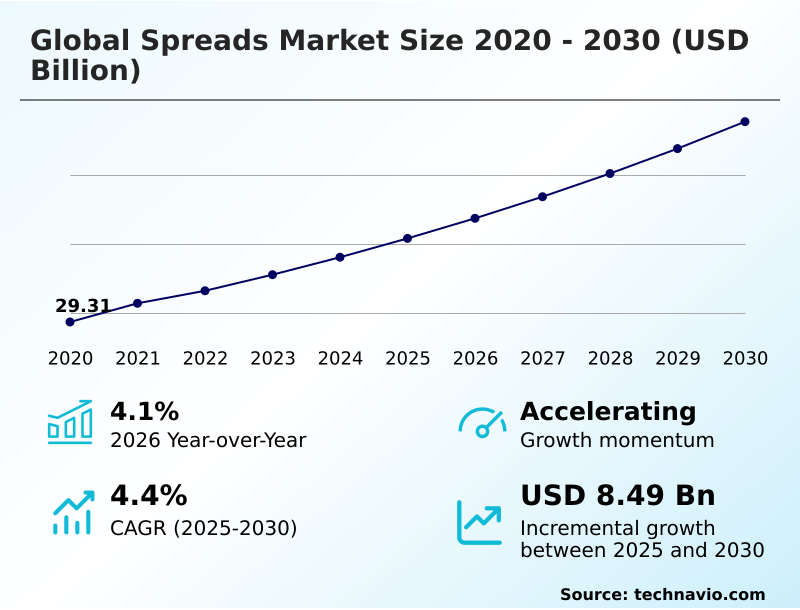
The Spreads Market size was valued at USD 35.39 billion in 2025, growing at a CAGR of 4.4% during the forecast period 2026-2030.
Major Market Trends & Insights
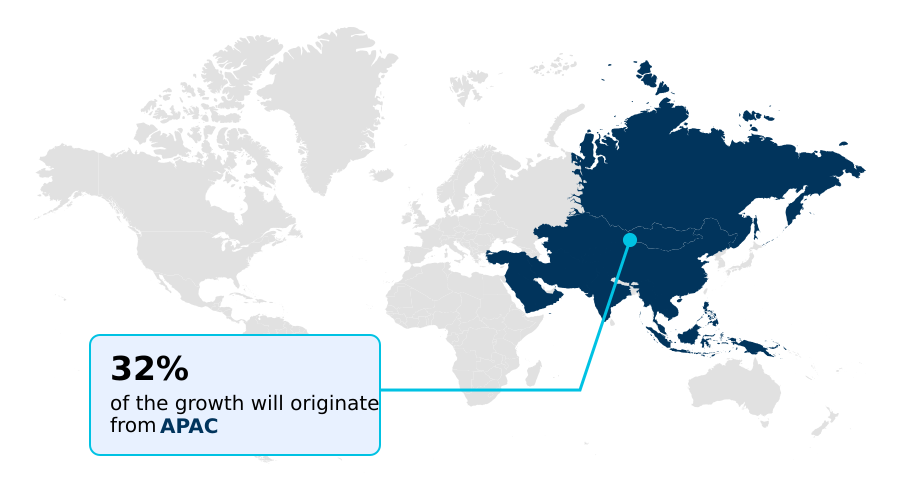
- APAC dominated the market and accounted for a 32% growth during the forecast period.
- By Distribution Channel - Offline segment was valued at USD 21.16 billion in 2024
- By End-user - Households segment accounted for the largest market revenue share in 2024
Market Size & Forecast
- Historic Market Opportunities 2020-2024: USD 14.56 billion
- Market Future Opportunities 2025-2030: USD 8.49 billion
- CAGR from 2025 to 2030 : 4.4%
Market Summary
- The spreads market is characterized by a significant transformation toward health-centric formulations, where products featuring functional nutriments are outpacing conventional alternatives in growth by a factor of two. This shift is largely driven by heightened consumer demand for clean-label products that support specific wellness goals, such as gut health or sustained energy release, without artificial stabilizers.
- A notable business scenario involves manufacturers reformulating legacy products to remove palm oil and reduce sugar content by up to 30%, a complex operational task requiring extensive R&D to maintain expected sensory characteristics and shelf stability. This strategic pivot addresses both consumer preferences and mounting regulatory pressures.
- However, the industry faces the challenge of commodity price volatility, which can increase raw material costs by 15-20% in a single quarter, threatening profit margins and necessitating agile supply chain management to maintain competitive pricing in a crowded marketplace.
What will be the Size of the Spreads Market during the forecast period?
Get Key Insights on Market Forecast (PDF) Request Free Sample
How is the Spreads Market Segmented?
The spreads industry research report provides comprehensive data (region-wise segment analysis), with forecasts and analysis for the period 2026-2030, as well as historical data from 2020-2024 for the following segments.
- Distribution channel
- Offline
- Online
- End-user
- Households
- Food service
- Industrial
- Product type
- Jams and jellies
- Nut butters
- Cheese spreads
- Savory spreads
- Geography
- Europe
- Germany
- UK
- France
- North America
- US
- Canada
- Mexico
- APAC
- China
- India
- Japan
- South America
- Brazil
- Argentina
- Middle East and Africa
- Saudi Arabia
- UAE
- South Africa
- Rest of World (ROW)
- Europe
How is the Spreads Market Segmented by Distribution Channel?
The offline segment is estimated to witness significant growth during the forecast period.
The offline segment, encompassing hypermarkets, supermarkets, and specialty food stores, remains the dominant distribution channel, accounting for over 60% of total sales volume.
This channel's strength lies in facilitating impulse purchases of products with specific sensory characteristics, such as creamy texture and indulgent taste profiles, which benefit from in-person discovery.
While the online channel's growth is outpacing it by nearly 1.5 times, offline retailers are adapting by optimizing shelf space for high-demand items like allergen-free alternatives and plant-based proteins.
For instance, strategic placement of products with clean-label transparency can increase sales by up to 15% in high-traffic store zones.
This segmentation underscores the operational need for a multi-channel strategy, balancing the broad reach of brick-and-mortar with the targeted capabilities of e-commerce to address diverse consumer purchasing behaviors.
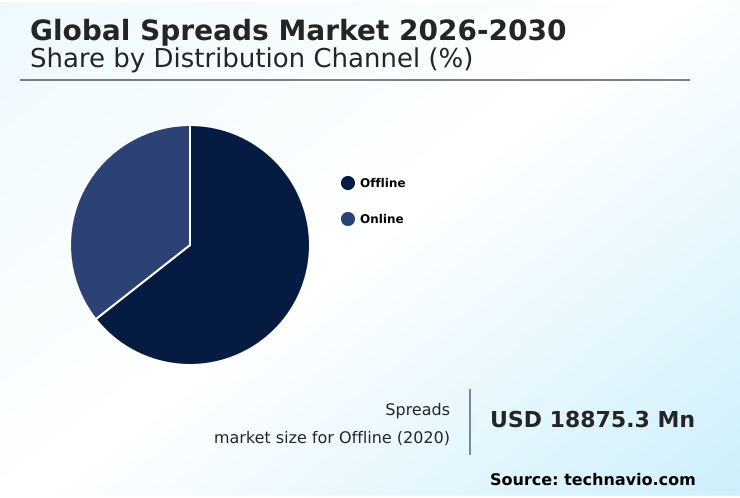
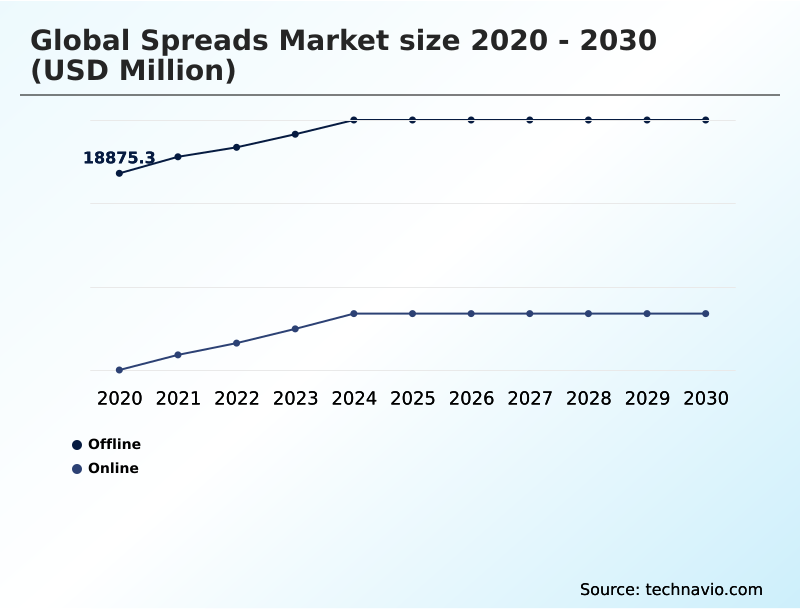
The Offline segment was valued at USD 21.16 billion in 2024 and showed a gradual increase during the forecast period.
How demand for the Spreads market is rising in the leading region?
APAC is estimated to contribute 32% to the growth of the global market during the forecast period.Technavio’s analysts have elaborately explained the regional trends and drivers that shape the market during the forecast period.
See How Spreads Market demand is rising in APAC Request Free Sample
The geographic landscape of the spreads market shows a significant growth differential, with APAC projected to contribute 31.98% of the market's incremental growth, outpacing North America's 29.97% share.
This growth in APAC is primarily led by China and India, where rising disposable incomes and the adoption of Western dietary habits are fueling demand for both savory variants and sweet iterations.
In contrast, the mature markets of Europe and North America, led by the US and Germany, are driven by innovation in functional nutriments and products with fair-trade certifications.
For example, consumer demand for non-GMO ingredients in the US is approximately 25% higher than in many developing APAC countries, impacting sourcing and production.
This regional divergence requires manufacturers to deploy tailored strategies, focusing on volume and accessibility in APAC while emphasizing premium, ethically sourced, and plant protein fortification products in Western markets.
What are the key Drivers, Trends, and Challenges in the Spreads Market?
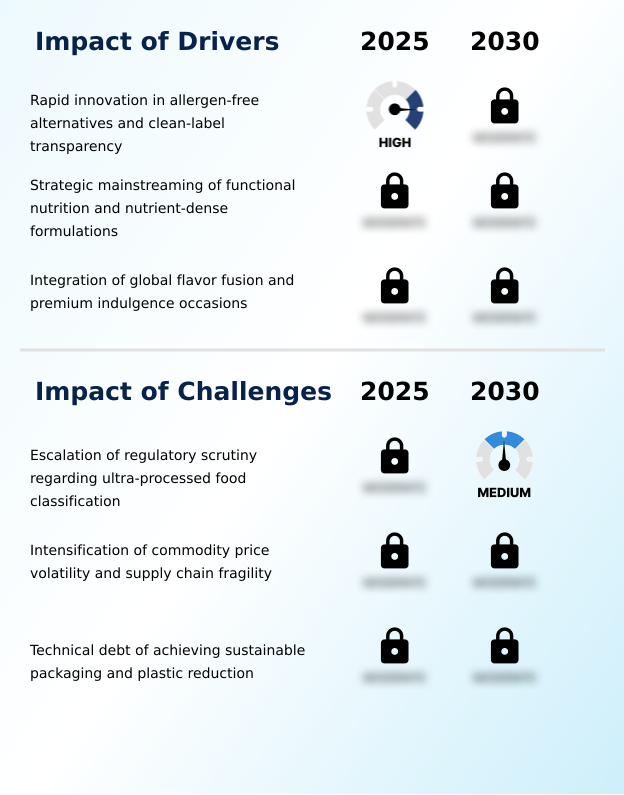
Our researchers analyzed the data with 2025 as the base year, along with the key drivers, trends, and challenges. A holistic analysis of drivers will help companies refine their marketing strategies to gain a competitive advantage.
- The global spreads market is navigating a complex shift as consumers increasingly seek out the best spreads for functional nutrition, moving beyond simple flavor to demand tangible health benefits. This has intensified the search for allergen-free chocolate spread alternatives, compelling manufacturers to innovate with ingredients that ensure safety without compromising taste.
- As a result, products featuring clean-label ingredients are gaining significant traction, with transparency in sourcing and production becoming a key differentiator. A major operational consideration is the transition to sustainable packaging for food spreads, a move that can increase packaging costs by up to 15% but yields substantial gains in brand loyalty among environmentally conscious consumers.
- The rise of plant-based protein spread options further diversifies the market, catering to a growing demographic focused on wellness and ethical consumption. In this evolving landscape, companies that successfully balance nutritional innovation with sustainable practices are better positioned for long-term growth.
- The demand for healthier options is evident, as products with reduced sugar content now outperform their conventional counterparts in sales growth by a margin of nearly two to one.
What are the key market drivers leading to the rise in the adoption of Spreads Industry?
- Rapid innovation in allergen-free alternatives and a push for clean-label transparency are key drivers of market growth.
- The rapid expansion of allergen-free alternatives, coupled with a demand for clean-label transparency, is a primary market driver.
- With nut allergies affecting a growing consumer segment, the development of nut-free formulations using seeds or legumes has become a key innovation area, increasing the addressable market by an estimated 10%.
- These products aim to replicate the indulgent taste profile and creamy texture of traditional spreads, meeting a critical market need. The push for ingredient simplicity and the removal of palm oil or artificial preservatives are now pivotal for market penetration.
- This trend is reinforced by clear front-of-pack labeling, which builds consumer trust and can boost sales by up to 20% compared to products with less transparent packaging, making clean-label innovation a powerful engine for growth.
What are the market trends shaping the Spreads Industry?
- A key market trend is the inclusion of functional nutriments and the integration of bioactive ingredients, transforming spreads into vehicles for targeted health benefits.
- A defining trend in the spreads market is the integration of functional and bioactive ingredients, fundamentally repositioning products from simple toppings to nutritional supplements. This is driven by consumer demand for health-supportive foods, with spreads featuring probiotic fortification seeing a 25% higher repeat purchase rate than conventional counterparts.
- Manufacturers are incorporating ingredients like omega-3 fatty acids and collagen peptides, turning everyday spreads into tools for dietary optimization. This shift is particularly evident in the nut butter segment, where products with added plant protein fortification now grow 1.5 times faster than the base category.
- This move toward nutritional purposefulness enables brands to cater to health-conscious consumers and command a premium, effectively transforming a staple food item into a sophisticated wellness product.
What challenges does the Spreads Industry face during its growth?
- Escalating regulatory scrutiny regarding ultra-processed food classifications poses a key challenge to industry growth.
- Intensifying regulatory scrutiny over ultra-processed food classifications presents a significant challenge to the spreads market, with new standards impacting up to 40% of legacy product portfolios. Health authorities in Europe and North America are implementing stringent nutrient profiling systems and front-of-pack labeling requirements that penalize high sugar, sodium, and saturated fat content.
- This necessitates costly and time-intensive reformulation efforts to achieve clean-label status without compromising the sensory characteristics that define brand loyalty. Failure to comply not only risks financial penalties but also a potential 15% decline in consumer trust.
- Navigating this complex web of evolving global health mandates, which vary significantly by region, strains operational budgets and demands substantial investment in R&D to maintain market compliance and relevance.
Exclusive Technavio Analysis on Customer Landscape
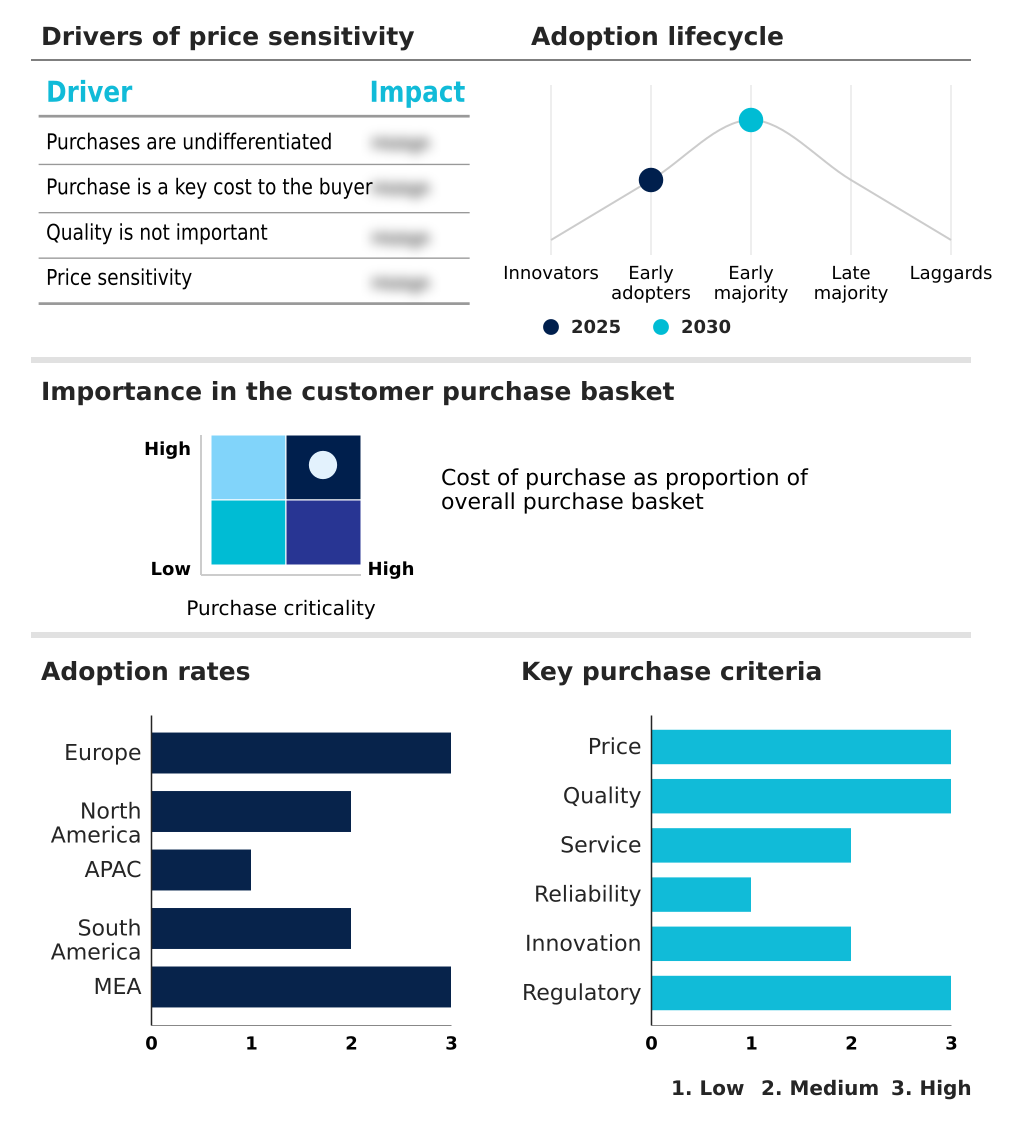
The spreads market forecasting report includes the adoption lifecycle of the market, covering from the innovator’s stage to the laggard’s stage. It focuses on adoption rates in different regions based on penetration. Furthermore, the spreads market report also includes key purchase criteria and drivers of price sensitivity to help companies evaluate and develop their market growth analysis strategies.
Customer Landscape of Spreads Industry
Competitive Landscape
Companies are implementing various strategies, such as strategic alliances, spreads market forecast, partnerships, mergers and acquisitions, geographical expansion, and product/service launches, to enhance their presence in the industry.
Algood Food Co. - Offers a portfolio of shelf-stable and refrigerated food products, including fruit preserves, nut butters, and chocolate-hazelnut formulations engineered for topical application.
The industry research and growth report includes detailed analyses of the competitive landscape of the market and information about key companies, including:
- Algood Food Co.
- Andros SNC
- B and G Foods Inc.
- Dabur India Ltd.
- Dr. August Oetker KG
- F. Duerr and Sons Ltd.
- Ferrero International S.A.
- Hormel Foods Corp.
- Lindt and Sprungli AG
- Mondelez International Inc.
- Murphy Orchard
- Nestle SA
- PepsiCo Inc.
- Rochak Agro Food Products Ltd
- The Hain Celestial Group
- The Hershey Co.
- The J.M. Smucker Co.
- The Kraft Heinz Co.
- Unilever PLC
- Wilkin and Sons Ltd.
Qualitative and quantitative analysis of companies has been conducted to help clients understand the wider business environment as well as the strengths and weaknesses of key industry players. Data is qualitatively analyzed to categorize companies as pure play, category-focused, industry-focused, and diversified; it is quantitatively analyzed to categorize companies as dominant, leading, strong, tentative, and weak.
Market Intelligence Radar: High-Impact Developments & Growth Signals
- In the Packaged Foods and Meats industry, the strategic pivot toward minimally processed foods, impacting over 40% of new product launches, is directly shaping the spreads market by accelerating the adoption of clean-label transparency and nutrient-dense formulations.
- The maturation of online retail channels, which now represent more than 35% of total sales in the Packaged Foods and Meats industry in developed economies, compels spreads manufacturers to re-engineer packaging for direct-to-consumer shipping and prioritize digital-first brand engagement.
- In the Packaged Foods and Meats industry, the expansion of private-label brands, which have secured a retail value share nearing 50% in select European markets, is intensifying price competition, forcing branded spreads producers to differentiate through functional nutriments and unique flavor profiles.
- A rise in consumer expenditure on both halal-certified products and items featuring superfruits within the broader Packaged Foods and Meats industry has established new formulation benchmarks, pushing the spreads market to innovate with certified ethical sourcing and bioactive ingredient integration.
Dive into Technavio’s robust research methodology, blending expert interviews, extensive data synthesis, and validated models for unparalleled Spreads Market insights. See full methodology.
| Market Scope | |
|---|---|
| Page number | 296 |
| Base year | 2025 |
| Historic period | 2020-2024 |
| Forecast period | 2026-2030 |
| Growth momentum & CAGR | Accelerate at a CAGR of 4.4% |
| Market growth 2026-2030 | USD 8487.2 million |
| Market structure | Fragmented |
| YoY growth 2025-2026(%) | 4.1% |
| Key countries | Germany, UK, France, Italy, Spain, The Netherlands, US, Canada, Mexico, China, India, Japan, South Korea, Indonesia, Australia, Brazil, Argentina, Chile, Saudi Arabia, UAE, South Africa, Turkey and Israel |
| Competitive landscape | Leading Companies, Market Positioning of Companies, Competitive Strategies, and Industry Risks |
Research Analyst Overview
- The spreads market ecosystem is a complex network where raw material suppliers of items like nuts, fruits, and oils provide inputs to manufacturers, who are subject to rigorous food safety regulations. These manufacturers, who contribute to over 70% of the market's value, engage in primary and secondary processing, including high-shear mixing and cold-pressing techniques.
- Their products are then moved through distribution channels, including both physical retail and e-commerce platforms, which collectively reach diverse end-users from individual households to the foodservice industry. Regulatory bodies and certification agencies play a pivotal role in enforcing standards for front-of-pack labeling and organic claims, influencing both product formulation and consumer trust.
- Supporting entities focused on R&D are critical for developing innovations in areas like plant-based proteins and shelf-life extension, demonstrating the interconnectedness of the value chain.
What are the Key Data Covered in this Spreads Market Research and Growth Report?
-
What is the expected growth of the Spreads Market between 2026 and 2030?
-
The Spreads Market is expected to grow by USD 8.49 billion during 2026-2030, registering a CAGR of 4.4%. Year-over-year growth in 2026 is estimated at 4.1%%. This acceleration is shaped by rapid innovation in allergen-free alternatives and clean-label transparency, which is intensifying demand across multiple end-use verticals covered in the report.
-
-
What segmentation does the market report cover?
-
The report is segmented by Distribution Channel (Offline, and Online), End-user (Households, Food service, and Industrial), Product Type (Jams and jellies, Nut butters, Cheese spreads, and Savory spreads) and Geography (Europe, North America, APAC, South America, Middle East and Africa). Among these, the Offline segment is estimated to witness significant growth during the forecast period, driven by rising adoption across key application areas. Each segment includes detailed qualitative and quantitative analysis, along with historical data from 2020-2024 and forecasts through 2030 with year-over-year growth rates.
-
-
Which regions are analyzed in the report?
-
The report covers Europe, North America, APAC, South America and Middle East and Africa. APAC is estimated to contribute 32% to market growth during the forecast period. Country-level analysis includes Germany, UK, France, Italy, Spain, The Netherlands, US, Canada, Mexico, China, India, Japan, South Korea, Indonesia, Australia, Brazil, Argentina, Chile, Saudi Arabia, UAE, South Africa, Turkey and Israel, with dedicated market size tables and year-over-year growth for each.
-
-
What are the key growth drivers and market challenges?
-
The primary driver is rapid innovation in allergen-free alternatives and clean-label transparency, which is accelerating investment and industry demand. The main challenge is escalation of regulatory scrutiny regarding ultra-processed food classification, creating operational barriers for key market participants. The report quantifies the impact of each driver and challenge across 2026 and 2030 with comparative analysis.
-
-
Who are the major players in the Spreads Market?
-
Key vendors include Algood Food Co., Andros SNC, B and G Foods Inc., Dabur India Ltd., Dr. August Oetker KG, F. Duerr and Sons Ltd., Ferrero International S.A., Hormel Foods Corp., Lindt and Sprungli AG, Mondelez International Inc., Murphy Orchard, Nestle SA, PepsiCo Inc., Rochak Agro Food Products Ltd, The Hain Celestial Group, The Hershey Co., The J.M. Smucker Co., The Kraft Heinz Co., Unilever PLC and Wilkin and Sons Ltd.. The report provides qualitative and quantitative analysis categorizing companies as dominant, leading, strong, tentative, and weak based on their market positioning. Company profiles include business segment analysis, SWOT assessment, key offerings, and recent strategic developments.
-
Market Research Insights
- The competitive landscape of the spreads market is highly consolidated, with the top five companies controlling over 45% of the market share. This environment is defined by strategic maneuvers from key players like Ferrero International S.A. and The J.M. Smucker Co. to capture emerging consumer segments.
- For instance, Ferrero's international rollout of its plant-based Nutella, which substitutes dairy with chickpeas and rice syrup, is a direct response to the 15% annual growth in the plant-based food category. Similarly, The J.M. Smucker Co.'s leadership restructuring aims to accelerate growth in its core Jif and Smucker's portfolios by focusing on innovation in flavor and format.
- These actions reflect a broader industry trend of adapting iconic brands to meet modern demands for health, sustainability, and dietary inclusivity, even as companies navigate the challenge of volatile raw material costs.
We can help! Our analysts can customize this spreads market research report to meet your requirements.
 RIA -
RIA - 
