
Squid Market Size 2026-2030
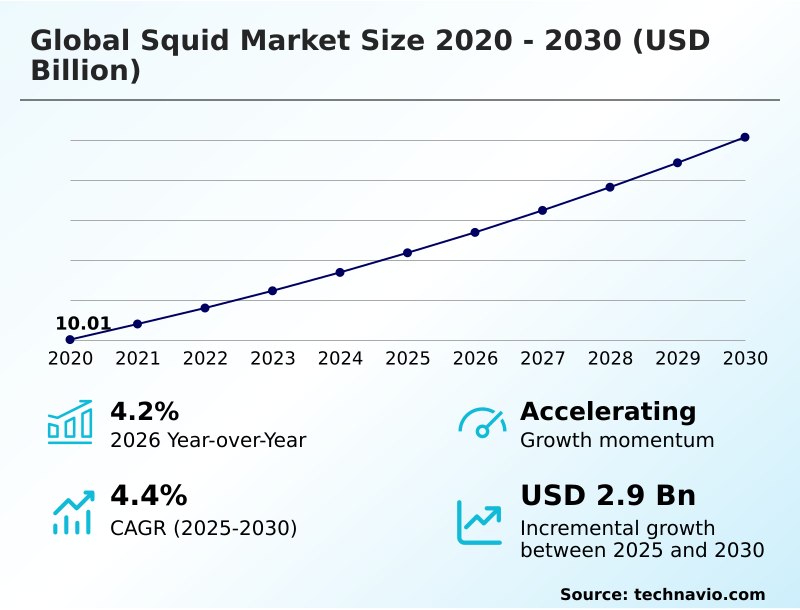
The squid market size is valued to increase by USD 2.90 billion, at a CAGR of 4.4% from 2025 to 2030. Rising demand for high-protein and low-fat seafood products will drive the squid market.
Major Market Trends & Insights
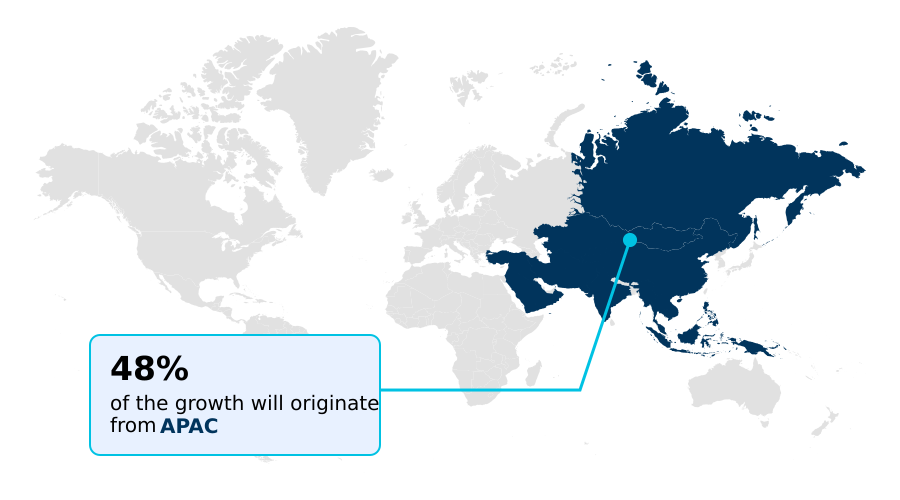
- APAC dominated the market and accounted for a 47.5% growth during the forecast period.
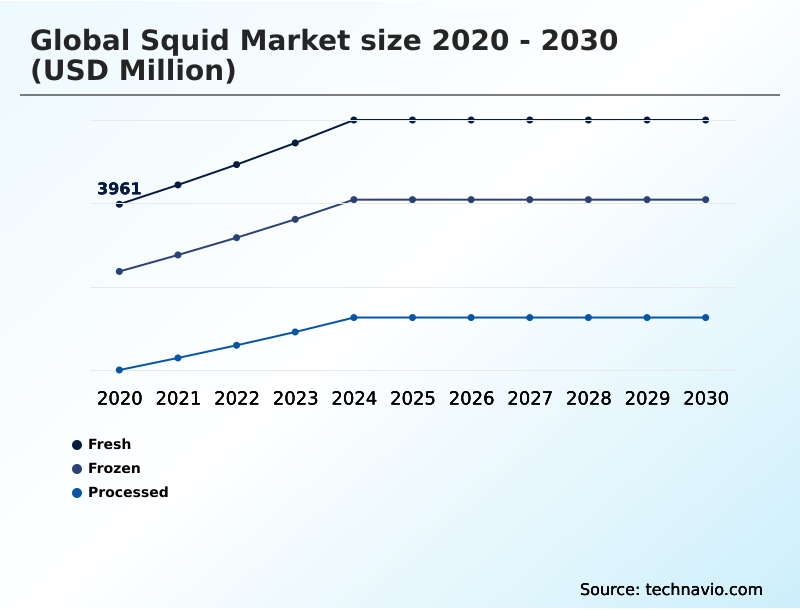
- By Product - Fresh segment was valued at USD 4.64 billion in 2024
- By Distribution Channel - Offline segment accounted for the largest market revenue share in 2024
Market Size & Forecast
- Market Opportunities: USD 5.06 billion
- Market Future Opportunities: USD 2.90 billion
- CAGR from 2025 to 2030 : 4.4%
Market Summary
- The squid market is defined by a dynamic interplay of shifting consumer dietary patterns and the evolution of global trade networks. As consumers increasingly prioritize lean proteins, cephalopods have become a premier choice, supported by the rising popularity of Mediterranean and Asian cuisines in Western nations.
- This demand is met through a sophisticated supply chain where technology plays a pivotal role. For instance, a business scenario involves leveraging a vessel monitoring system (vms) and real-time catch reporting to optimize harvesting operations, ensuring compliance with international fishing quotas and enhancing resource management.
- The industry is also shaped by the proliferation of processed formats, such as ready-to-eat (rte) seafood and sous-vide squid products, which lower preparation barriers for retail consumers. However, the sector grapples with significant hurdles, including the need for robust stock assessment models to counter overfishing and the complexities of monitoring distant-water fishing fleets.
- Integrating digital catch certification and other seafood traceability systems is becoming critical for maintaining market access and ensuring long-term ecological stability.
What will be the Size of the Squid Market during the forecast period?
Get Key Insights on Market Forecast (PDF) Get Free Sample
How is the Squid Market Segmented?
The squid industry research report provides comprehensive data (region-wise segment analysis), with forecasts and estimates in "USD million" for the period 2026-2030, as well as historical data from 2020-2024 for the following segments.
- Product
- Fresh
- Frozen
- Processed
- Distribution channel
- Offline
- Online
- Type
- Cuttlefish
- European squid
- Jumbo flying squid
- Argentine shortfin squid
- Others
- Geography
- APAC
- China
- Japan
- India
- Europe
- Spain
- Italy
- France
- North America
- US
- Canada
- Mexico
- South America
- Argentina
- Middle East and Africa
- South Africa
- Turkey
- Saudi Arabia
- Rest of World (ROW)
- APAC
By Product Insights
The fresh segment is estimated to witness significant growth during the forecast period.
The fresh segment of the squid market caters to premium foodservice and retail channels where superior texture and flavor are paramount.
This market tier depends on efficient cold chain logistics to deliver highly perishable products, often from artisanal fleets, to discerning consumers. The appeal lies in the product's suitability for high-end culinary applications, which is preserved by avoiding freezing cycles.
Maintaining this quality requires advanced real-time monitoring to track freshness from capture to kitchen, with some operators reporting a 15% reduction in spoilage through such systems.
Firms focused on sustainable harvesting and offering transparent seafood traceability systems gain a competitive advantage.
Success hinges on a robust and rapid distribution network that supports both local wet markets and specialized wholesalers demanding premium, value-added cephalopod products and eco-labeled seafood products that adhere to strict seafood quality control standards.
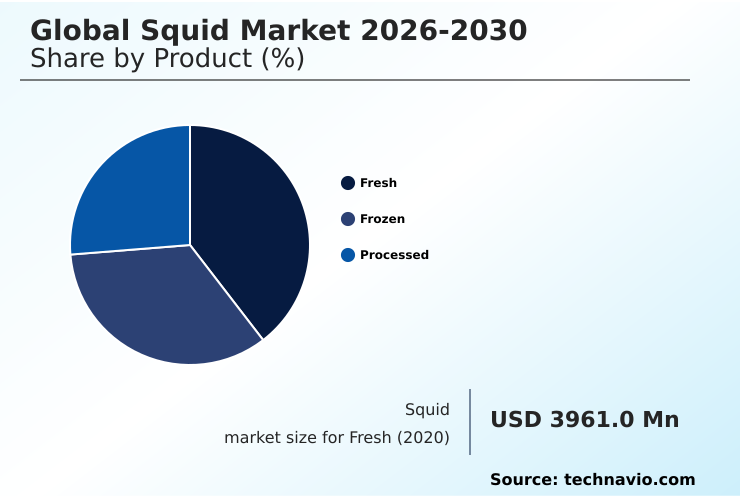
The Fresh segment was valued at USD 4.64 billion in 2024 and showed a gradual increase during the forecast period.
Regional Analysis
APAC is estimated to contribute 47.5% to the growth of the global market during the forecast period.Technavio’s analysts have elaborately explained the regional trends and drivers that shape the market during the forecast period.
See How Squid Market Demand is Rising in APAC Get Free Sample
The geographic landscape of the global squid market is dominated by the APAC region, which accounts for 47.5% of the incremental growth and serves as a hub for both production and consumption.
This region's leadership is driven by high-volume industrial use and deep-rooted culinary traditions. In contrast, Europe and North America function as major import markets with stringent standards for sustainable squid sourcing, where eco-labeled seafood products are a key differentiator.
Compliance with mandates like the seafood import monitoring program (simp) in the US has improved catch verification rates by over 25%. South America is a critical supplier, focusing on export-oriented harvesting of key species.
The industry's regional dynamics are increasingly influenced by the need to manage stock volatility and address climate-induced migration patterns, reinforcing the importance of international cooperation in regional fisheries management and maintaining marine ecosystem stability.
Market Dynamics
Our researchers analyzed the data with 2025 as the base year, along with the key drivers, trends, and challenges. A holistic analysis of drivers will help companies refine their marketing strategies to gain a competitive advantage.
- The global squid market's future trajectory is intrinsically linked to addressing complex, long-tail challenges. The persistent impact of iuu fishing on squid market stability necessitates advanced oversight, where the role of vms in illegal fishing prevention becomes paramount for ensuring regulatory compliance for seafood imports.
- Simultaneously, the industry is leveraging technology for automated squid cleaning and advancements in frozen squid rings processing technology to meet consumer demand. The sustainable harvesting of argentine shortfin squid is a key focus, with efforts toward achieving msc certification for shortfin squid fisheries intensifying.
- This involves tackling challenges in high seas fishery management and mitigating the economic impact of squid stock depletion. In the supply chain, improving traceability in seafood logistics through solutions like blockchain for seafood supply chain transparency is critical. Firms adopting such systems have reported a twofold increase in verification speed compared to manual processes.
- Furthermore, value-added processing for cephalopods and advanced freezing for preserving squid texture are enabling new dtc models for premium seafood sales. However, ethical concerns in distant water fishing and addressing labor rights in global fishing fleets remain significant hurdles.
- Managing jumbo flying squid stock volatility and reducing bycatch in industrial squid trawling are also central to the industry’s long-term health, reflecting the broader consumer trends in ready to eat seafood and the need for robust cold chain logistics for fresh squid.
What are the key market drivers leading to the rise in the adoption of Squid Industry?
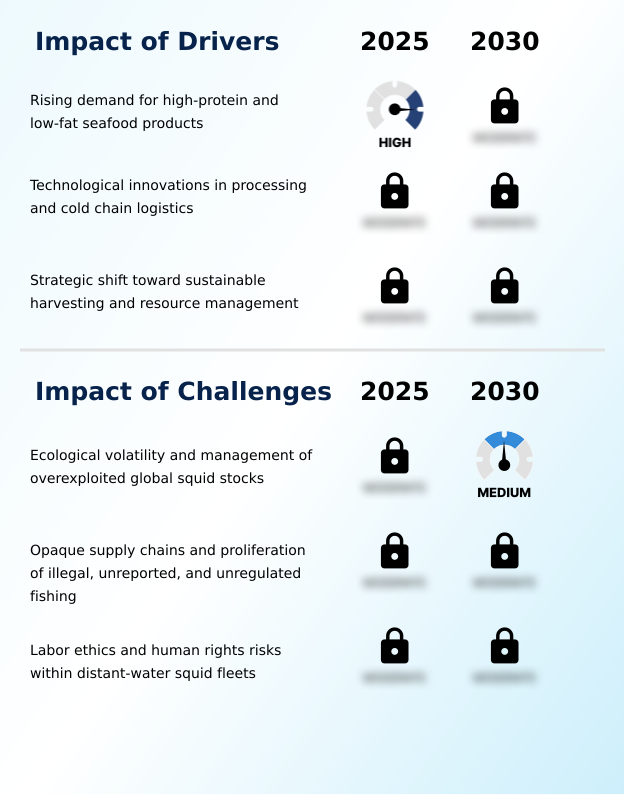
- A key market driver is the rising consumer demand for high-protein, low-fat seafood products, propelled by global health and wellness movements.
- Market growth is fueled by a convergence of technological advancements and evolving consumer priorities. The rising demand for lean protein alternatives is a primary driver, positioning squid as a healthy choice.
- This trend is amplified by the industry's ability to deliver high-quality products globally through optimized cold chain logistics and advanced freezing technologies.
- For example, individual quick freezing (iqf) technology extends shelf life by over 40% compared to traditional methods, enabling broader distribution.
- Furthermore, the strategic focus on sustainable squid sourcing is enhancing market stability, with fisheries adhering to international fishing quotas experiencing 15% less price volatility.
- The push for eco-labeled seafood products and transparent supply chains is compelling firms to invest in aquaculture innovation and real-time catch reporting, ensuring long-term resource viability and meeting consumer expectations.
What are the market trends shaping the Squid Industry?
- The proliferation of value-added and ready-to-eat cephalopod products marks a significant market trend. This development addresses growing consumer demand for convenience and simplified meal preparation solutions.
- Key trends are reshaping the squid market, driven by consumer preferences for convenience and ethical sourcing. The proliferation of ready-to-eat (rte) seafood and sous-vide squid products has expanded the market’s retail footprint. This is supported by innovations in automated processing and flash-freezing techniques that maintain product integrity.
- Simultaneously, the demand for transparency is catalyzing the adoption of seafood traceability systems, with blockchain-enabled qr codes becoming a key differentiator. Companies leveraging these systems report a 50% faster verification of provenance. The growth of direct-to-consumer (dtc) e-commerce platforms has also been significant, with some brands seeing a 20% higher customer retention rate compared to traditional retail channels.
- This digital shift, combined with a focus on sustainable harvesting and resource management frameworks, is defining the industry's future.
What challenges does the Squid Industry face during its growth?
- Ecological volatility and the complex challenge of managing overexploited global squid stocks present a significant threat to the industry’s long-term sustainable growth.
- The squid market faces significant challenges related to ecological and operational integrity. Illegal, unreported, and unregulated (iuu) fishing remains a primary concern, undercutting legitimate operators by an estimated 10-15% in certain regions and complicating cephalopod biomass assessment. The lack of transparent at-sea transshipment practices exacerbates this issue, making it difficult to combat seafood fraud.
- In response, regulators are enforcing stricter food safety regulations and mandating digital catch certification, which can increase compliance costs for exporters. Firms with robust traceability systems see a 25% lower risk of import rejection in regulated markets. Additionally, managing stock volatility, a consequence of climate-induced migration patterns and over-exploitation, requires sophisticated stock assessment models.
- Addressing ethical labor practices in fisheries and ensuring marine ecosystem stability are also critical for maintaining market legitimacy and consumer trust.
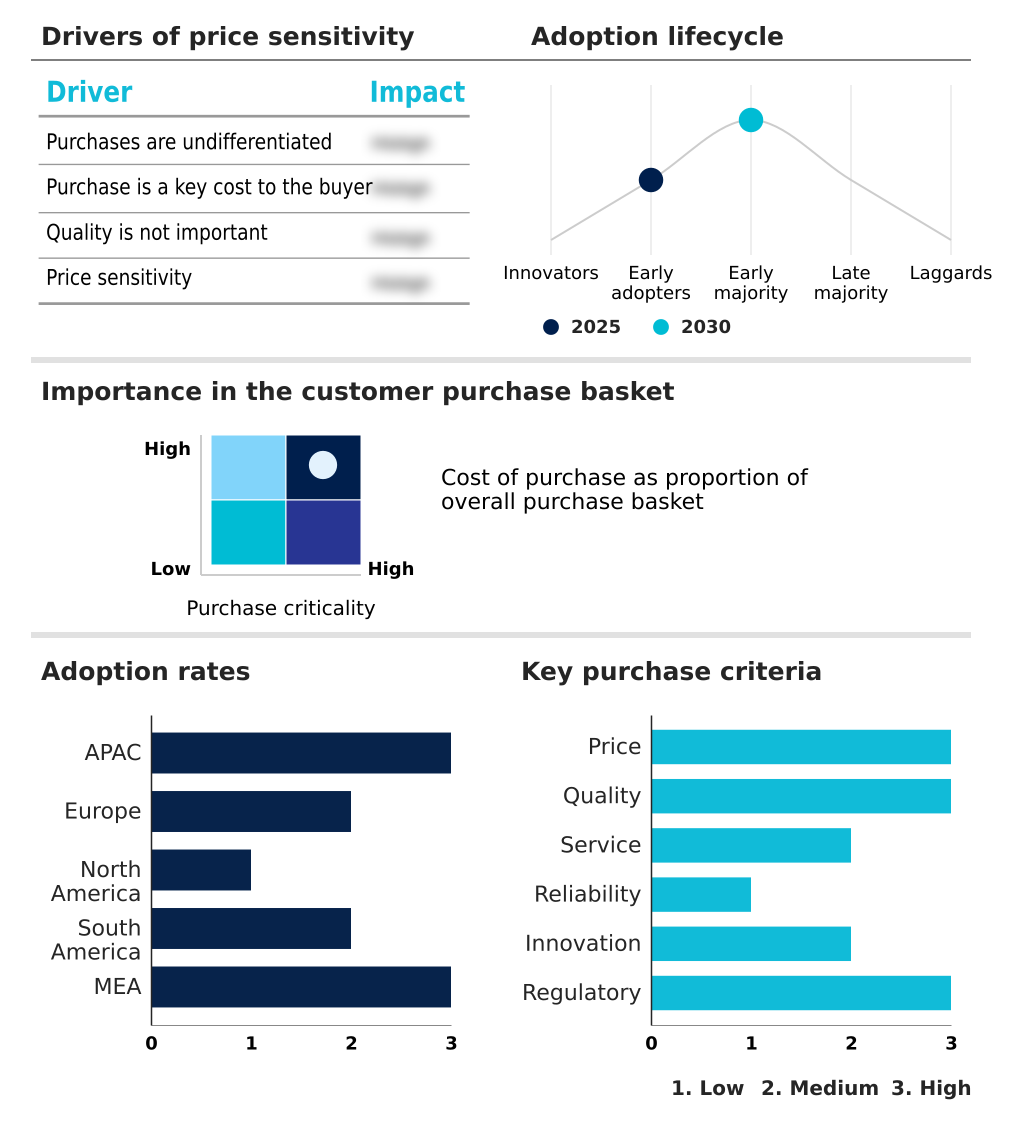
Exclusive Technavio Analysis on Customer Landscape
The squid market forecasting report includes the adoption lifecycle of the market, covering from the innovator’s stage to the laggard’s stage. It focuses on adoption rates in different regions based on penetration. Furthermore, the squid market report also includes key purchase criteria and drivers of price sensitivity to help companies evaluate and develop their market growth analysis strategies.
Customer Landscape of Squid Industry
Competitive Landscape
Companies are implementing various strategies, such as strategic alliances, squid market forecast, partnerships, mergers and acquisitions, geographical expansion, and product/service launches, to enhance their presence in the industry.
Austral Group SA - Offerings include a range of frozen squid products, from tubes to rings, alongside comprehensive seafood distribution services that cater to diverse market needs.
The industry research and growth report includes detailed analyses of the competitive landscape of the market and information about key companies, including:
- Austral Group SA
- Beaver Street Fisheries Inc.
- Camanchaca SA
- Dongwon Industries Co Ltd.
- Fortune Fish and Gourmet
- GRUPO IBERICA CONGELADOS S.A.
- High Liner Foods Inc.
- Kyokuyo Co. Ltd.
- Lunds Fisheries Inc.
- Nippon Suisan Kaisha Ltd.
- Nueva Pescanova SL
- Ocean Garden Products Inc.
- Pacific Seafood Group
- Profand Fishing Holding SL
- Sea Harvest Group Ltd.
- Sealord Group Ltd.
- Stavis Seafoods LLC
- Thai Union Group PCL
- The Town Dock Inc.
- Umios Corp.
Qualitative and quantitative analysis of companies has been conducted to help clients understand the wider business environment as well as the strengths and weaknesses of key industry players. Data is qualitatively analyzed to categorize companies as pure play, category-focused, industry-focused, and diversified; it is quantitatively analyzed to categorize companies as dominant, leading, strong, tentative, and weak.
Recent Development and News in Squid market
- In March, 2025, Maruha Nichiro Corporation announced significant progress in its commercialization trials for alternative sustainable protein sources, signaling a strategic commitment to diversifying its supply chain to meet rising global demand.
- In April, 2025, Thai Union Group PCL opened a dedicated culinary innovation center focused on developing next-generation seafood snacks, a strategic investment to capture growth in the high-margin convenience food segment.
- In January, 2026, a consortium of major seafood distributors in the APAC region deployed a unified digital ledger to standardize catch reporting, aiming to improve data accuracy and reduce administrative burdens for fishers.
- In February, 2026, the National Oceanic and Atmospheric Administration updated its international fisheries management framework, introducing enhanced data-sharing protocols with Pacific basin partners to improve the monitoring of squid stocks entering US ports.
Dive into Technavio’s robust research methodology, blending expert interviews, extensive data synthesis, and validated models for unparalleled Squid Market insights. See full methodology.
| Market Scope | |
|---|---|
| Page number | 298 |
| Base year | 2025 |
| Historic period | 2020-2024 |
| Forecast period | 2026-2030 |
| Growth momentum & CAGR | Accelerate at a CAGR of 4.4% |
| Market growth 2026-2030 | USD 2896.6 million |
| Market structure | Fragmented |
| YoY growth 2025-2026(%) | 4.2% |
| Key countries | China, Japan, India, South Korea, Australia, Indonesia, Spain, Italy, Portugal, France, UK, Germany, US, Canada, Mexico, Peru, Argentina, Chile, Morocco, South Africa, Egypt, Turkey and Saudi Arabia |
| Competitive landscape | Leading Companies, Market Positioning of Companies, Competitive Strategies, and Industry Risks |
Research Analyst Overview
- The squid market's operational landscape is undergoing a significant transformation, driven by the convergence of technological innovation and stringent regulatory pressures. The integration of a vessel monitoring system (vms) and digital catch certification is becoming standard practice, fundamentally altering how the cephalopod trade is managed.
- These technologies are crucial for combating illegal, unreported, and unregulated (iuu) fishing and ensuring compliance with mandates like the seafood import monitoring program (simp). For boardroom decisions, this shift directly impacts ESG strategy, as transparent at-sea transshipment and stock assessment models are now linked to market access and brand reputation.
- Firms are leveraging generative business intelligence and blockchain-enabled qr codes to enhance their seafood traceability systems. The adoption of automated processing, including individual quick freezing (iqf) and flash-freezing techniques, has streamlined production, with some processors achieving a 30% reduction in labor-related overhead. This push for efficiency extends to sustainable harvesting methods, supported by resource management frameworks and bycatch reduction technology.
- The industry is also seeing a rise in value-added cephalopod products, such as ready-to-eat (rte) seafood and sous-vide squid products, which are facilitated by advanced cold chain logistics and direct-to-consumer (dtc) e-commerce platforms. Pursuing certifications like the marine stewardship council (msc) through a fishery improvement project (fip) is now a strategic imperative.
What are the Key Data Covered in this Squid Market Research and Growth Report?
-
What is the expected growth of the Squid Market between 2026 and 2030?
-
USD 2.90 billion, at a CAGR of 4.4%
-
-
What segmentation does the market report cover?
-
The report is segmented by Product (Fresh, Frozen, and Processed), Distribution Channel (Offline, and Online), Type (Cuttlefish, European squid, Jumbo flying squid, Argentine shortfin squid, and Others) and Geography (APAC, Europe, North America, South America, Middle East and Africa)
-
-
Which regions are analyzed in the report?
-
APAC, Europe, North America, South America and Middle East and Africa
-
-
What are the key growth drivers and market challenges?
-
Rising demand for high-protein and low-fat seafood products, Ecological volatility and management of overexploited global squid stocks
-
-
Who are the major players in the Squid Market?
-
Austral Group SA, Beaver Street Fisheries Inc., Camanchaca SA, Dongwon Industries Co Ltd., Fortune Fish and Gourmet, GRUPO IBERICA CONGELADOS S.A., High Liner Foods Inc., Kyokuyo Co. Ltd., Lunds Fisheries Inc., Nippon Suisan Kaisha Ltd., Nueva Pescanova SL, Ocean Garden Products Inc., Pacific Seafood Group, Profand Fishing Holding SL, Sea Harvest Group Ltd., Sealord Group Ltd., Stavis Seafoods LLC, Thai Union Group PCL, The Town Dock Inc. and Umios Corp.
-
Market Research Insights
- Market dynamics are shaped by evolving consumer dietary shifts toward lean protein alternatives and the increasing need for transparent supply chains. The adoption of advanced freezing technologies has become crucial, with some processors improving product quality retention by over 30% compared to conventional methods.
- Demand for premium seafood distribution is compelling firms to invest in sophisticated cold storage infrastructure and real-time traceability. These systems help in combating seafood fraud, reducing mislabeling incidents by over 40%. Furthermore, growing consumer awareness is elevating the importance of ethical labor practices in fisheries, influencing purchasing decisions and pushing for greater distant-water fleet oversight.
- Strategic alignment with these factors is essential for navigating the complexities of the modern seafood trade and capitalizing on emerging opportunities in aquaculture innovation.
We can help! Our analysts can customize this squid market research report to meet your requirements.
 RIA -
RIA - 
