Native Starches Market Analysis APAC, North America, Europe, South America, Middle East and Africa - US, China, Japan, Germany, UK - Size and Forecast 2024-2028

Native Starches Market Analysis APAC, North America, Europe, South America, Middle East and Africa - US, China, Japan, Germany, UK - Size and Forecast 2024-2028

Published: Jan 2024 154 Pages SKU: IRTNTR77197

Market Overview at a Glance

$410.95 Mn
Market Opportunity
4.3%
CAGR
3.2
YoY growth 2023-2024(%)

Native Starches Market Size 2024-2028 

The native starches market size is forecast to increase by USD 410.95 billion at a CAGR of 4.3% between 2023 and 2028.

  • The market is driven by the high demand for cost-effective starches derived from plants, such as corn and tapioca. Corn starch, in particular, is widely used due to its affordability and versatility. Another trend in the market is the utilization of native starches in the production of chemical additives and bioplastics, particularly tapioca starch. However, the market faces challenges due to the constant fluctuations in raw material prices, which can impact the profitability of manufacturers. The market for native starches is witnessing significant growth due to the rising demand for cost-effective starches derived from plants like corn and tapioca. Corn starch, which is widely used for its affordability and versatility, is a major contributor to this growth. In addition, the usage of native starches in the production of chemical additives and bioplastics, particularly tapioca starch, is on the rise. However, the market faces challenges due to the constant fluctuations in raw material prices, which can impact the profitability of manufacturers. Producers must closely monitor these price fluctuations and adapt their strategies accordingly to maintain competitiveness.

What will be the Size of the Market During the Forecast Period?

Native Starches Market Size

 Request Free Sample

  • Native starches, derived from various plants such as corn, wheat, rice, and potato, play a crucial role in the food and non-food industries. These starches, which are unaltered and free from chemical additives, offer several functional qualities that make them an essential ingredient in numerous applications. In the food industry, native starches are widely used in processed goods due to their ease of storage and longer shelf life. The changing lifestyles and rising income levels have led to an increased demand for convenience foods, further boosting the market growth. In the non-food industry, native starches are used as thickening agents, binders, and coating materials in various applications. Organic elements and functional qualities are key drivers for the market. The demand for organic and natural food products is on the rise, and native starches fit perfectly into this trend. Moreover, the ability of native starches to improve texture, provide stability, and enhance the overall quality of food products makes them an attractive option for manufacturers. The carbohydrate content of starches is primarily made up of polysaccharides, which are long chains of glycosidic bonds. The unique properties of these polysaccharides make native starches a versatile ingredient in various industries.

    For instance, in the food industry, they are used as thickening agents in sauces, gravies, and desserts. In the non-food industry, they are used as binding agents in adhesives, coatings, and paper sizing. Future trends in the market include the development of new applications in various industries. For example, in the pharmaceutical industry, native starches are used as excipients in tablet coating and capsule filling. In the textile industry, they are used as sizing agents to improve fabric strength and texture. The dominance of corn, wheat, rice, and potato in the market can be attributed to their availability, ease of processing, and functional properties. Corn starch, for instance, is widely used due to its high yield and excellent binding properties. Wheat starch, on the other hand, is known for its high viscosity and is widely used in the food industry as a thickener. The transportation and logistics sector also plays a crucial role in the market. The ability to transport these starches over long distances without deterioration is essential to ensure a consistent supply to various industries. In conclusion, the market is driven by the increasing demand for organic and natural food products, changing lifestyles, and rising income levels. The versatility of native starches, coupled with their ease of storage and longer shelf life, makes them an attractive option for various industries.

How is this market segmented and which is the largest segment?

The market research report provides comprehensive data (region-wise segment analysis), with forecasts and estimates in "USD million" for the period 2024-2028, as well as historical data from 2018-2022 for the following segments.

  • Type
    • Dry
    • Liquid
  • Application
    • Food and beverages
    • Industrial
    • Feed
  • Geography
    • APAC
      • China
      • Japan
    • North America
      • US
    • Europe
      • Germany
      • UK
    • South America
    • Middle East and Africa

By Type Insights

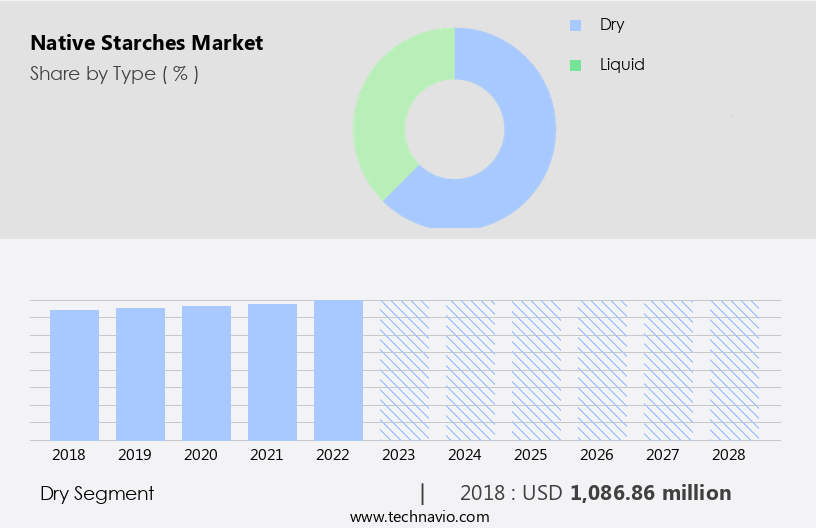
  • The dry segment is estimated to witness significant growth during the forecast period.

The market is predicted to expand substantially in the upcoming years, with dry native starches holding the largest market share in 2023. Dry starches are a vital ingredient used in the production of various foods. Native starches, derived from natural sources like corn, wheat, rice, potato, cassava, and others, offer numerous advantages and are widely employed across industries, including food, paper, cosmetics, personal care, and textiles. In the personal hygiene and cosmetics sector, native starches serve as a versatile additive, enhancing texture and improving product performance. The increasing consumer preference for processed foods and the growing demand for natural ingredients are key factors driving the growth of the market.

Native Starches Market Size

Get a glance at the market report of share of various segments Request Free Sample

The Dry segment was valued at USD 1.08 billion in 2018 and showed a gradual increase during the forecast period.

Regional Analysis

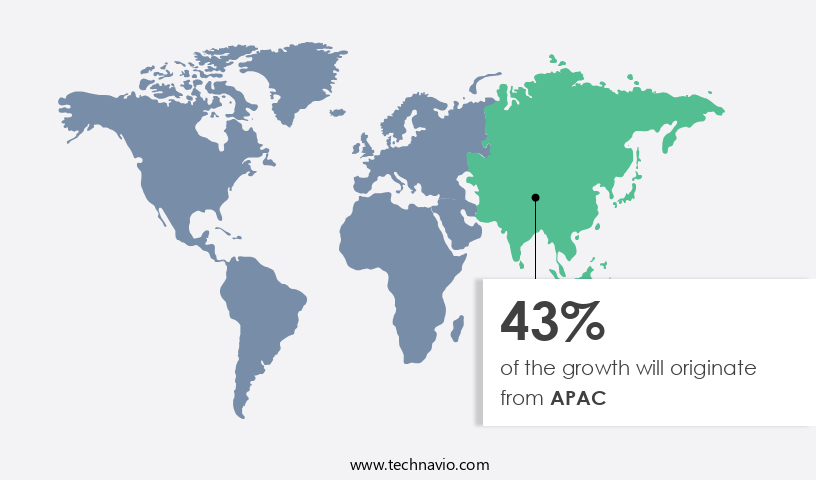
  • APAC is estimated to contribute 43% to the growth of the global market during the forecast period.

Technavio's analysts have elaborately explained the regional trends and drivers that shape the market during the forecast period.

Native Starches Market Share by Geography

For more insights on the market share of various regions, Request Free Sample

The native starch market in the Asia Pacific region is poised for significant growth in the coming years. Two key countries, India and China, are driving this progress due to their high demand for native starch. India, with its strong agricultural sector, presents a promising market for the global native starch industry. The Indian food processing industry offers ample opportunities for native starch utilization, thanks to increasing government initiatives. For instance, the Ministry of Food Processing Industries (MoFPI), a government body in India, has assigned projects to local companies to establish starch-based food parks. These initiatives are expected to boost the demand for native starch in the region.

According to quantitative analysis, the market is projected to expand at a steady pace, offering investment pockets for businesses looking to capitalize on these opportunities. Future estimations suggest that the native starch market in APAC will continue to be a significant contributor to the global market. Key players in the industry include Market Research Store, TechSci Research, and Fact.MR, among others. Companies are advised to keep abreast of market trends and opportunities to maximize their growth potential in this sector.

Market Dynamics

Our researchers analyzed the data with 2023 as the base year, along with the key drivers, trends, and challenges. A holistic analysis of drivers will help companies refine their marketing strategies to gain a competitive advantage.

What are the key market drivers leading to the rise in adoption of Native Starches Market?

High demand for corn starch as less expensive starch is the key driver of the market.

  • The market is experiencing significant growth due to the increasing demand for corn starch in both the food products sector and the non-food industry. Corn starch's functional qualities, including its ability to thicken and bind, make it a popular choice for various applications. In the food industry, corn starch is frequently used as a replacement for wheat in gluten-free food products. This is because corn starch contains less gluten than wheat, making it a preferred option for those with gluten sensitivities. Furthermore, the abundance of corn, particularly in North America, contributes to the growth of the market.
  • Additionally, the price of corn starch is generally lower than that of other starches, such as tapioca, making it a cost-effective choice for manufacturers. Looking ahead, future trends in the market include the increasing demand for organic elements and modified food starches. Organic starches are gaining popularity due to their health benefits, while modified food starches offer improved functional qualities for various industries. Overall, the market is expected to continue growing as demand for these versatile carbohydrates increases.

What are the market trends shaping the Native Starches Market?

The usage of tapioca in bioplastics is the upcoming trend in the market.

  • Native starches, derived from various plants, serve as the foundation for the production of biodegradable bioplastics. These bioplastics are eco-friendly alternatives to traditional plastics, as they can be decomposed by microorganisms. Among the different types of bioplastics, starch-based bioplastics are the most widely used. These bioplastics are manufactured from natural or modified starches, such as potato, corn, wheat, and tapioca. Tapioca, a common starch source, enhances the degradability of bioplastics due to its stable granules that decompose at elevated temperatures.
  • The granules maintain their structure when mixed with polymers at high temperatures and pressure. Consequently, bioplastics derived from tapioca are odorless, smooth, and transparent. Chemical additives may be incorporated into these starch-based bioplastics to improve their properties, such as water resistance and heat stability. The transportation and application of these native starch-derived bioplastics can contribute significantly to the reduction of carbon emissions and the circular economy.

What challenges does the Native Starches Market face during its growth?

The constant fluctuation in raw material prices is a key challenge affecting market growth.

  • The native starch market in the US has experienced price fluctuations for raw materials used in the production of processed starch derivatives. These price changes are not solely influenced by availability but also by natural market conditions. Producers of native starch consider the cost of acquiring raw materials to manufacture native starch derivatives. Native starch serves as a crucial ingredient in the creation of starch derivatives. The unpredictability of raw material prices can cause uncertainty among market companies regarding pricing for their native starch derivatives. Additionally, this volatility may result in increased starch prices to secure substantial profit margins. Category-wise insights reveal that segment dominance varies, with ease of storage and longer shelf life being significant factors.
  • Understanding these trends and market dynamics can aid businesses in making informed decisions and staying competitive in the evolving market landscape. The native starch industry's future growth is influenced by changing lifestyles and rising income levels, making it an essential sector for businesses and investors.

Exclusive Customer Landscape

The market forecasting report includes the adoption lifecycle of the market, covering from the innovator's stage to the laggard's stage. It focuses on adoption rates in different regions based on penetration. Furthermore, the market report also includes key purchase criteria and drivers of price sensitivity to help companies evaluate and develop their market growth analysis strategies.

Native Starches Market Share by Geography

 Customer Landscape

Key Companies & Market Insights

Companies are implementing various strategies, such as strategic alliances, market forecast , partnerships, mergers and acquisitions, geographical expansion, and product/service launches, to enhance their presence in the market.

The market research and growth report includes detailed analyses of the competitive landscape of the market and information about key companies, including:

  • AMYLCO Group of Companies
  • Archer Daniels Midland Co.
  • Cargill Inc.
  • Euroduna Food Ingredients GmbH
  • Everest Starch India Pvt. Ltd.
  • Gulshan Polyols Ltd.
  • Ingredion Inc.
  • KMC
  • Manildra Flour Mills Pty. Ltd.
  • Roquette Freres SA
  • Royal Avebe
  • SPAC Starch Products India Pvt. Ltd.
  • Sudzucker AG
  • Tate and Lyle PLC
  • Tereos Participations
  • Thai Flour Mill Industry Co. Ltd.
  • Universal Biopolymers
  • WPPZ S.A.

Qualitative and quantitative analysis of companies has been conducted to help clients understand the wider business environment as well as the strengths and weaknesses of key market players. Data is qualitatively analyzed to categorize companies as pure play, category-focused, industry-focused, and diversified; it is quantitatively analyzed to categorize companies as dominant, leading, strong, tentative, and weak.

Research Analyst Overview

Native starches are derived from various plants such as corn, wheat, rice, potato, and cassava, and are a crucial component in both the food and non-food industries. In the food sector, they serve as functional qualities like thickening agents, dough-binding agents, and stabilizers in processed goods. In the non-food industry, native starches find applications in various sectors like the pet food industry and the paper industry. The changing lifestyles and rising income levels have led to an increase in demand for convenience food products, driving the market growth. Organic elements and modified starches are gaining popularity due to their ease of storage and longer shelf life, making them preferred choices for manufacturers. Native starches are polysaccharides made up of glycosidic bonds, and their usage extends beyond food applications.

Moreover, they are used as thickening agents, stabilizers, and binders in various industries. Modified starches undergo chemical processes to enhance their functional properties, making them suitable for specific applications. Future trends indicate a shift towards the use of natural and organic starches in response to consumer preferences for healthier food options. The market for native starches is segmented based on sources, applications, and regions. Corn and wheat starches dominate the market due to their ease of availability and versatility. The transportation and logistics sector also contributes significantly to the market, as they are essential for the production of various industrial products. The study of the market provides future estimations, investment pockets, and market opportunities for stakeholders.

Market Scope

Report Coverage

Details

Page number

154

Base year

2023

Historic period

2018-2022

Forecast period

2024-2028

Growth momentum & CAGR

Accelerate at a CAGR of 4.3%

Market growth 2024-2028

USD 410.95 million

Market structure

Fragmented

YoY growth 2023-2024(%)

3.2

Key countries

US, China, Japan, Germany, and UK

Competitive landscape

Leading Companies, Market Positioning of Companies, Competitive Strategies, and Industry Risks

Request Free Sample

What are the Key Data Covered in this Market Research and Growth Report?

  • CAGR of the market during the forecast period
  • Detailed information on factors that will drive the market growth and forecasting between 2024 and 2028
  • Precise estimation of the size of the market  and its contribution of the market in focus to the parent market
  • Accurate predictions about upcoming market growth and trends and changes in consumer behaviour
  • Growth of the market across APAC, North America, Europe, South America, and Middle East and Africa
  • Thorough analysis of the market's competitive landscape and detailed information about companies
  • Comprehensive analysis of factors that will challenge the growth of market companies

We can help! Our analysts can customize this market research report to meet your requirements. Get in touch

1 Executive Summary

  • 1.1 Market overview
    • Exhibit 01: Executive Summary – Chart on Market Overview
    • Exhibit 02: Executive Summary – Data Table on Market Overview
    • Exhibit 03: Executive Summary – Chart on Global Market Characteristics
    • Exhibit 04: Executive Summary – Chart on Market by Geography
    • Exhibit 05: Executive Summary – Chart on Market Segmentation by Type
    • Exhibit 06: Executive Summary – Chart on Market Segmentation by Application
    • Exhibit 07: Executive Summary – Chart on Incremental Growth
    • Exhibit 08: Executive Summary – Data Table on Incremental Growth
    • Exhibit 09: Executive Summary – Chart on Vendor Market Positioning

2 Market Landscape

  • 2.1 Market ecosystem
    • Exhibit 10: Parent market
    • Exhibit 11: Market Characteristics

3 Market Sizing

  • 3.1 Market definition
    • Exhibit 12: Offerings of vendors included in the market definition
  • 3.2 Market segment analysis
    • Exhibit 13: Market segments
  • 3.3 Market size 2023
    • 3.4 Market outlook: Forecast for 2023-2028
      • Exhibit 14: Chart on Global - Market size and forecast 2023-2028 ($ million)
      • Exhibit 15: Data Table on Global - Market size and forecast 2023-2028 ($ million)
      • Exhibit 16: Chart on Global Market: Year-over-year growth 2023-2028 (%)
      • Exhibit 17: Data Table on Global Market: Year-over-year growth 2023-2028 (%)

    4 Historic Market Size

    • 4.1 Global native starches market 2018 - 2022
      • Exhibit 18: Historic Market Size – Data Table on global native starches market 2018 - 2022 ($ million)
    • 4.2 Type Segment Analysis 2018 - 2022
      • Exhibit 19: Historic Market Size – Type Segment 2018 - 2022 ($ million)
    • 4.3 Application Segment Analysis 2018 - 2022
      • Exhibit 20: Historic Market Size – Application Segment 2018 - 2022 ($ million)
    • 4.4 Geography Segment Analysis 2018 - 2022
      • Exhibit 21: Historic Market Size – Geography Segment 2018 - 2022 ($ million)
    • 4.5 Country Segment Analysis 2018 - 2022
      • Exhibit 22: Historic Market Size – Country Segment 2018 - 2022 ($ million)

    5 Five Forces Analysis

    • 5.1 Five forces summary
      • Exhibit 23: Five forces analysis - Comparison between 2023 and 2028
    • 5.2 Bargaining power of buyers
      • Exhibit 24: Chart on Bargaining power of buyers – Impact of key factors 2023 and 2028
    • 5.3 Bargaining power of suppliers
      • Exhibit 25: Bargaining power of suppliers – Impact of key factors in 2023 and 2028
    • 5.4 Threat of new entrants
      • Exhibit 26: Threat of new entrants – Impact of key factors in 2023 and 2028
    • 5.5 Threat of substitutes
      • Exhibit 27: Threat of substitutes – Impact of key factors in 2023 and 2028
    • 5.6 Threat of rivalry
      • Exhibit 28: Threat of rivalry – Impact of key factors in 2023 and 2028
    • 5.7 Market condition
      • Exhibit 29: Chart on Market condition - Five forces 2023 and 2028

    6 Market Segmentation by Type

    • 6.1 Market segments
      • Exhibit 30: Chart on Type - Market share 2023-2028 (%)
      • Exhibit 31: Data Table on Type - Market share 2023-2028 (%)
    • 6.2 Comparison by Type
      • Exhibit 32: Chart on Comparison by Type
      • Exhibit 33: Data Table on Comparison by Type
    • 6.3 Dry - Market size and forecast 2023-2028
      • Exhibit 34: Chart on Dry - Market size and forecast 2023-2028 ($ million)
      • Exhibit 35: Data Table on Dry - Market size and forecast 2023-2028 ($ million)
      • Exhibit 36: Chart on Dry - Year-over-year growth 2023-2028 (%)
      • Exhibit 37: Data Table on Dry - Year-over-year growth 2023-2028 (%)
    • 6.4 Liquid - Market size and forecast 2023-2028
      • Exhibit 38: Chart on Liquid - Market size and forecast 2023-2028 ($ million)
      • Exhibit 39: Data Table on Liquid - Market size and forecast 2023-2028 ($ million)
      • Exhibit 40: Chart on Liquid - Year-over-year growth 2023-2028 (%)
      • Exhibit 41: Data Table on Liquid - Year-over-year growth 2023-2028 (%)
    • 6.5 Market opportunity by Type
      • Exhibit 42: Market opportunity by Type ($ million)
      • Exhibit 43: Data Table on Market opportunity by Type ($ million)

    7 Market Segmentation by Application

    • 7.1 Market segments
      • Exhibit 44: Chart on Application - Market share 2023-2028 (%)
      • Exhibit 45: Data Table on Application - Market share 2023-2028 (%)
    • 7.2 Comparison by Application
      • Exhibit 46: Chart on Comparison by Application
      • Exhibit 47: Data Table on Comparison by Application
    • 7.3 Food and beverages - Market size and forecast 2023-2028
      • Exhibit 48: Chart on Food and beverages - Market size and forecast 2023-2028 ($ million)
      • Exhibit 49: Data Table on Food and beverages - Market size and forecast 2023-2028 ($ million)
      • Exhibit 50: Chart on Food and beverages - Year-over-year growth 2023-2028 (%)
      • Exhibit 51: Data Table on Food and beverages - Year-over-year growth 2023-2028 (%)
    • 7.4 Industrial - Market size and forecast 2023-2028
      • Exhibit 52: Chart on Industrial - Market size and forecast 2023-2028 ($ million)
      • Exhibit 53: Data Table on Industrial - Market size and forecast 2023-2028 ($ million)
      • Exhibit 54: Chart on Industrial - Year-over-year growth 2023-2028 (%)
      • Exhibit 55: Data Table on Industrial - Year-over-year growth 2023-2028 (%)
    • 7.5 Feed - Market size and forecast 2023-2028
      • Exhibit 56: Chart on Feed - Market size and forecast 2023-2028 ($ million)
      • Exhibit 57: Data Table on Feed - Market size and forecast 2023-2028 ($ million)
      • Exhibit 58: Chart on Feed - Year-over-year growth 2023-2028 (%)
      • Exhibit 59: Data Table on Feed - Year-over-year growth 2023-2028 (%)
    • 7.6 Market opportunity by Application
      • Exhibit 60: Market opportunity by Application ($ million)
      • Exhibit 61: Data Table on Market opportunity by Application ($ million)

    8 Customer Landscape

    • 8.1 Customer landscape overview
      • Exhibit 62: Analysis of price sensitivity, lifecycle, customer purchase basket, adoption rates, and purchase criteria

    9 Geographic Landscape

    • 9.1 Geographic segmentation
      • Exhibit 63: Chart on Market share by geography 2023-2028 (%)
      • Exhibit 64: Data Table on Market share by geography 2023-2028 (%)
    • 9.2 Geographic comparison
      • Exhibit 65: Chart on Geographic comparison
      • Exhibit 66: Data Table on Geographic comparison
    • 9.3 APAC - Market size and forecast 2023-2028
      • Exhibit 67: Chart on APAC - Market size and forecast 2023-2028 ($ million)
      • Exhibit 68: Data Table on APAC - Market size and forecast 2023-2028 ($ million)
      • Exhibit 69: Chart on APAC - Year-over-year growth 2023-2028 (%)
      • Exhibit 70: Data Table on APAC - Year-over-year growth 2023-2028 (%)
    • 9.4 North America - Market size and forecast 2023-2028
      • Exhibit 71: Chart on North America - Market size and forecast 2023-2028 ($ million)
      • Exhibit 72: Data Table on North America - Market size and forecast 2023-2028 ($ million)
      • Exhibit 73: Chart on North America - Year-over-year growth 2023-2028 (%)
      • Exhibit 74: Data Table on North America - Year-over-year growth 2023-2028 (%)
    • 9.5 Europe - Market size and forecast 2023-2028
      • Exhibit 75: Chart on Europe - Market size and forecast 2023-2028 ($ million)
      • Exhibit 76: Data Table on Europe - Market size and forecast 2023-2028 ($ million)
      • Exhibit 77: Chart on Europe - Year-over-year growth 2023-2028 (%)
      • Exhibit 78: Data Table on Europe - Year-over-year growth 2023-2028 (%)
    • 9.6 South America - Market size and forecast 2023-2028
      • Exhibit 79: Chart on South America - Market size and forecast 2023-2028 ($ million)
      • Exhibit 80: Data Table on South America - Market size and forecast 2023-2028 ($ million)
      • Exhibit 81: Chart on South America - Year-over-year growth 2023-2028 (%)
      • Exhibit 82: Data Table on South America - Year-over-year growth 2023-2028 (%)
    • 9.7 Middle East and Africa - Market size and forecast 2023-2028
      • Exhibit 83: Chart on Middle East and Africa - Market size and forecast 2023-2028 ($ million)
      • Exhibit 84: Data Table on Middle East and Africa - Market size and forecast 2023-2028 ($ million)
      • Exhibit 85: Chart on Middle East and Africa - Year-over-year growth 2023-2028 (%)
      • Exhibit 86: Data Table on Middle East and Africa - Year-over-year growth 2023-2028 (%)
    • 9.8 US - Market size and forecast 2023-2028
      • Exhibit 87: Chart on US - Market size and forecast 2023-2028 ($ million)
      • Exhibit 88: Data Table on US - Market size and forecast 2023-2028 ($ million)
      • Exhibit 89: Chart on US - Year-over-year growth 2023-2028 (%)
      • Exhibit 90: Data Table on US - Year-over-year growth 2023-2028 (%)
    • 9.9 China - Market size and forecast 2023-2028
      • Exhibit 91: Chart on China - Market size and forecast 2023-2028 ($ million)
      • Exhibit 92: Data Table on China - Market size and forecast 2023-2028 ($ million)
      • Exhibit 93: Chart on China - Year-over-year growth 2023-2028 (%)
      • Exhibit 94: Data Table on China - Year-over-year growth 2023-2028 (%)
    • 9.10 Japan - Market size and forecast 2023-2028
      • Exhibit 95: Chart on Japan - Market size and forecast 2023-2028 ($ million)
      • Exhibit 96: Data Table on Japan - Market size and forecast 2023-2028 ($ million)
      • Exhibit 97: Chart on Japan - Year-over-year growth 2023-2028 (%)
      • Exhibit 98: Data Table on Japan - Year-over-year growth 2023-2028 (%)
    • 9.11 Germany - Market size and forecast 2023-2028
      • Exhibit 99: Chart on Germany - Market size and forecast 2023-2028 ($ million)
      • Exhibit 100: Data Table on Germany - Market size and forecast 2023-2028 ($ million)
      • Exhibit 101: Chart on Germany - Year-over-year growth 2023-2028 (%)
      • Exhibit 102: Data Table on Germany - Year-over-year growth 2023-2028 (%)
    • 9.12 UK - Market size and forecast 2023-2028
      • Exhibit 103: Chart on UK - Market size and forecast 2023-2028 ($ million)
      • Exhibit 104: Data Table on UK - Market size and forecast 2023-2028 ($ million)
      • Exhibit 105: Chart on UK - Year-over-year growth 2023-2028 (%)
      • Exhibit 106: Data Table on UK - Year-over-year growth 2023-2028 (%)
    • 9.13 Market opportunity by geography
      • Exhibit 107: Market opportunity by geography ($ million)
      • Exhibit 108: Data Tables on Market opportunity by geography ($ million)

    10 Drivers, Challenges, and Trends

    • 10.1 Market drivers
      • 10.2 Market challenges
        • 10.3 Impact of drivers and challenges
          • Exhibit 109: Impact of drivers and challenges in 2023 and 2028
        • 10.4 Market trends

          11 Vendor Landscape

          • 11.1 Overview
            • 11.2 Vendor landscape
              • Exhibit 110: Overview on Criticality of inputs and Factors of differentiation
            • 11.3 Landscape disruption
              • Exhibit 111: Overview on factors of disruption
            • 11.4 Industry risks
              • Exhibit 112: Impact of key risks on business

            12 Vendor Analysis

            • 12.1 Vendors covered
              • Exhibit 113: Vendors covered
            • 12.2 Market positioning of vendors
              • Exhibit 114: Matrix on vendor position and classification
            • 12.3 AMYLCO Group of Companies
              • Exhibit 115: AMYLCO Group of Companies - Overview
              • Exhibit 116: AMYLCO Group of Companies - Product / Service
              • Exhibit 117: AMYLCO Group of Companies - Key offerings
            • 12.4 Archer Daniels Midland Co.
              • Exhibit 118: Archer Daniels Midland Co. - Overview
              • Exhibit 119: Archer Daniels Midland Co. - Business segments
              • Exhibit 120: Archer Daniels Midland Co. - Key offerings
              • Exhibit 121: Archer Daniels Midland Co. - Segment focus
            • 12.5 Cargill Inc.
              • Exhibit 122: Cargill Inc. - Overview
              • Exhibit 123: Cargill Inc. - Product / Service
              • Exhibit 124: Cargill Inc. - Key news
              • Exhibit 125: Cargill Inc. - Key offerings
            • 12.6 Euroduna Food Ingredients GmbH
              • Exhibit 126: Euroduna Food Ingredients GmbH - Overview
              • Exhibit 127: Euroduna Food Ingredients GmbH - Product / Service
              • Exhibit 128: Euroduna Food Ingredients GmbH - Key offerings
            • 12.7 Gulshan Polyols Ltd.
              • Exhibit 129: Gulshan Polyols Ltd. - Overview
              • Exhibit 130: Gulshan Polyols Ltd. - Business segments
              • Exhibit 131: Gulshan Polyols Ltd. - Key offerings
              • Exhibit 132: Gulshan Polyols Ltd. - Segment focus
            • 12.8 Ingredion Inc.
              • Exhibit 133: Ingredion Inc. - Overview
              • Exhibit 134: Ingredion Inc. - Business segments
              • Exhibit 135: Ingredion Inc. - Key news
              • Exhibit 136: Ingredion Inc. - Key offerings
              • Exhibit 137: Ingredion Inc. - Segment focus
            • 12.9 Manildra Flour Mills Pty. Ltd.
              • Exhibit 138: Manildra Flour Mills Pty. Ltd. - Overview
              • Exhibit 139: Manildra Flour Mills Pty. Ltd. - Product / Service
              • Exhibit 140: Manildra Flour Mills Pty. Ltd. - Key offerings
            • 12.10 Roquette Freres SA
              • Exhibit 141: Roquette Freres SA - Overview
              • Exhibit 142: Roquette Freres SA - Product / Service
              • Exhibit 143: Roquette Freres SA - Key offerings
            • 12.11 Royal Avebe
              • Exhibit 144: Royal Avebe - Overview
              • Exhibit 145: Royal Avebe - Product / Service
              • Exhibit 146: Royal Avebe - Key offerings
            • 12.12 SPAC Starch Products India Pvt. Ltd.
              • Exhibit 147: SPAC Starch Products India Pvt. Ltd. - Overview
              • Exhibit 148: SPAC Starch Products India Pvt. Ltd. - Product / Service
              • Exhibit 149: SPAC Starch Products India Pvt. Ltd. - Key offerings
            • 12.13 Sudzucker AG
              • Exhibit 150: Sudzucker AG - Overview
              • Exhibit 151: Sudzucker AG - Business segments
              • Exhibit 152: Sudzucker AG - Key offerings
              • Exhibit 153: Sudzucker AG - Segment focus
            • 12.14 Tate and Lyle PLC
              • Exhibit 154: Tate and Lyle PLC - Overview
              • Exhibit 155: Tate and Lyle PLC - Business segments
              • Exhibit 156: Tate and Lyle PLC - Key news
              • Exhibit 157: Tate and Lyle PLC - Key offerings
              • Exhibit 158: Tate and Lyle PLC - Segment focus
            • 12.15 Tereos Participations
              • Exhibit 159: Tereos Participations - Overview
              • Exhibit 160: Tereos Participations - Product / Service
              • Exhibit 161: Tereos Participations - Key offerings
            • 12.16 Thai Flour Mill Industry Co. Ltd.
              • Exhibit 162: Thai Flour Mill Industry Co. Ltd. - Overview
              • Exhibit 163: Thai Flour Mill Industry Co. Ltd. - Product / Service
              • Exhibit 164: Thai Flour Mill Industry Co. Ltd. - Key offerings
            • 12.17 Universal Biopolymers
              • Exhibit 165: Universal Biopolymers - Overview
              • Exhibit 166: Universal Biopolymers - Product / Service
              • Exhibit 167: Universal Biopolymers - Key offerings

            13 Appendix

            • 13.1 Scope of the report
              • 13.2 Inclusions and exclusions checklist
                • Exhibit 168: Inclusions checklist
                • Exhibit 169: Exclusions checklist
              • 13.3 Currency conversion rates for US$
                • Exhibit 170: Currency conversion rates for US$
              • 13.4 Research methodology
                • Exhibit 171: Research methodology
                • Exhibit 172: Validation techniques employed for market sizing
                • Exhibit 173: Information sources
              • 13.5 List of abbreviations
                • Exhibit 174: List of abbreviations

              Research Methodology

              Technavio presents a detailed picture of the market by way of study, synthesis, and summation of data from multiple sources. The analysts have presented the various facets of the market with a particular focus on identifying the key industry influencers. The data thus presented is comprehensive, reliable, and the result of extensive research, both primary and secondary.

              INFORMATION SOURCES

              Primary sources

              • Manufacturers and suppliers
              • Channel partners
              • Industry experts
              • Strategic decision makers

              Secondary sources

              • Industry journals and periodicals
              • Government data
              • Financial reports of key industry players
              • Historical data
              • Press releases

              DATA ANALYSIS

              Data Synthesis

              • Collation of data
              • Estimation of key figures
              • Analysis of derived insights

              Data Validation

              • Triangulation with data models
              • Reference against proprietary databases
              • Corroboration with industry experts

              REPORT WRITING

              Qualitative

              • Market drivers
              • Market challenges
              • Market trends
              • Five forces analysis

              Quantitative

              • Market size and forecast
              • Market segmentation
              • Geographical insights
              • Competitive landscape

              Interested in this report?

              Get your sample now to see our research methodology and insights!

              Download Now

              Frequently Asked Questions

              Native Starches market growth will increase by $ 410.95 mn during 2024-2028 .

              The Native Starches market is expected to grow at a CAGR of 4.3% during 2024-2028 .

              Native Starches market is segmented by Type( Dry, Liquid) Application( Food and beverages, Industrial, Feed)

              AMYLCO Group of Companies, Archer Daniels Midland Co., Cargill Inc., Euroduna Food Ingredients GmbH, Everest Starch India Pvt. Ltd., Gulshan Polyols Ltd., Ingredion Inc., KMC, Manildra Flour Mills Pty. Ltd., Roquette Freres SA, Royal Avebe, SPAC Starch Products India Pvt. Ltd., Sudzucker AG, Tate and Lyle PLC, Tereos Participations, Thai Flour Mill Industry Co. Ltd., Universal Biopolymers, WPPZ S.A. are a few of the key vendors in the Native Starches market.

              APAC will register the highest growth rate of 43% among the other regions. Therefore, the Native Starches market in APAC is expected to garner significant business opportunities for the vendors during the forecast period.

              US, China, Japan, Germany, UK

              • High demand for corn starch as less expensive starchThe growth in the global native starches market can be attributed to the high demand for corn starch in the food and beverage industry. This is primarily due to the large-scale application areas of corn starch. In addition is the driving factor this market.
              • the abundance of corn is the driving factor this market.
              • particularly in agriculture-rich countries such as India and China is the driving factor this market.
              • fosters growth in the global native starches market. Corn is a major source used for producing native starch. Corn starch is used in food applications for gluten-free products in place of wheat. Wheat has high gluten in it. In addition is the driving factor this market.
              • the price of corn starch is lower than that of wheat or tapioca starches. Corn starch is not just used as a thickening agent but also is a high source of energy. The use of corn starch is also known to lower blood sugar in humans. In addition is the driving factor this market.
              • corn starch has excellent soothing and moisture-absorbing power. Therefore is the driving factor this market.
              • it is also used in cosmetics as an ideal solution for skin problems. The ingredient also offers a relatively less expensive alternative when it comes to store-bought products. For instance is the driving factor this market.
              • corn starch is also used to:  Clean stuffed animal toys Freshen is the driving factor this market.
              • musty books  Polish silver Therefore is the driving factor this market.
              • the use of corn starch goes beyond its application in the food and beverages industry. The versatility of the ingredient makes it ideal for different purposes is the driving factor this market.
              • thereby augmenting the demand for corn starch is the driving factor this market.
              • which will drive the growth of the global native starches market during the forecast period.  is the driving factor this market.

              The Native Starches market vendors should focus on grabbing business opportunities from the Dry segment as it accounted for the largest market share in the base year.