Steel Wire Market Analysis APAC, Europe, North America, Middle East and Africa, South America - US, China, India, Japan, Russia - Size and Forecast 2024-2028

Steel Wire Market Analysis APAC, Europe, North America, Middle East and Africa, South America - US, China, India, Japan, Russia - Size and Forecast 2024-2028

Published: Jan 2024 174 Pages SKU: IRTNTR73654

Market Overview at a Glance

$28.78 B
Market Opportunity
4.69%
CAGR
4.18
YoY growth 2023-2024(%)

Steel Wire Market Size 2024-2028 

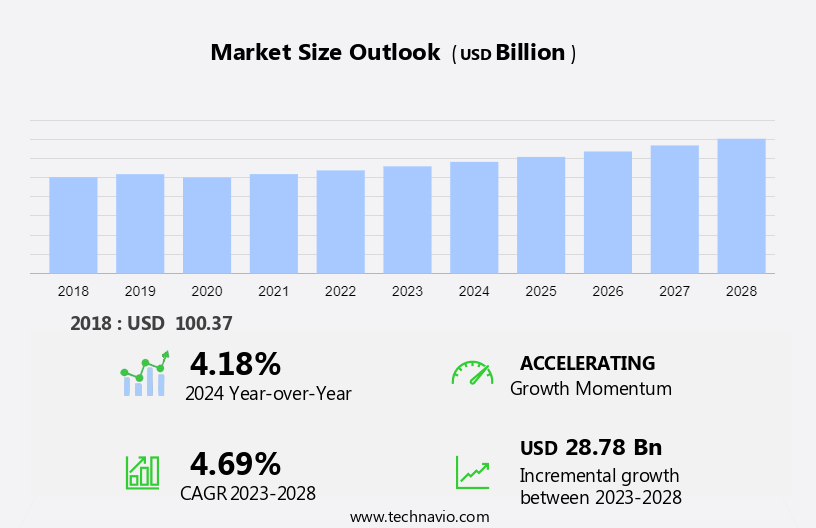
The steel wire market size is forecast to increase by USD 28.78 billion at a CAGR of 4.69% between 2023 and 2028. The market is driven by the growth of infrastructure investment in various sectors, particularly in the automotive industry, which necessitates the use of high-performance steel wires with superior shock resistance, wear resistance, and high bearing capacity. Steel wires are extensively used in wire ropes and strands for applications such as lifting, towing, and conveyance systems.

The market trends include increasing strategic alliances and partnerships among steel manufacturers to expand their product offerings and geographical reach. However, the presence of substitutes for steel wires, such as synthetic fibers and ropes, poses a significant challenge to the market growth. Additionally, the demand for rust and corrosion-resistant steel wires is increasing due to their extended durability and longevity, especially in harsh environments.

Steel Wire Market Size

 Request Free Sample

The market is witnessing significant growth due to its extensive applications in various industries, particularly in the construction sector. Steel wires are widely used in constructing infrastructure projects such as flyovers, atomic reactor domes, slabs, silos, hangers, aqueducts, and high-rise buildings. They are also essential components in the manufacturing of wire ropes and strands used in suspension bridges, prestressed concrete, metallic nets, and cables. Steel wires offer several advantages, including high shock resistance, wear resistance, and high bearing capacity. They are also known for their rust and corrosion resistance, making them suitable for long-term use in harsh environments.

Furthermore, the increasing infrastructure investment in various sectors, including agriculture, electricity consumption, and transportation, is driving the demand for steel wires. Moreover, steel wires find applications in various hardware, such as armored cables, used in power transmission and distribution networks. The growing demand for high-performance and durable materials in construction and infrastructure projects is expected to boost the market growth. The use of alloy steel in producing steel wires further enhances their strength and durability, making them an ideal choice for various applications.

Market Segmentation

The market research report provides comprehensive data (region-wise segment analysis), with forecasts and estimates in "USD billion" for the period 2024-2028, as well as historical data from 2018-2022 for the following segments.

  • End-user
    • Construction
    • Automotive
    • Industrial
    • Others
  • Type
    • Carbon steel
    • Alloy steel
    • Stainless steel
  • Geography
    • APAC
      • China
      • India
      • Japan
    • Europe
    • North America
      • US
    • Middle East and Africa
    • South America

By End-user Insights

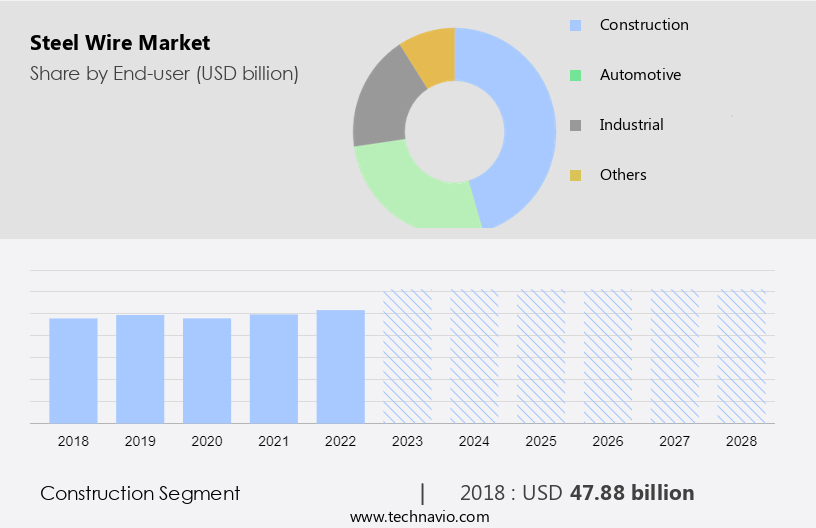
The construction segment is estimated to witness significant growth during the forecast period. Steel wires play a pivotal role in various industries, including railway sleeper construction, mining applications, mechanical manufacturing, and the automotive sector. In railway sleeper construction, steel wire ropes are utilized to lift and transport heavy sleepers, ensuring the efficient and safe transportation of rail infrastructure components. Plastic fibers are often incorporated into steel wires to enhance their durability and flexibility, resulting in improved performance. The demand for steel wires is also significant in the mining industry for various applications, such as lifting and lowering heavy mining equipment, and securing loads during transportation. Furthermore, the automotive industry relies on steel wires for tire reinforcement and suspension systems.

Moreover, the growth in urbanization and infrastructure investments has led to a increase in demand for steel wires in the construction sector. This trend is driven by the increasing number of residential and non-residential projects, as well as the focus on enhancing healthcare infrastructure. Governments worldwide are investing in new healthcare facilities, creating immense business opportunities for the construction industry and, consequently, the market.

Steel Wire Market Size

Get a glance at the market share of various segments Request Free Sample

The construction segment accounted for USD 47.88 billion in 2018 and showed a gradual increase during the forecast period.

Regional Insights

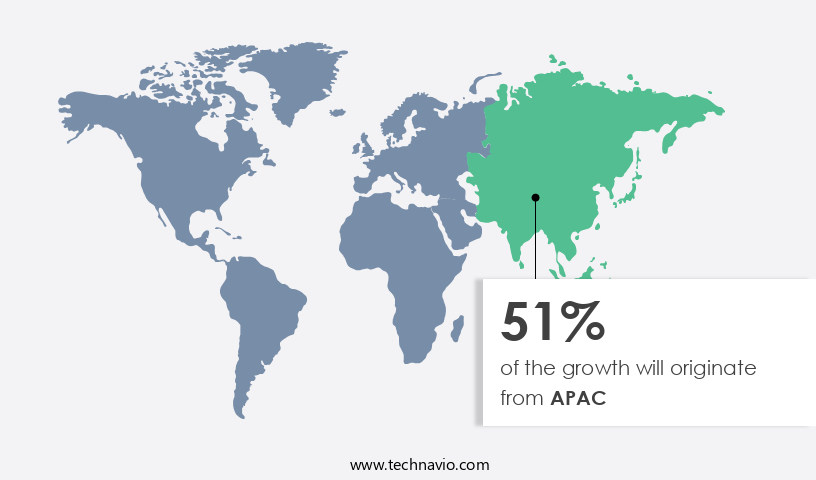
APAC is estimated to contribute 51% to the growth of the global market during the forecast period. Technavio's analysts have elaborately explained the regional trends and drivers that shape the market during the forecast period.

Steel Wire Market Share by Geography

For more insights on the market share of various regions Request Free Sample

The market is anticipated to witness significant growth during the forecast period, with the Asia Pacific region leading the charge. The expansion of industries such as automotive and construction in countries like China, Japan, and India is fueling market growth. In India, for instance, the Smart Cities Mission, which aims to develop 100 cities, has led to a increase in construction activities, resulting in increased demand for steel wires. Furthermore, steel wires are extensively used in various applications, including railway sleeper construction, mining, mechanical manufacturing, and tires. The automotive industry also contributes significantly to the market's growth due to the increasing demand for vehicles in developing economies.

Our researchers analyzed the data with 2023 as the base year, along with the key drivers, trends, and challenges. A holistic analysis of drivers will help companies refine their marketing strategies to gain a competitive advantage.

Market Driver

Growth of automotive sector is the key driver of the market. The market is poised for significant growth due to increasing demand from various industries, particularly the Construction sector. In this industry, steel wires are extensively used in constructing flyovers, atomic reactor domes, slabs, silos, hangers, aqueducts, and high-rise buildings. Moreover, the infrastructure sector's expansion, driven by the development of viaducts and other large-scale projects, will further fuel the market's growth. Developing countries, such as India and China, and developed economies, including the US, Germany, and the UK, are key contributors to the market's growth. Companies like Volkswagen, BMW, Tata Motors, Toyota Motor, Honda Motor, Fiat, and Daimler are investing heavily in setting up manufacturing plants in India and China, which will increase the demand for steel wires in the automotive sector.

Furthermore, governments worldwide are promoting the sales of electric vehicles (EVs) due to growing environmental concerns, which will also contribute to the market's growth. In countries like China, India, Germany, the Netherlands, Denmark, Sweden, and the US, the shift towards EVs is expected to boost the demand for steel wires in the production of these vehicles.

Market Trends

Increasing strategic alliances and partnerships among steel manufacturers is the upcoming trend in the market. The market plays a significant role in catering to the demands of various industries, particularly the Construction industry. Steel wires are extensively used in constructing flyovers, atomic reactor domes, slabs, silos, hangars, aqueducts, and high-rise buildings, among others. In the construction sector, steel wires are essential components in the fabrication of viaducts and reinforcing bars. Several strategic partnerships among steel manufacturers aim to increase productivity and expand manufacturing units. For instance, ArcelorMittal SA acquired an 80% shareholding in a world-class Hot Briquetted Iron (HBI) plant in Texas to ease the supply of raw materials for producing rolled steels, steel wire, and metallic-coated steels.

Furthermore, ArcelorMittal is a strategic partner to major original equipment manufacturers, primarily in the automobile and appliance industries. Similarly, Nippon Steel Corp. Acquired Essar Steel in India, jointly with ArcelorMittal SA, and the Hazira steel mill to increase productivity and manufacturing capacity from 7 million tons to over 14 million tons.

Market Challenge

Presence of substitutes for steel wire is a key challenge affecting the market growth. The market caters to various industries, including construction, where it is extensively used in constructing flyovers, atomic reactor domes, and high-rise buildings. Steel wires are also integral to the fabrication of slabs, silos, hangers, aqueducts, and viaducts. However, the market growth may face challenges from alternative products such as plastic wire, titanium alloy wire, and fiber wire.

Moreover, fiber wire, made from ultra-high molecular weight polyethylene (UHMWPE) fiber, offers superior strength, durability, and efficiency for marine, arborist, nautical, off-roading, and manufacturing industries. Its lightweight property ensures safety and easier handling compared to steel wire. Another eco-friendly alternative is PlasLOC, a heavy-duty, non-slip plastic wire, which offers a cost-effective and environmentally friendly disposal method for waste.

Exclusive Customer Landscape

The market forecasting report includes the adoption lifecycle of the market, covering from the innovator's stage to the laggard's stage. It focuses on adoption rates in different regions based on penetration. Furthermore, the report also includes key purchase criteria and drivers of price sensitivity to help companies evaluate and develop their market growth analysis strategies.

Steel Wire Market Share by Geography

 Customer Landscape

Key Companies & Market Insights

Companies are implementing various strategies, such as strategic alliances, partnerships, mergers and acquisitions, geographical expansion, and product/service launches, to enhance their presence in the market.

Acerinox SA - The company offers steel wire which is used in a wide range of sectors, including manufacturing, pharmaceuticals, food processing, and construction.

The market research and growth report includes detailed analyses of the competitive landscape of the market and information about key companies, including:

  • ArcelorMittal SA
  • Bansal
  • Gerdau SA
  • Jiangsu Baosteel Metal Product Co. Ltd.
  • Jiangsu Shagang International Trade Co. Ltd.
  • Joneja Bright Steel Pvt. Ltd.
  • KEI Industries Ltd.
  • Kobe Steel Ltd.
  • Mechel PAO
  • Nippon Steel Corp.
  • Nucor Corp.
  • PAO Severstal
  • Rajratan Global Wire Ltd.
  • SSAB AB
  • Tata Sons Pvt. Ltd.
  • thyssenkrupp AG
  • Usha Martin Ltd.
  • Voestalpine AG
  • Shree Steel Wire Ropes Ltd.

Qualitative and quantitative analysis of companies has been conducted to help clients understand the wider business environment as well as the strengths and weaknesses of key market players. Data is qualitatively analyzed to categorize companies as pure play, category-focused, industry-focused, and diversified; it is quantitatively analyzed to categorize companies as dominant, leading, strong, tentative, and weak.

Research Analyst Overview

The market is witnessing significant growth due to the increasing demand from various end-use industries. The construction industry is a major consumer of steel wires, with applications including construction & infrastructure projects such as flyovers, atomic reactor domes, slabs, silos, hangars, aqueducts, high-rise buildings, viaducts, and railway sleeper construction. In the industrial sector, steel wires find extensive usage in mechanical manufacturing, metal industries, and energy transfer infrastructure. Steel wires are also extensively used in the automotive industry for tires, cords, hoses, wire harness, and springs. The automotive demand for steel wires is driven by the increasing production of vehicles and stringent safety regulations.

Additionally, steel wires are used in mining applications for ropes and strands, and in agriculture for fencing, clips, staples, mesh, screws, nails, barbed wires, and chains. Steel wires offer several advantages such as high shock resistance, wear resistance, high bearing capacity, rust resistance, and corrosion resistance. The market is expected to grow further due to infrastructure investment, government regulation, and the increasing demand from industries such as automotive production and industrial manufacturing. The types of steel wires include carbon steel, stainless steel, and alloy steel.

Market Scope

Report Coverage

Details

Page number

174

Base year

2023

Historic period

2018-2022

Forecast period

2024-2028

Growth momentum & CAGR

Accelerate at a CAGR of 4.69%

Market growth 2024-2028

USD 28.78 billion

Market structure

Fragmented

YoY growth 2023-2024(%)

4.18

Regional analysis

APAC, Europe, North America, Middle East and Africa, and South America

Performing market contribution

APAC at 51%

Key countries

US, China, India, Japan, and Russia

Competitive landscape

Leading Companies, Market Positioning of Companies, Competitive Strategies, and Industry Risks

Key companies profiled

Acerinox SA, ArcelorMittal SA, Bansal, Gerdau SA, Jiangsu Baosteel Metal Product Co. Ltd., Jiangsu Shagang International Trade Co. Ltd., Joneja Bright Steel Pvt. Ltd., KEI Industries Ltd., Kobe Steel Ltd., Mechel PAO, Nippon Steel Corp., Nucor Corp., PAO Severstal, Rajratan Global Wire Ltd., SSAB AB, Tata Sons Pvt. Ltd., thyssenkrupp AG, Usha Martin Ltd., Voestalpine AG, and Shree Steel Wire Ropes Ltd.

Market dynamics

Parent market analysis, market growth inducers and obstacles, market forecast, fast-growing and slow-growing segment analysis, COVID-19 impact and recovery analysis and future consumer dynamics, market condition analysis for the forecast period

Customization purview

If our market report has not included the data that you are looking for, you can reach out to our analysts and get segments customized.

Request Free Sample

What are the Key Data Covered in this Market Research and Growth Report?

  • CAGR of the market during the forecast period
  • Detailed information on factors that will drive the market growth and forecasting between 2024 and 2028
  • Precise estimation of the size of the market  and its contribution of the market in focus to the parent market
  • Accurate predictions about upcoming market growth and trends and changes in consumer behaviour
  • Growth of the market across APAC, Europe, North America, Middle East and Africa, and South America
  • Thorough analysis of the market's competitive landscape and detailed information about companies
  • Comprehensive analysis of factors that will challenge the growth of market companies

We can help! Our analysts can customize this market research report to meet your requirements. Get in touch

1 Executive Summary

  • 1.1 Market overview
    • Exhibit 01: Executive Summary – Chart on Market Overview
    • Exhibit 02: Executive Summary – Data Table on Market Overview
    • Exhibit 03: Executive Summary – Chart on Global Market Characteristics
    • Exhibit 04: Executive Summary – Chart on Market by Geography
    • Exhibit 05: Executive Summary – Chart on Market Segmentation by End-user
    • Exhibit 06: Executive Summary – Chart on Market Segmentation by Type
    • Exhibit 07: Executive Summary – Chart on Incremental Growth
    • Exhibit 08: Executive Summary – Data Table on Incremental Growth
    • Exhibit 09: Executive Summary – Chart on Vendor Market Positioning

2 Market Landscape

  • 2.1 Market ecosystem
    • Exhibit 10: Parent market
    • Exhibit 11: Market Characteristics

3 Market Sizing

  • 3.1 Market definition
    • Exhibit 12: Offerings of vendors included in the market definition
  • 3.2 Market segment analysis
    • Exhibit 13: Market segments
  • 3.3 Market size 2023
    • 3.4 Market outlook: Forecast for 2023-2028
      • Exhibit 14: Chart on Global - Market size and forecast 2023-2028 ($ billion)
      • Exhibit 15: Data Table on Global - Market size and forecast 2023-2028 ($ billion)
      • Exhibit 16: Chart on Global Market: Year-over-year growth 2023-2028 (%)
      • Exhibit 17: Data Table on Global Market: Year-over-year growth 2023-2028 (%)

    4 Historic Market Size

    • 4.1 Global steel wire market 2018 - 2022
      • Exhibit 18: Historic Market Size – Data Table on global steel wire market 2018 - 2022 ($ billion)
    • 4.2 End-user Segment Analysis 2018 - 2022
      • Exhibit 19: Historic Market Size – End-user Segment 2018 - 2022 ($ billion)
    • 4.3 Type Segment Analysis 2018 - 2022
      • Exhibit 20: Historic Market Size – Type Segment 2018 - 2022 ($ billion)
    • 4.4 Geography Segment Analysis 2018 - 2022
      • Exhibit 21: Historic Market Size – Geography Segment 2018 - 2022 ($ billion)
    • 4.5 Country Segment Analysis 2018 - 2022
      • Exhibit 22: Historic Market Size – Country Segment 2018 - 2022 ($ billion)

    5 Five Forces Analysis

    • 5.1 Five forces summary
      • Exhibit 23: Five forces analysis - Comparison between 2023 and 2028
    • 5.2 Bargaining power of buyers
      • Exhibit 24: Chart on Bargaining power of buyers – Impact of key factors 2023 and 2028
    • 5.3 Bargaining power of suppliers
      • Exhibit 25: Bargaining power of suppliers – Impact of key factors in 2023 and 2028
    • 5.4 Threat of new entrants
      • Exhibit 26: Threat of new entrants – Impact of key factors in 2023 and 2028
    • 5.5 Threat of substitutes
      • Exhibit 27: Threat of substitutes – Impact of key factors in 2023 and 2028
    • 5.6 Threat of rivalry
      • Exhibit 28: Threat of rivalry – Impact of key factors in 2023 and 2028
    • 5.7 Market condition
      • Exhibit 29: Chart on Market condition - Five forces 2023 and 2028

    6 Market Segmentation by End-user

    • 6.1 Market segments
      • Exhibit 30: Chart on End-user - Market share 2023-2028 (%)
      • Exhibit 31: Data Table on End-user - Market share 2023-2028 (%)
    • 6.2 Comparison by End-user
      • Exhibit 32: Chart on Comparison by End-user
      • Exhibit 33: Data Table on Comparison by End-user
    • 6.3 Construction - Market size and forecast 2023-2028
      • Exhibit 34: Chart on Construction - Market size and forecast 2023-2028 ($ billion)
      • Exhibit 35: Data Table on Construction - Market size and forecast 2023-2028 ($ billion)
      • Exhibit 36: Chart on Construction - Year-over-year growth 2023-2028 (%)
      • Exhibit 37: Data Table on Construction - Year-over-year growth 2023-2028 (%)
    • 6.4 Automotive - Market size and forecast 2023-2028
      • Exhibit 38: Chart on Automotive - Market size and forecast 2023-2028 ($ billion)
      • Exhibit 39: Data Table on Automotive - Market size and forecast 2023-2028 ($ billion)
      • Exhibit 40: Chart on Automotive - Year-over-year growth 2023-2028 (%)
      • Exhibit 41: Data Table on Automotive - Year-over-year growth 2023-2028 (%)
    • 6.5 Industrial - Market size and forecast 2023-2028
      • Exhibit 42: Chart on Industrial - Market size and forecast 2023-2028 ($ billion)
      • Exhibit 43: Data Table on Industrial - Market size and forecast 2023-2028 ($ billion)
      • Exhibit 44: Chart on Industrial - Year-over-year growth 2023-2028 (%)
      • Exhibit 45: Data Table on Industrial - Year-over-year growth 2023-2028 (%)
    • 6.6 Others - Market size and forecast 2023-2028
      • Exhibit 46: Chart on Others - Market size and forecast 2023-2028 ($ billion)
      • Exhibit 47: Data Table on Others - Market size and forecast 2023-2028 ($ billion)
      • Exhibit 48: Chart on Others - Year-over-year growth 2023-2028 (%)
      • Exhibit 49: Data Table on Others - Year-over-year growth 2023-2028 (%)
    • 6.7 Market opportunity by End-user
      • Exhibit 50: Market opportunity by End-user ($ billion)
      • Exhibit 51: Data Table on Market opportunity by End-user ($ billion)

    7 Market Segmentation by Type

    • 7.1 Market segments
      • Exhibit 52: Chart on Type - Market share 2023-2028 (%)
      • Exhibit 53: Data Table on Type - Market share 2023-2028 (%)
    • 7.2 Comparison by Type
      • Exhibit 54: Chart on Comparison by Type
      • Exhibit 55: Data Table on Comparison by Type
    • 7.3 Carbon steel - Market size and forecast 2023-2028
      • Exhibit 56: Chart on Carbon steel - Market size and forecast 2023-2028 ($ billion)
      • Exhibit 57: Data Table on Carbon steel - Market size and forecast 2023-2028 ($ billion)
      • Exhibit 58: Chart on Carbon steel - Year-over-year growth 2023-2028 (%)
      • Exhibit 59: Data Table on Carbon steel - Year-over-year growth 2023-2028 (%)
    • 7.4 Alloy steel - Market size and forecast 2023-2028
      • Exhibit 60: Chart on Alloy steel - Market size and forecast 2023-2028 ($ billion)
      • Exhibit 61: Data Table on Alloy steel - Market size and forecast 2023-2028 ($ billion)
      • Exhibit 62: Chart on Alloy steel - Year-over-year growth 2023-2028 (%)
      • Exhibit 63: Data Table on Alloy steel - Year-over-year growth 2023-2028 (%)
    • 7.5 Stainless steel - Market size and forecast 2023-2028
      • Exhibit 64: Chart on Stainless steel - Market size and forecast 2023-2028 ($ billion)
      • Exhibit 65: Data Table on Stainless steel - Market size and forecast 2023-2028 ($ billion)
      • Exhibit 66: Chart on Stainless steel - Year-over-year growth 2023-2028 (%)
      • Exhibit 67: Data Table on Stainless steel - Year-over-year growth 2023-2028 (%)
    • 7.6 Market opportunity by Type
      • Exhibit 68: Market opportunity by Type ($ billion)
      • Exhibit 69: Data Table on Market opportunity by Type ($ billion)

    8 Customer Landscape

    • 8.1 Customer landscape overview
      • Exhibit 70: Analysis of price sensitivity, lifecycle, customer purchase basket, adoption rates, and purchase criteria

    9 Geographic Landscape

    • 9.1 Geographic segmentation
      • Exhibit 71: Chart on Market share by geography 2023-2028 (%)
      • Exhibit 72: Data Table on Market share by geography 2023-2028 (%)
    • 9.2 Geographic comparison
      • Exhibit 73: Chart on Geographic comparison
      • Exhibit 74: Data Table on Geographic comparison
    • 9.3 APAC - Market size and forecast 2023-2028
      • Exhibit 75: Chart on APAC - Market size and forecast 2023-2028 ($ billion)
      • Exhibit 76: Data Table on APAC - Market size and forecast 2023-2028 ($ billion)
      • Exhibit 77: Chart on APAC - Year-over-year growth 2023-2028 (%)
      • Exhibit 78: Data Table on APAC - Year-over-year growth 2023-2028 (%)
    • 9.4 Europe - Market size and forecast 2023-2028
      • Exhibit 79: Chart on Europe - Market size and forecast 2023-2028 ($ billion)
      • Exhibit 80: Data Table on Europe - Market size and forecast 2023-2028 ($ billion)
      • Exhibit 81: Chart on Europe - Year-over-year growth 2023-2028 (%)
      • Exhibit 82: Data Table on Europe - Year-over-year growth 2023-2028 (%)
    • 9.5 North America - Market size and forecast 2023-2028
      • Exhibit 83: Chart on North America - Market size and forecast 2023-2028 ($ billion)
      • Exhibit 84: Data Table on North America - Market size and forecast 2023-2028 ($ billion)
      • Exhibit 85: Chart on North America - Year-over-year growth 2023-2028 (%)
      • Exhibit 86: Data Table on North America - Year-over-year growth 2023-2028 (%)
    • 9.6 Middle East and Africa - Market size and forecast 2023-2028
      • Exhibit 87: Chart on Middle East and Africa - Market size and forecast 2023-2028 ($ billion)
      • Exhibit 88: Data Table on Middle East and Africa - Market size and forecast 2023-2028 ($ billion)
      • Exhibit 89: Chart on Middle East and Africa - Year-over-year growth 2023-2028 (%)
      • Exhibit 90: Data Table on Middle East and Africa - Year-over-year growth 2023-2028 (%)
    • 9.7 South America - Market size and forecast 2023-2028
      • Exhibit 91: Chart on South America - Market size and forecast 2023-2028 ($ billion)
      • Exhibit 92: Data Table on South America - Market size and forecast 2023-2028 ($ billion)
      • Exhibit 93: Chart on South America - Year-over-year growth 2023-2028 (%)
      • Exhibit 94: Data Table on South America - Year-over-year growth 2023-2028 (%)
    • 9.8 China - Market size and forecast 2023-2028
      • Exhibit 95: Chart on China - Market size and forecast 2023-2028 ($ billion)
      • Exhibit 96: Data Table on China - Market size and forecast 2023-2028 ($ billion)
      • Exhibit 97: Chart on China - Year-over-year growth 2023-2028 (%)
      • Exhibit 98: Data Table on China - Year-over-year growth 2023-2028 (%)
    • 9.9 India - Market size and forecast 2023-2028
      • Exhibit 99: Chart on India - Market size and forecast 2023-2028 ($ billion)
      • Exhibit 100: Data Table on India - Market size and forecast 2023-2028 ($ billion)
      • Exhibit 101: Chart on India - Year-over-year growth 2023-2028 (%)
      • Exhibit 102: Data Table on India - Year-over-year growth 2023-2028 (%)
    • 9.10 Japan - Market size and forecast 2023-2028
      • Exhibit 103: Chart on Japan - Market size and forecast 2023-2028 ($ billion)
      • Exhibit 104: Data Table on Japan - Market size and forecast 2023-2028 ($ billion)
      • Exhibit 105: Chart on Japan - Year-over-year growth 2023-2028 (%)
      • Exhibit 106: Data Table on Japan - Year-over-year growth 2023-2028 (%)
    • 9.11 US - Market size and forecast 2023-2028
      • Exhibit 107: Chart on US - Market size and forecast 2023-2028 ($ billion)
      • Exhibit 108: Data Table on US - Market size and forecast 2023-2028 ($ billion)
      • Exhibit 109: Chart on US - Year-over-year growth 2023-2028 (%)
      • Exhibit 110: Data Table on US - Year-over-year growth 2023-2028 (%)
    • 9.12 Russia - Market size and forecast 2023-2028
      • Exhibit 111: Chart on Russia - Market size and forecast 2023-2028 ($ billion)
      • Exhibit 112: Data Table on Russia - Market size and forecast 2023-2028 ($ billion)
      • Exhibit 113: Chart on Russia - Year-over-year growth 2023-2028 (%)
      • Exhibit 114: Data Table on Russia - Year-over-year growth 2023-2028 (%)
    • 9.13 Market opportunity by geography
      • Exhibit 115: Market opportunity by geography ($ billion)
      • Exhibit 116: Data Tables on Market opportunity by geography ($ billion)

    10 Drivers, Challenges, and Trends

    • 10.1 Market drivers
      • 10.2 Market challenges
        • 10.3 Impact of drivers and challenges
          • Exhibit 117: Impact of drivers and challenges in 2023 and 2028
        • 10.4 Market trends

          11 Vendor Landscape

          • 11.1 Overview
            • 11.2 Vendor landscape
              • Exhibit 118: Overview on Criticality of inputs and Factors of differentiation
            • 11.3 Landscape disruption
              • Exhibit 119: Overview on factors of disruption
            • 11.4 Industry risks
              • Exhibit 120: Impact of key risks on business

            12 Vendor Analysis

            • 12.1 Vendors covered
              • Exhibit 121: Vendors covered
            • 12.2 Market positioning of vendors
              • Exhibit 122: Matrix on vendor position and classification
            • 12.3 Acerinox SA
              • Exhibit 123: Acerinox SA - Overview
              • Exhibit 124: Acerinox SA - Business segments
              • Exhibit 125: Acerinox SA - Key offerings
              • Exhibit 126: Acerinox SA - Segment focus
            • 12.4 ArcelorMittal SA
              • Exhibit 127: ArcelorMittal SA - Overview
              • Exhibit 128: ArcelorMittal SA - Business segments
              • Exhibit 129: ArcelorMittal SA - Key offerings
              • Exhibit 130: ArcelorMittal SA - Segment focus
            • 12.5 Gerdau SA
              • Exhibit 131: Gerdau SA - Overview
              • Exhibit 132: Gerdau SA - Business segments
              • Exhibit 133: Gerdau SA - Key offerings
              • Exhibit 134: Gerdau SA - Segment focus
            • 12.6 Jiangsu Shagang International Trade Co. Ltd.
              • Exhibit 135: Jiangsu Shagang International Trade Co. Ltd. - Overview
              • Exhibit 136: Jiangsu Shagang International Trade Co. Ltd. - Product / Service
              • Exhibit 137: Jiangsu Shagang International Trade Co. Ltd. - Key offerings
            • 12.7 KEI Industries Ltd.
              • Exhibit 138: KEI Industries Ltd. - Overview
              • Exhibit 139: KEI Industries Ltd. - Business segments
              • Exhibit 140: KEI Industries Ltd. - Key offerings
              • Exhibit 141: KEI Industries Ltd. - Segment focus
            • 12.8 Mechel PAO
              • Exhibit 142: Mechel PAO - Overview
              • Exhibit 143: Mechel PAO - Business segments
              • Exhibit 144: Mechel PAO - Key offerings
              • Exhibit 145: Mechel PAO - Segment focus
            • 12.9 Nippon Steel Corp.
              • Exhibit 146: Nippon Steel Corp. - Overview
              • Exhibit 147: Nippon Steel Corp. - Business segments
              • Exhibit 148: Nippon Steel Corp. - Key offerings
              • Exhibit 149: Nippon Steel Corp. - Segment focus
            • 12.10 Nucor Corp.
              • Exhibit 150: Nucor Corp. - Overview
              • Exhibit 151: Nucor Corp. - Business segments
              • Exhibit 152: Nucor Corp. - Key news
              • Exhibit 153: Nucor Corp. - Key offerings
              • Exhibit 154: Nucor Corp. - Segment focus
            • 12.11 PAO Severstal
              • Exhibit 155: PAO Severstal - Overview
              • Exhibit 156: PAO Severstal - Product / Service
              • Exhibit 157: PAO Severstal - Key offerings
            • 12.12 Rajratan Global Wire Ltd.
              • Exhibit 158: Rajratan Global Wire Ltd. - Overview
              • Exhibit 159: Rajratan Global Wire Ltd. - Product / Service
              • Exhibit 160: Rajratan Global Wire Ltd. - Key offerings
            • 12.13 SSAB AB
              • Exhibit 161: SSAB AB - Overview
              • Exhibit 162: SSAB AB - Business segments
              • Exhibit 163: SSAB AB - Key offerings
              • Exhibit 164: SSAB AB - Segment focus
            • 12.14 Tata Sons Pvt. Ltd.
              • Exhibit 165: Tata Sons Pvt. Ltd. - Overview
              • Exhibit 166: Tata Sons Pvt. Ltd. - Business segments
              • Exhibit 167: Tata Sons Pvt. Ltd. - Key offerings
              • Exhibit 168: Tata Sons Pvt. Ltd. - Segment focus
            • 12.15 thyssenkrupp AG
              • Exhibit 169: thyssenkrupp AG - Overview
              • Exhibit 170: thyssenkrupp AG - Business segments
              • Exhibit 171: thyssenkrupp AG - Key offerings
              • Exhibit 172: thyssenkrupp AG - Segment focus
            • 12.16 Usha Martin Ltd.
              • Exhibit 173: Usha Martin Ltd. - Overview
              • Exhibit 174: Usha Martin Ltd. - Product / Service
              • Exhibit 175: Usha Martin Ltd. - Key offerings
            • 12.17 Voestalpine AG
              • Exhibit 176: Voestalpine AG - Overview
              • Exhibit 177: Voestalpine AG - Business segments
              • Exhibit 178: Voestalpine AG - Key offerings
              • Exhibit 179: Voestalpine AG - Segment focus

            13 Appendix

            • 13.1 Scope of the report
              • 13.2 Inclusions and exclusions checklist
                • Exhibit 180: Inclusions checklist
                • Exhibit 181: Exclusions checklist
              • 13.3 Currency conversion rates for US$
                • Exhibit 182: Currency conversion rates for US$
              • 13.4 Research methodology
                • Exhibit 183: Research methodology
                • Exhibit 184: Validation techniques employed for market sizing
                • Exhibit 185: Information sources
              • 13.5 List of abbreviations
                • Exhibit 186: List of abbreviations

              Research Methodology

              Technavio presents a detailed picture of the market by way of study, synthesis, and summation of data from multiple sources. The analysts have presented the various facets of the market with a particular focus on identifying the key industry influencers. The data thus presented is comprehensive, reliable, and the result of extensive research, both primary and secondary.

              INFORMATION SOURCES

              Primary sources

              • Manufacturers and suppliers
              • Channel partners
              • Industry experts
              • Strategic decision makers

              Secondary sources

              • Industry journals and periodicals
              • Government data
              • Financial reports of key industry players
              • Historical data
              • Press releases

              DATA ANALYSIS

              Data Synthesis

              • Collation of data
              • Estimation of key figures
              • Analysis of derived insights

              Data Validation

              • Triangulation with data models
              • Reference against proprietary databases
              • Corroboration with industry experts

              REPORT WRITING

              Qualitative

              • Market drivers
              • Market challenges
              • Market trends
              • Five forces analysis

              Quantitative

              • Market size and forecast
              • Market segmentation
              • Geographical insights
              • Competitive landscape

              Interested in this report?

              Get your sample now to see our research methodology and insights!

              Download Now

              Frequently Asked Questions

              Steel Wire market growth will increase by $ 28.78 bn during 2024-2028 .

              The Steel Wire market is expected to grow at a CAGR of 4.69% during 2024-2028 .

              Steel Wire market is segmented by End-user( Construction, Automotive, Industrial, Others) Type( Carbon steel, Alloy steel, Stainless steel, Middle East and Africa, South America)

              Acerinox SA, ArcelorMittal SA, Bansal, Gerdau SA, Jiangsu Baosteel Metal Product Co. Ltd., Jiangsu Shagang International Trade Co. Ltd., Joneja Bright Steel Pvt. Ltd., KEI Industries Ltd., Kobe Steel Ltd., Mechel PAO, Nippon Steel Corp., Nucor Corp., PAO Severstal, Rajratan Global Wire Ltd., SSAB AB, Tata Sons Pvt. Ltd., thyssenkrupp AG, Usha Martin Ltd., Voestalpine AG, Shree Steel Wire Ropes Ltd. are a few of the key vendors in the Steel Wire market.

              APAC will register the highest growth rate of 51% among the other regions. Therefore, the Steel Wire market in APAC is expected to garner significant business opportunities for the vendors during the forecast period.

              US, China, India, Japan, Russia

              • Growth of automotive sectorGrowth from developing countries is the driving factor this market.
              • such as India and China is the driving factor this market.
              • as well as that from developed economies is the driving factor this market.
              • such as the US is the driving factor this market.
              • Germany is the driving factor this market.
              • and the UK is the driving factor this market.
              • will drive the adoption of steel wires during the forecast period. Companies such as Volkswagen is the driving factor this market.
              • BMW (Bayerische Motoren Werke) is the driving factor this market.
              • Tata Motors is the driving factor this market.
              • Toyota Motor is the driving factor this market.
              • Honda Motor is the driving factor this market.
              • Fiat is the driving factor this market.
              • and Daimler are making heavy capital investments to set up their manufacturing plants in India and China. Such factors will boost the growth of the automotive sector in APAC during the forecast period. The governments of different countries is the driving factor this market.
              • such as China is the driving factor this market.
              • India is the driving factor this market.
              • Germany is the driving factor this market.
              • the Netherlands is the driving factor this market.
              • Denmark is the driving factor this market.
              • Sweden is the driving factor this market.
              • and the US is the driving factor this market.
              • are promoting the sales of electric vehicles (EVs) owing to increasing environmental concerns related to the use of fossil fuel vehicles. These countries are offering tax exemptions is the driving factor this market.
              • free charging facilities is the driving factor this market.
              • free parking is the driving factor this market.
              • and other benefits to users to increase the adoption of electric vehicles. This rise in the production of electric vehicles drives automotive production is the driving factor this market.
              • which requires steel wires for manufacturing operations. The automotive industry is the major end-user of large volumes of steel wires for manufacturing operations. Hence is the driving factor this market.
              • the growth of the automotive industry is the driving factor this market.
              • majorly driven by the growth of electric vehicles is the driving factor this market.
              • will drive the growth of the global steel wire market during the forecast period. Also is the driving factor this market.
              • the increasing production of passenger aircraft and aerospace and defense equipment will drive the growth of the global steel wire market during the forecast period. is the driving factor this market.

              The Steel Wire market vendors should focus on grabbing business opportunities from the Construction segment as it accounted for the largest market share in the base year.