Subsea Sensors Market Analysis, Size, and Forecast 2025-2029: North America (US and Canada), Europe (France, Germany, Italy, and UK), Middle East and Africa (Egypt, KSA, Oman, and UAE), APAC (China, India, and Japan), South America (Argentina and Brazil), and Rest of World (ROW)

Subsea Sensors Market Analysis, Size, and Forecast 2025-2029:
North America (US and Canada), Europe (France, Germany, Italy, and UK), Middle East and Africa (Egypt, KSA, Oman, and UAE), APAC (China, India, and Japan), South America (Argentina and Brazil), and Rest of World (ROW)

Published: May 2025 233 Pages SKU: IRTNTR77809

Market Overview at a Glance

$355.1 Mn
Market Opportunity
7.1%
CAGR
6.5
YoY growth 2024-2025(%)

Subsea Sensors Market Size 2025-2029

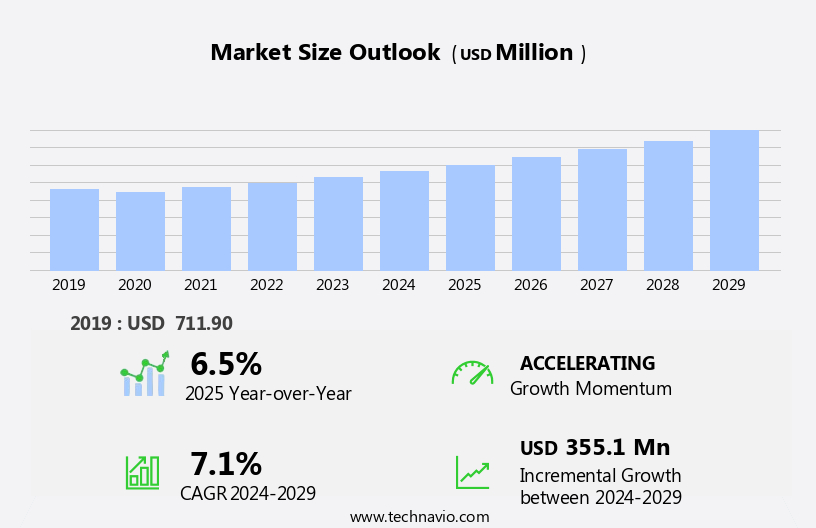
The subsea sensors market size is forecast to increase by USD 355.1 million, at a CAGR of 7.1% between 2024 and 2029.

  • The market is driven by the expansion of the offshore oil and gas industry, which necessitates the deployment of advanced subsea sensing technologies for exploration and production activities. These sensors enable real-time monitoring of critical parameters such as pressure, temperature, and flow rate, ensuring optimal operational efficiency and safety. Researchers and scientists also utilize subsea sensors for oceanographic studies, while sensors manufacturers continue to innovate with technology advancements such as artificial intelligence and the Internet of Things. However, the market faces a significant challenge in the form of the limited battery life of subsea sensors. Given the harsh subsea environment and the inaccessibility of these sensors, replacing batteries or repairing them can be time-consuming and costly. As a result, there is a growing demand for sensors with longer battery life and improved durability.
  • Companies investing in research and development to address this challenge and create more robust, long-lasting subsea sensors will gain a competitive edge in the market. Additionally, collaborations and partnerships between technology providers and oil and gas companies can lead to innovative solutions and mutual benefits.

What will be the Size of the Subsea Sensors Market during the forecast period?

Subsea Sensors Market Size

Explore in-depth regional segment analysis with market size data - historical 2019-2023 and forecasts 2025-2029 - in the full report.  
Request Free Sample

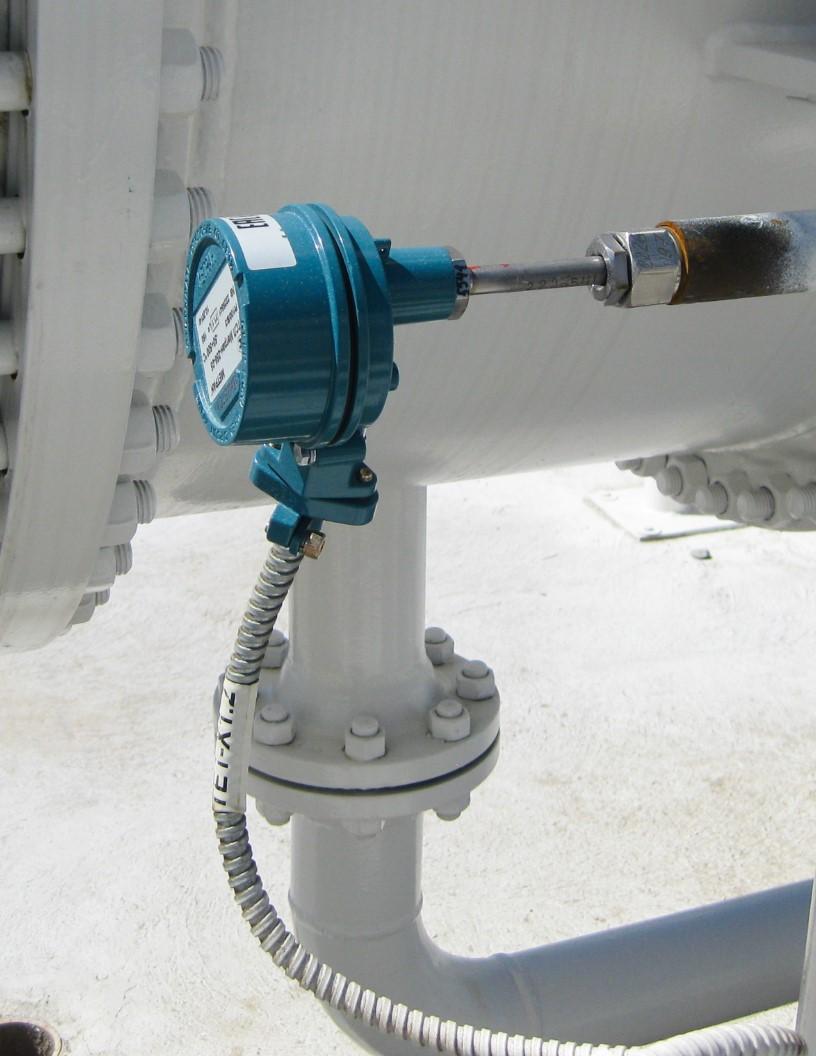
The market is characterized by its continuous evolution and dynamic nature, driven by advancements in technology and the expanding applications across various sectors. These sensors play a crucial role in depth and environmental monitoring, enabling real-time data acquisition and analysis for industries such as oil and gas, renewable energy, and marine research. The ongoing unfolding of market activities reveals a focus on enhancing sensor capabilities to meet the demands of harsh subsea conditions. This includes the development of sensors with high-pressure tolerances, corrosion resistance, and temperature and salinity compensation. Moreover, there is a growing emphasis on power management and data transmission solutions, enabling efficient power consumption and underwater communication for remote sensing and intervention.

The integration of machine learning and artificial intelligence (AI) in data analytics and signal processing is also transforming the market, enabling predictive maintenance procedures and structural health monitoring. Sensor deployment strategies continue to evolve, with a shift towards wireless communication and edge computing to minimize the need for manual intervention and reduce costs. The integration of multiple sensor types, including acoustic, optical, and pressure sensors, is also gaining popularity through sensor fusion and calibration techniques. Regulatory compliance and environmental impact remain key considerations, with a focus on minimizing the carbon footprint of subsea operations and ensuring sustainable practices.

The market is further expected to be influenced by emerging trends such as cloud computing, subsea robotics, and advanced data visualization tools. In conclusion, the market is a vibrant and evolving space, with ongoing innovation and development driving advancements in technology and applications across various industries. The market's continuous dynamism is reflected in the integration of various sensor technologies, deployment strategies, and data processing techniques to meet the demands of subsea operations in a sustainable and efficient manner.

How is this Subsea Sensors Industry segmented?

The subsea sensors industry research report provides comprehensive data (region-wise segment analysis), with forecasts and estimates in "USD million" for the period 2025-2029, as well as historical data from 2019-2023 for the following segments.

  • Application
    • Commercial exploration
    • Defense and military
    • Oceanic research
  • Type
    • Pressure
    • Temperature
    • Acoustic
    • Image or optical
    • Others
  • End-user
    • Oilfield service companies
    • Defense contractors
    • Research institutions
    • Renewable energy firms
  • Depth
    • Shallow Water
    • Deepwater
    • Ultra-Deepwater
  • Geography
    • North America
      • US
      • Canada
    • Europe
      • France
      • Germany
      • Italy
      • UK
    • Middle East and Africa
      • Egypt
      • KSA
      • Oman
      • UAE
    • APAC
      • China
      • India
      • Japan
    • South America
      • Argentina
      • Brazil
    • Rest of World (ROW)

    By Application Insights

    The commercial exploration segment is estimated to witness significant growth during the forecast period.

    Subsea sensors play a pivotal role in various commercial exploration activities, particularly in the oil and gas industry, as traditional onshore reserves deplete and focus shifts to deeper offshore waters. These sensors are indispensable for monitoring conditions, managing production processes, and maintaining infrastructure integrity in challenging underwater environments. Strict safety and environmental regulations, especially in offshore operations, necessitate the use of advanced subsea sensors. Technological advancements, such as deep learning, artificial intelligence, and edge computing, are driving the exploration of extreme underwater environments, including deep-sea trenches, hydrothermal vents, and seamounts. Subsea sensors enable researchers to collect critical data on temperature, pressure, salinity, and other environmental parameters in these environments.

    Additionally, sensors are integral to pipeline monitoring, leak detection, cable monitoring, subsea intervention, maintenance procedures, and sensor maintenance. High-pressure tolerances, data transmission, and wireless communication are essential features for these sensors. Machine learning and signal processing enhance data analytics, while cloud computing facilitates data storage and access. Corrosion monitoring, structural health monitoring, and sensor calibration ensure the longevity and accuracy of these sensors. Offshore wind energy, sonar systems, positioning systems, and sensor fusion further expand the application scope of subsea sensors. Material science, temperature compensation, and salinity compensation contribute to enhancing sensor performance. Deployment strategies, data logging, sensor integration, and operating temperature are crucial considerations for sensor selection and implementation.

    Subsea inspection and sensor networks are essential for maintaining the integrity of underwater infrastructure.

    Subsea Sensors Market Size

    Request Free Sample

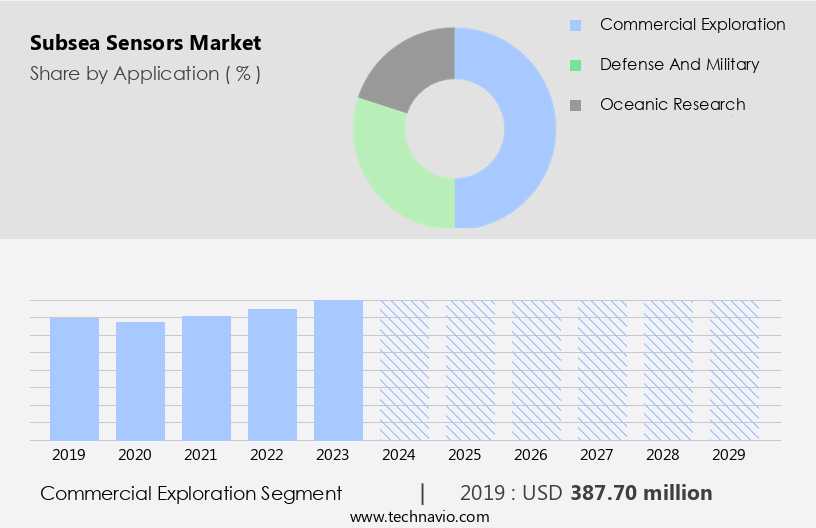
    The Commercial exploration segment was valued at USD 387.70 million in 2019 and showed a gradual increase during the forecast period.

    Regional Analysis

    North America is estimated to contribute 31% to the growth of the global market during the forecast period.Technavio's analysts have elaborately explained the regional trends and drivers that shape the market during the forecast period.

    Subsea Sensors Market Share by Geography

     Request Free Sample

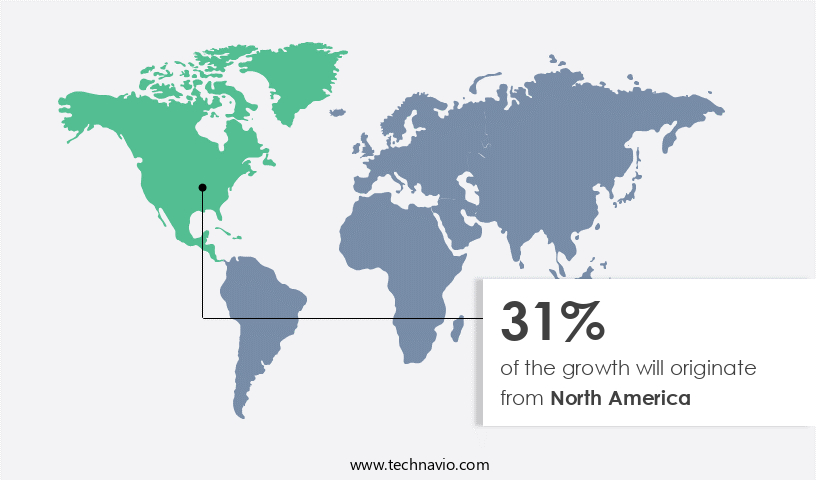
    In the expanding offshore energy sector of North America, subsea sensors play a pivotal role, particularly in the Gulf of Mexico and off the Canadian coast, where significant oil and gas reserves lie. As exploration and production activities delve deeper into the ocean, there is a growing demand for these sensors to monitor well conditions, pipeline integrity, and environmental factors. The emergence of offshore wind energy along the US East Coast and in certain Canadian regions further boosts this need. Subsea sensors are indispensable for assessing environmental conditions, such as water currents and seabed stability, ensuring the successful installation and operation of offshore wind turbines.

    The integration of advanced technologies like big data, artificial intelligence (AI), deep learning, and machine learning into subsea sensors enhances their capabilities. Real-time monitoring, power management, and data acquisition systems facilitate efficient and effective data processing. High-pressure tolerances, corrosion resistance, and temperature and salinity compensation ensure the sensors' durability and accuracy. Edge computing and wireless communication enable data transmission and analysis in real-time. Subsea intervention, maintenance procedures, and sensor maintenance are crucial aspects of subsea sensor applications. Structural health monitoring, signal processing, and sensor fusion provide valuable insights into pipeline conditions and potential issues. Regulatory compliance, leak detection, and corrosion monitoring are essential for ensuring safety and minimizing environmental impact.

    Subsea robotics, acoustic sensors, and remote sensing contribute to the development of advanced subsea sensor networks. Cloud computing and data visualization tools facilitate data analysis and interpretation. Operating depth, environmental monitoring, and sensor life are critical factors in the selection and deployment of subsea sensors. Deployment strategies, data logging, sensor integration, and operating temperature are essential considerations for optimizing sensor performance and longevity. Subsea inspection and sensor deployment are crucial for maintaining the integrity of offshore energy infrastructure. The integration of advanced technologies and the growing demand for subsea sensors underscore the market's dynamic and evolving nature.

    Market Dynamics

    The global subsea sensors market is experiencing significant expansion, primarily driven by the demands of offshore oil & gas (subsea sensors), particularly for subsea production monitoring and crucial pipeline integrity monitoring. The expanding subsea sensors market size and dynamic subsea sensors market trends underscore the critical role of advanced subsea sensor technology. Real-time data acquisition is facilitated by real-time subsea monitoring capabilities and advancements in wireless subsea communication. Beyond oil & gas, the market sees growing applications in oceanography & marine research and the burgeoning offshore wind energy sector. Key product categories include subsea pressure sensors, subsea temperature sensors, subsea flow sensors, and subsea acoustic sensors. The integration of remote operated vehicles (ROVs) sensors and autonomous underwater vehicles (AUVs) sensors is revolutionizing data collection. Furthermore, the rise of IoT in subsea and the application of AI for subsea data analytics are transforming environmental monitoring (subsea) and operational efficiency.

    Our researchers analyzed the data with 2024 as the base year, along with the key drivers, trends, and challenges. A holistic analysis of drivers will help companies refine their marketing strategies to gain a competitive advantage.

    What are the key market drivers leading to the rise in the adoption of Subsea Sensors Industry?

    • The expansion of the offshore oil and gas industry serves as the primary catalyst for market growth. 
    • The global offshore oil and gas industry is expanding its exploration and production activities in deeper waters and remote locations to meet escalating energy demands. Subsea sensors play a crucial role in monitoring the condition of underwater infrastructure, ensuring safety and efficiency. With traditional onshore reserves depleting, the focus on subsea resources is increasing. Subsea sensors provide real-time data on the health of pipelines, wellheads, and other critical equipment, enabling operators to proactively address potential issues. These sensors employ advanced technologies such as data analytics, high-pressure tolerances, wireless communication, and signal processing for effective data transmission and edge computing.
    • Structural health monitoring, data visualization, and subsea robotics are other essential applications of subsea sensors. Ensuring the reliability and maintenance of these sensors is vital for the success of subsea intervention and maintenance procedures.

    What are the market trends shaping the Subsea Sensors Industry?

    • Subsea sensor technology is currently experiencing significant advancements, making it a prominent market trend in the industry. This technological progression offers enhanced capabilities for underwater exploration and resource extraction.
    • Subsea sensors have witnessed significant advancements due to technological innovations, enabling the development of compact and high-performing sensors for harsh underwater environments. Fiber optics, acoustic sensors, and advanced raw materials are some of the sensing technologies driving the enhancement of subsea sensors' capabilities. These sensors can measure various parameters, including temperature, pressure, salinity, dissolved oxygen, and hydrocarbons, with increased accuracy and precision. Wireless communication technologies, such as underwater acoustic modems, satellite communication, and autonomous underwater vehicles (AUVs), facilitate real-time remote monitoring of subsea sensors. Regulatory compliance and corrosion monitoring are essential applications for subsea sensors, particularly in the offshore wind energy sector.
    • Sensor fusion and calibration, along with cloud computing and machine learning, contribute to improving data processing and analysis. Corrosion resistance is a critical factor in ensuring the longevity and reliability of subsea sensors. Sonar systems and positioning systems further enhance the functionality of subsea sensors, providing valuable data for underwater exploration and resource management.

    What challenges does the Subsea Sensors Industry face during its growth?

    • The limited battery life of subsea sensors poses a significant challenge to the growth of the industry, as it necessitates frequent maintenance or replacement, increasing operational costs. 
    • Subsea sensors play a crucial role in environmental monitoring and subsea inspection, particularly in assessing the impact of human activities on marine ecosystems. However, the extreme operating conditions in underwater environments, including high pressure, low temperature, and the corrosive nature of seawater, pose significant challenges to the longevity and efficiency of these sensors. One of the primary challenges is the limited battery life of subsea sensors, which can result in shorter operational lifespans and the need for frequent battery replacements or recharging. This issue can lead to increased maintenance costs, downtime, and disruptions to monitoring activities.
    • Material science advancements, such as temperature and salinity compensation, and deployment strategies, including data logging and sensor integration, can help extend battery life and improve overall sensor performance. Maintaining sufficient battery life for long-term deployments of subsea sensors, especially in remote or deepwater environments, can be challenging. Alternative power sources, such as renewable energy or hydrothermal vents, are being explored to address this challenge. Effective sensor design and deployment strategies, including proper material selection and temperature compensation, are essential to ensure the reliability and accuracy of subsea sensor data.

    Exclusive Customer Landscape

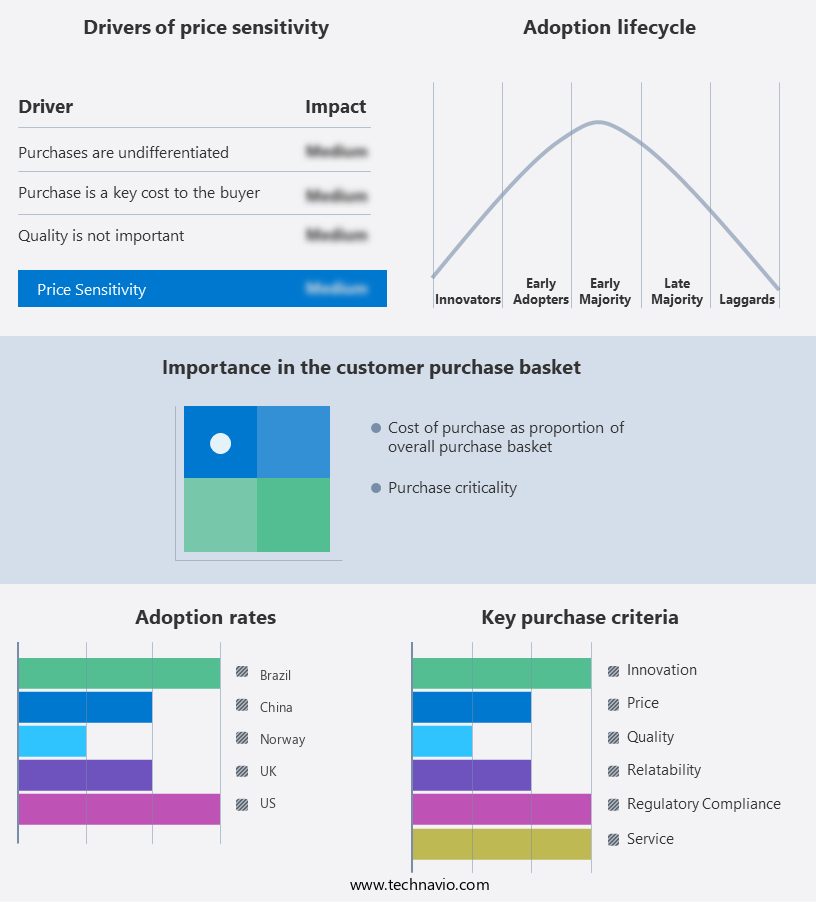
    The subsea sensors market forecasting report includes the adoption lifecycle of the market, covering from the innovator's stage to the laggard's stage. It focuses on adoption rates in different regions based on penetration. Furthermore, the subsea sensors market report also includes key purchase criteria and drivers of price sensitivity to help companies evaluate and develop their market growth analysis strategies.

    Subsea Sensors Market Share by Geography

     Customer Landscape

    Key Companies & Market Insights

    Companies are implementing various strategies, such as strategic alliances, subsea sensors market forecast, partnerships, mergers and acquisitions, geographical expansion, and product/service launches, to enhance their presence in the industry.

    AIS - CRP Subsea Ltd., a subsidiary of the company, specializes in providing advanced subsea sensors and monitoring systems for offshore infrastructure, including risers, umbilicals, pipelines, and cables. These innovative solutions enhance safety, efficiency, and reliability in the offshore energy sector.

    The industry research and growth report includes detailed analyses of the competitive landscape of the market and information about key companies, including:

    • AIS
    • Amphenol Corp.
    • Baker Hughes Co.
    • Blueprint Subsea
    • ClampOn AS
    • Covelya Group Ltd.
    • Emerson Electric Co.
    • GP 50 NY LTD.
    • Hydrotechnik Test Engineering Ltd.
    • Impact Subsea Ltd.
    • James Fisher and Sons Plc
    • NATEC Sensors GmbH
    • Norwegian Subsea AS
    • Seatools
    • Sensor Technik Sirnach AG
    • Siemens Energy AG
    • SUCO Robert Scheuffele GmbH and Co. KG
    • TE Connectivity Ltd.
    • Teledyne Technologies Inc.
    • TTL Subsea Inc.

    Qualitative and quantitative analysis of companies has been conducted to help clients understand the wider business environment as well as the strengths and weaknesses of key industry players. Data is qualitatively analyzed to categorize companies as pure play, category-focused, industry-focused, and diversified; it is quantitatively analyzed to categorize companies as dominant, leading, strong, tentative, and weak.

    Recent Development and News in Subsea Sensors Market

    • In January 2024, Schneider Electric, a leading energy management and automation company, announced the launch of its new subsea pressure sensor, the TeSys Sense 3300, designed for deep-sea applications. This sensor is expected to enhance the reliability and accuracy of underwater oil and gas exploration and production (E&P) operations (Schneider Electric Press Release, 2024).
    • In March 2024, Honeywell and Subsea 7, a leading subsea engineering, construction, and services company, entered into a strategic partnership to develop and integrate Honeywell's advanced sensing technologies into Subsea 7's subsea production systems. This collaboration aims to improve operational efficiency and safety in the oil and gas industry (Honeywell Press Release, 2024).
    • In May 2024, Emerson, a global technology and engineering company, completed the acquisition of Aventics, a leading provider of pneumatic components and systems. The acquisition is expected to strengthen Emerson's position in the market by expanding its product portfolio and enhancing its capabilities in the design and manufacturing of advanced pneumatic components for subsea applications (Emerson Press Release, 2024).
    • In April 2025, the US Bureau of Ocean Energy Management (BOEM) approved the use of Sonardyne International Ltd.'s Long Baseline (LBL) acoustic positioning system for deepwater oil and gas exploration and production activities in the Gulf of Mexico. This approval marks a significant milestone for Sonardyne, as it expands its presence in the US offshore energy market and demonstrates the company's commitment to providing advanced subsea positioning solutions (Sonardyne Press Release, 2025).

    Research Analyst Overview

    • The market encompasses a range of technologies, including dissolved oxygen sensors, wave measurement systems, multibeam sonar, current meters, fiber optic sensors, temperature sensors, underwater lighting, subsea construction equipment, network security solutions, data integrity tools, water quality monitoring systems, data security platforms, oceanographic research instruments, underwater cameras, sediment transport monitors, ph sensors, turbidity sensors, seismic survey equipment, underwater positioning systems, pressure transducers, and conductivity sensors. These sensors play a crucial role in various applications, from climate change mitigation and ocean acidification research to fisheries management and hydrographic surveying. The market is driven by the growing demand for accurate and reliable data in the maritime industry, as well as the increasing importance of underwater infrastructure, such as subsea power cables and underwater archaeology sites.
    • As such, trends in the market include advancements in sensor technology, integration of artificial intelligence and machine learning, and the growing importance of network security and data integrity. Additionally, geophysical surveys, wave measurement, and tidal monitoring are gaining traction due to their applications in renewable energy and coastal monitoring. Overall, the market is a dynamic and evolving industry that continues to shape the future of underwater exploration and infrastructure development.

    Dive into Technavio's robust research methodology, blending expert interviews, extensive data synthesis, and validated models for unparalleled Subsea Sensors Market insights. See full methodology.

    Market Scope

    Report Coverage

    Details

    Page number

    233

    Base year

    2024

    Historic period

    2019-2023

    Forecast period

    2025-2029

    Growth momentum & CAGR

    Accelerate at a CAGR of 7.1%

    Market growth 2025-2029

    USD 355.1 million

    Market structure

    Fragmented

    YoY growth 2024-2025(%)

    6.5

    Key countries

    US, Canada, Germany, UK, Italy, France, China, India, Japan, Brazil, Egypt, UAE, Oman, Argentina, KSA, UAE, Brazil, and Rest of World (ROW)

    Competitive landscape

    Leading Companies, Market Positioning of Companies, Competitive Strategies, and Industry Risks

    Request Free Sample

    What are the Key Data Covered in this Subsea Sensors Market Research and Growth Report?

    • CAGR of the Subsea Sensors industry during the forecast period
    • Detailed information on factors that will drive the growth and forecasting between 2025 and 2029
    • Precise estimation of the size of the market and its contribution of the industry in focus to the parent market
    • Accurate predictions about upcoming growth and trends and changes in consumer behaviour
    • Growth of the market across North America, Europe, APAC, Middle East and Africa, and South America
    • Thorough analysis of the market's competitive landscape and detailed information about companies
    • Comprehensive analysis of factors that will challenge the subsea sensors market growth of industry companies

    We can help! Our analysts can customize this subsea sensors market research report to meet your requirements.

    Get in touch

    1 Executive Summary

    • 1.1 Market overview
      • Executive Summary - Chart on Market Overview
      • Executive Summary - Data Table on Market Overview
      • Executive Summary - Chart on Global Market Characteristics
      • Executive Summary - Chart on Market by Geography
      • Executive Summary - Chart on Market Segmentation by Application
      • Executive Summary - Chart on Market Segmentation by Type
      • Executive Summary - Chart on Market Segmentation by End-user
      • Executive Summary - Chart on Incremental Growth
      • Executive Summary - Data Table on Incremental Growth
      • Executive Summary - Chart on Company Market Positioning

    2 Technavio Analysis

    • 2.1 Analysis of price sensitivity, lifecycle, customer purchase basket, adoption rates, and purchase criteria
      • Analysis of price sensitivity, lifecycle, customer purchase basket, adoption rates, and purchase criteria
    • 2.2 Criticality of inputs and Factors of differentiation
      • Overview on criticality of inputs and factors of differentiation
    • 2.3 Factors of disruption
      • Overview on factors of disruption
    • 2.4 Impact of drivers and challenges
      • Impact of drivers and challenges in 2024 and 2029

    3 Market Landscape

    • 3.1 Market ecosystem
      • Parent Market
      • Data Table on - Parent Market
    • 3.2 Market characteristics
      • Market characteristics analysis
    • 3.3 Value chain analysis
      • Value chain analysis

    4 Market Sizing

    • 4.1 Market definition
      • Offerings of companies included in the market definition
    • 4.2 Market segment analysis
      • Market segments
    • 4.3 Market size 2024
      • 4.4 Market outlook: Forecast for 2024-2029
        • Chart on Global - Market size and forecast 2024-2029 ($ million)
        • Data Table on Global - Market size and forecast 2024-2029 ($ million)
        • Chart on Global Market: Year-over-year growth 2024-2029 (%)
        • Data Table on Global Market: Year-over-year growth 2024-2029 (%)

      5 Historic Market Size

      • 5.1 Global Subsea Sensors Market 2019 - 2023
        • Historic Market Size - Data Table on Global Subsea Sensors Market 2019 - 2023 ($ million)
      • 5.2 Application segment analysis 2019 - 2023
        • Historic Market Size - Application Segment 2019 - 2023 ($ million)
      • 5.3 Type segment analysis 2019 - 2023
        • Historic Market Size - Type Segment 2019 - 2023 ($ million)
      • 5.4 End-user segment analysis 2019 - 2023
        • Historic Market Size - End-user Segment 2019 - 2023 ($ million)
      • 5.5 Geography segment analysis 2019 - 2023
        • Historic Market Size - Geography Segment 2019 - 2023 ($ million)
      • 5.6 Country segment analysis 2019 - 2023
        • Historic Market Size - Country Segment 2019 - 2023 ($ million)

      6 Qualitative Analysis

      • 6.1 The AI impact on global subsea sensors market

        7 Five Forces Analysis

        • 7.1 Five forces summary
          • Five forces analysis - Comparison between 2024 and 2029
        • 7.2 Bargaining power of buyers
          • Bargaining power of buyers - Impact of key factors 2024 and 2029
        • 7.3 Bargaining power of suppliers
          • Bargaining power of suppliers - Impact of key factors in 2024 and 2029
        • 7.4 Threat of new entrants
          • Threat of new entrants - Impact of key factors in 2024 and 2029
        • 7.5 Threat of substitutes
          • Threat of substitutes - Impact of key factors in 2024 and 2029
        • 7.6 Threat of rivalry
          • Threat of rivalry - Impact of key factors in 2024 and 2029
        • 7.7 Market condition
          • Chart on Market condition - Five forces 2024 and 2029

        8 Market Segmentation by Application

        • 8.1 Market segments
          • Chart on Application - Market share (2024-2029) (%)
          • Data Table on Application - Market share (2024-2029) (%)
        • 8.2 Comparison by Application
          • Chart on Comparison by Application
          • Data Table on Comparison by Application
        • 8.3 Commercial exploration - Market size and forecast (2024-2029)
          • Chart on Commercial exploration - Market size and forecast (2024-2029) ($ million)
          • Data Table on Commercial exploration - Market size and forecast (2024-2029) ($ million)
          • Chart on Commercial exploration - Year-over-year growth (2024-2029) (%)
          • Data Table on Commercial exploration - Year-over-year growth (2024-2029) (%)
        • 8.4 Defense and military - Market size and forecast (2024-2029)
          • Chart on Defense and military - Market size and forecast (2024-2029) ($ million)
          • Data Table on Defense and military - Market size and forecast (2024-2029) ($ million)
          • Chart on Defense and military - Year-over-year growth (2024-2029) (%)
          • Data Table on Defense and military - Year-over-year growth (2024-2029) (%)
        • 8.5 Oceanic research - Market size and forecast (2024-2029)
          • Chart on Oceanic research - Market size and forecast (2024-2029) ($ million)
          • Data Table on Oceanic research - Market size and forecast (2024-2029) ($ million)
          • Chart on Oceanic research - Year-over-year growth (2024-2029) (%)
          • Data Table on Oceanic research - Year-over-year growth (2024-2029) (%)
        • 8.6 Market opportunity by Application
          • Market opportunity by Application ($ million)
          • Data Table on Market opportunity by Application ($ million)

        9 Market Segmentation by Type

        • 9.1 Market segments
          • Chart on Type - Market share (2024-2029) (%)
          • Data Table on Type - Market share (2024-2029) (%)
        • 9.2 Comparison by Type
          • Chart on Comparison by Type
          • Data Table on Comparison by Type
        • 9.3 Pressure - Market size and forecast (2024-2029)
          • Chart on Pressure - Market size and forecast (2024-2029) ($ million)
          • Data Table on Pressure - Market size and forecast (2024-2029) ($ million)
          • Chart on Pressure - Year-over-year growth (2024-2029) (%)
          • Data Table on Pressure - Year-over-year growth (2024-2029) (%)
        • 9.4 Temperature - Market size and forecast (2024-2029)
          • Chart on Temperature - Market size and forecast (2024-2029) ($ million)
          • Data Table on Temperature - Market size and forecast (2024-2029) ($ million)
          • Chart on Temperature - Year-over-year growth (2024-2029) (%)
          • Data Table on Temperature - Year-over-year growth (2024-2029) (%)
        • 9.5 Acoustic - Market size and forecast (2024-2029)
          • Chart on Acoustic - Market size and forecast (2024-2029) ($ million)
          • Data Table on Acoustic - Market size and forecast (2024-2029) ($ million)
          • Chart on Acoustic - Year-over-year growth (2024-2029) (%)
          • Data Table on Acoustic - Year-over-year growth (2024-2029) (%)
        • 9.6 Image or optical - Market size and forecast (2024-2029)
          • Chart on Image or optical - Market size and forecast (2024-2029) ($ million)
          • Data Table on Image or optical - Market size and forecast (2024-2029) ($ million)
          • Chart on Image or optical - Year-over-year growth (2024-2029) (%)
          • Data Table on Image or optical - Year-over-year growth (2024-2029) (%)
        • 9.7 Others - Market size and forecast (2024-2029)
          • Chart on Others - Market size and forecast (2024-2029) ($ million)
          • Data Table on Others - Market size and forecast (2024-2029) ($ million)
          • Chart on Others - Year-over-year growth (2024-2029) (%)
          • Data Table on Others - Year-over-year growth (2024-2029) (%)
        • 9.8 Market opportunity by Type
          • Market opportunity by Type ($ million)
          • Data Table on Market opportunity by Type ($ million)

        10 Market Segmentation by End-user

        • 10.1 Market segments
          • Chart on End-user - Market share (2024-2029) (%)
          • Data Table on End-user - Market share (2024-2029) (%)
        • 10.2 Comparison by End-user
          • Chart on Comparison by End-user
          • Data Table on Comparison by End-user
        • 10.3 Oilfield service companies - Market size and forecast (2024-2029)
          • Chart on Oilfield service companies - Market size and forecast (2024-2029) ($ million)
          • Data Table on Oilfield service companies - Market size and forecast (2024-2029) ($ million)
          • Chart on Oilfield service companies - Year-over-year growth (2024-2029) (%)
          • Data Table on Oilfield service companies - Year-over-year growth (2024-2029) (%)
        • 10.4 Defense contractors - Market size and forecast (2024-2029)
          • Chart on Defense contractors - Market size and forecast (2024-2029) ($ million)
          • Data Table on Defense contractors - Market size and forecast (2024-2029) ($ million)
          • Chart on Defense contractors - Year-over-year growth (2024-2029) (%)
          • Data Table on Defense contractors - Year-over-year growth (2024-2029) (%)
        • 10.5 Research institutions - Market size and forecast (2024-2029)
          • Chart on Research institutions - Market size and forecast (2024-2029) ($ million)
          • Data Table on Research institutions - Market size and forecast (2024-2029) ($ million)
          • Chart on Research institutions - Year-over-year growth (2024-2029) (%)
          • Data Table on Research institutions - Year-over-year growth (2024-2029) (%)
        • 10.6 Renewable energy firms - Market size and forecast (2024-2029)
          • Chart on Renewable energy firms - Market size and forecast (2024-2029) ($ million)
          • Data Table on Renewable energy firms - Market size and forecast (2024-2029) ($ million)
          • Chart on Renewable energy firms - Year-over-year growth (2024-2029) (%)
          • Data Table on Renewable energy firms - Year-over-year growth (2024-2029) (%)
        • 10.7 Market opportunity by End-user
          • Market opportunity by End-user ($ million)
          • Data Table on Market opportunity by End-user ($ million)

        11 Market Segmentation by Depth

        • 11.1 Market segments
          • Chart on Depth - Market share (2024-2029) (%)
          • Data Table on Depth - Market share (2024-2029) (%)
        • 11.2 Comparison by Depth
          • Chart on Comparison by Depth
          • Data Table on Comparison by Depth
        • 11.3 Shallow Water - Market size and forecast (2024-2029)
          • Chart on Shallow Water - Market size and forecast (2024-2029) ($ million)
          • Data Table on Shallow Water - Market size and forecast (2024-2029) ($ million)
          • Chart on Shallow Water - Year-over-year growth (2024-2029) (%)
          • Data Table on Shallow Water - Year-over-year growth (2024-2029) (%)
        • 11.4 Deepwater - Market size and forecast (2024-2029)
          • Chart on Deepwater - Market size and forecast (2024-2029) ($ million)
          • Data Table on Deepwater - Market size and forecast (2024-2029) ($ million)
          • Chart on Deepwater - Year-over-year growth (2024-2029) (%)
          • Data Table on Deepwater - Year-over-year growth (2024-2029) (%)
        • 11.5 Ultra-Deepwater - Market size and forecast (2024-2029)
          • Chart on Ultra-Deepwater - Market size and forecast (2024-2029) ($ million)
          • Data Table on Ultra-Deepwater - Market size and forecast (2024-2029) ($ million)
          • Chart on Ultra-Deepwater - Year-over-year growth (2024-2029) (%)
          • Data Table on Ultra-Deepwater - Year-over-year growth (2024-2029) (%)
        • 11.6 Market opportunity by Depth
          • Market opportunity by Depth ($ million)
          • Data Table on Market opportunity by Depth ($ million)

        12 Customer Landscape

        • 12.1 Customer landscape overview
          • Analysis of price sensitivity, lifecycle, customer purchase basket, adoption rates, and purchase criteria

        13 Geographic Landscape

        • 13.1 Geographic segmentation
          • Chart on Market share by geography 2024-2029 (%)
          • Data Table on Market share by geography 2024-2029 (%)
        • 13.2 Geographic comparison
          • Chart on Geographic comparison
          • Data Table on Geographic comparison
        • 13.3 North America - Market size and forecast 2024-2029
          • Chart on North America - Market size and forecast 2024-2029 ($ million)
          • Data Table on North America - Market size and forecast 2024-2029 ($ million)
          • Chart on North America - Year-over-year growth 2024-2029 (%)
          • Data Table on North America - Year-over-year growth 2024-2029 (%)
        • 13.4 Europe - Market size and forecast 2024-2029
          • Chart on Europe - Market size and forecast 2024-2029 ($ million)
          • Data Table on Europe - Market size and forecast 2024-2029 ($ million)
          • Chart on Europe - Year-over-year growth 2024-2029 (%)
          • Data Table on Europe - Year-over-year growth 2024-2029 (%)
        • 13.5 APAC - Market size and forecast 2024-2029
          • Chart on APAC - Market size and forecast 2024-2029 ($ million)
          • Data Table on APAC - Market size and forecast 2024-2029 ($ million)
          • Chart on APAC - Year-over-year growth 2024-2029 (%)
          • Data Table on APAC - Year-over-year growth 2024-2029 (%)
        • 13.6 Middle East and Africa - Market size and forecast 2024-2029
          • Chart on Middle East and Africa - Market size and forecast 2024-2029 ($ million)
          • Data Table on Middle East and Africa - Market size and forecast 2024-2029 ($ million)
          • Chart on Middle East and Africa - Year-over-year growth 2024-2029 (%)
          • Data Table on Middle East and Africa - Year-over-year growth 2024-2029 (%)
        • 13.7 South America - Market size and forecast 2024-2029
          • Chart on South America - Market size and forecast 2024-2029 ($ million)
          • Data Table on South America - Market size and forecast 2024-2029 ($ million)
          • Chart on South America - Year-over-year growth 2024-2029 (%)
          • Data Table on South America - Year-over-year growth 2024-2029 (%)
        • 13.8 US - Market size and forecast 2024-2029
          • Chart on US - Market size and forecast 2024-2029 ($ million)
          • Data Table on US - Market size and forecast 2024-2029 ($ million)
          • Chart on US - Year-over-year growth 2024-2029 (%)
          • Data Table on US - Year-over-year growth 2024-2029 (%)
        • 13.9 China - Market size and forecast 2024-2029
          • Chart on China - Market size and forecast 2024-2029 ($ million)
          • Data Table on China - Market size and forecast 2024-2029 ($ million)
          • Chart on China - Year-over-year growth 2024-2029 (%)
          • Data Table on China - Year-over-year growth 2024-2029 (%)
        • 13.10 Norway - Market size and forecast 2024-2029
          • Chart on Norway - Market size and forecast 2024-2029 ($ million)
          • Data Table on Norway - Market size and forecast 2024-2029 ($ million)
          • Chart on Norway - Year-over-year growth 2024-2029 (%)
          • Data Table on Norway - Year-over-year growth 2024-2029 (%)
        • 13.11 UK - Market size and forecast 2024-2029
          • Chart on UK - Market size and forecast 2024-2029 ($ million)
          • Data Table on UK - Market size and forecast 2024-2029 ($ million)
          • Chart on UK - Year-over-year growth 2024-2029 (%)
          • Data Table on UK - Year-over-year growth 2024-2029 (%)
        • 13.12 Brazil - Market size and forecast 2024-2029
          • Chart on Brazil - Market size and forecast 2024-2029 ($ million)
          • Data Table on Brazil - Market size and forecast 2024-2029 ($ million)
          • Chart on Brazil - Year-over-year growth 2024-2029 (%)
          • Data Table on Brazil - Year-over-year growth 2024-2029 (%)
        • 13.13 Canada - Market size and forecast 2024-2029
          • Chart on Canada - Market size and forecast 2024-2029 ($ million)
          • Data Table on Canada - Market size and forecast 2024-2029 ($ million)
          • Chart on Canada - Year-over-year growth 2024-2029 (%)
          • Data Table on Canada - Year-over-year growth 2024-2029 (%)
        • 13.14 Japan - Market size and forecast 2024-2029
          • Chart on Japan - Market size and forecast 2024-2029 ($ million)
          • Data Table on Japan - Market size and forecast 2024-2029 ($ million)
          • Chart on Japan - Year-over-year growth 2024-2029 (%)
          • Data Table on Japan - Year-over-year growth 2024-2029 (%)
        • 13.15 Germany - Market size and forecast 2024-2029
          • Chart on Germany - Market size and forecast 2024-2029 ($ million)
          • Data Table on Germany - Market size and forecast 2024-2029 ($ million)
          • Chart on Germany - Year-over-year growth 2024-2029 (%)
          • Data Table on Germany - Year-over-year growth 2024-2029 (%)
        • 13.16 Saudi Arabia - Market size and forecast 2024-2029
          • Chart on Saudi Arabia - Market size and forecast 2024-2029 ($ million)
          • Data Table on Saudi Arabia - Market size and forecast 2024-2029 ($ million)
          • Chart on Saudi Arabia - Year-over-year growth 2024-2029 (%)
          • Data Table on Saudi Arabia - Year-over-year growth 2024-2029 (%)
        • 13.17 India - Market size and forecast 2024-2029
          • Chart on India - Market size and forecast 2024-2029 ($ million)
          • Data Table on India - Market size and forecast 2024-2029 ($ million)
          • Chart on India - Year-over-year growth 2024-2029 (%)
          • Data Table on India - Year-over-year growth 2024-2029 (%)
        • 13.18 Market opportunity by geography
          • Market opportunity by geography ($ million)
          • Data Tables on Market opportunity by geography ($ million)
        • 13.19 Italy - Market size and forecast (2024-2029)
          • Chart on Italy - Market size and forecast (2024-2029) ($ million)
          • Data Table on Italy - Market size and forecast (2024-2029) ($ million)
          • Chart on Italy - Year-over-year growth (2024-2029) (%)
          • Data Table on Italy - Year-over-year growth (2024-2029) (%)
        • 13.20 France - Market size and forecast (2024-2029)
          • Chart on France - Market size and forecast (2024-2029) ($ million)
          • Data Table on France - Market size and forecast (2024-2029) ($ million)
          • Chart on France - Year-over-year growth (2024-2029) (%)
          • Data Table on France - Year-over-year growth (2024-2029) (%)
        • 13.21 Egypt - Market size and forecast (2024-2029)
          • Chart on Egypt - Market size and forecast (2024-2029) ($ million)
          • Data Table on Egypt - Market size and forecast (2024-2029) ($ million)
          • Chart on Egypt - Year-over-year growth (2024-2029) (%)
          • Data Table on Egypt - Year-over-year growth (2024-2029) (%)
        • 13.22 UAE - Market size and forecast (2024-2029)
          • Chart on UAE - Market size and forecast (2024-2029) ($ million)
          • Data Table on UAE - Market size and forecast (2024-2029) ($ million)
          • Chart on UAE - Year-over-year growth (2024-2029) (%)
          • Data Table on UAE - Year-over-year growth (2024-2029) (%)
        • 13.23 Oman - Market size and forecast (2024-2029)
          • Chart on Oman - Market size and forecast (2024-2029) ($ million)
          • Data Table on Oman - Market size and forecast (2024-2029) ($ million)
          • Chart on Oman - Year-over-year growth (2024-2029) (%)
          • Data Table on Oman - Year-over-year growth (2024-2029) (%)
        • 13.24 Argentina - Market size and forecast (2024-2029)
          • Chart on Argentina - Market size and forecast (2024-2029) ($ million)
          • Data Table on Argentina - Market size and forecast (2024-2029) ($ million)
          • Chart on Argentina - Year-over-year growth (2024-2029) (%)
          • Data Table on Argentina - Year-over-year growth (2024-2029) (%)
        • 13.25 KSA - Market size and forecast (2024-2029)
          • Chart on KSA - Market size and forecast (2024-2029) ($ million)
          • Data Table on KSA - Market size and forecast (2024-2029) ($ million)
          • Chart on KSA - Year-over-year growth (2024-2029) (%)
          • Data Table on KSA - Year-over-year growth (2024-2029) (%)
        • 13.26 Rest of World (ROW) - Market size and forecast (2024-2029)
          • Chart on Rest of World (ROW) - Market size and forecast (2024-2029) ($ million)
          • Data Table on Rest of World (ROW) - Market size and forecast (2024-2029) ($ million)
          • Chart on Rest of World (ROW) - Year-over-year growth (2024-2029) (%)
          • Data Table on Rest of World (ROW) - Year-over-year growth (2024-2029) (%)

        14 Drivers, Challenges, and Opportunity/Restraints

        • 14.1 Market drivers
          • 14.2 Market challenges
            • 14.3 Impact of drivers and challenges
              • Impact of drivers and challenges in 2024 and 2029
            • 14.4 Market opportunities/restraints

              15 Competitive Landscape

              • 15.1 Overview
                • 15.2 Competitive Landscape
                  • Overview on criticality of inputs and factors of differentiation
                • 15.3 Landscape disruption
                  • Overview on factors of disruption
                • 15.4 Industry risks
                  • Impact of key risks on business

                16 Competitive Analysis

                • 16.1 Companies profiled
                  • Companies covered
                • 16.2 Company ranking index
                  • Company ranking index
                • 16.3 Market positioning of companies
                  • Matrix on companies position and classification
                • 16.4 AIS
                  • AIS - Overview
                  • AIS - Product / Service
                  • AIS - Key offerings
                  • SWOT
                • 16.5 Amphenol Corp.
                  • Amphenol Corp. - Overview
                  • Amphenol Corp. - Business segments
                  • Amphenol Corp. - Key news
                  • Amphenol Corp. - Key offerings
                  • Amphenol Corp. - Segment focus
                  • SWOT
                • 16.6 Baker Hughes Co.
                  • Baker Hughes Co. - Overview
                  • Baker Hughes Co. - Business segments
                  • Baker Hughes Co. - Key news
                  • Baker Hughes Co. - Key offerings
                  • Baker Hughes Co. - Segment focus
                  • SWOT
                • 16.7 Blueprint Subsea
                  • Blueprint Subsea - Overview
                  • Blueprint Subsea - Product / Service
                  • Blueprint Subsea - Key offerings
                  • SWOT
                • 16.8 ClampOn AS
                  • ClampOn AS - Overview
                  • ClampOn AS - Product / Service
                  • ClampOn AS - Key offerings
                  • SWOT
                • 16.9 Covelya Group Ltd.
                  • Covelya Group Ltd. - Overview
                  • Covelya Group Ltd. - Product / Service
                  • Covelya Group Ltd. - Key offerings
                  • SWOT
                • 16.10 Emerson Electric Co.
                  • Emerson Electric Co. - Overview
                  • Emerson Electric Co. - Business segments
                  • Emerson Electric Co. - Key news
                  • Emerson Electric Co. - Key offerings
                  • Emerson Electric Co. - Segment focus
                  • SWOT
                • 16.11 GP 50 NY LTD.
                  • GP 50 NY LTD. - Overview
                  • GP 50 NY LTD. - Product / Service
                  • GP 50 NY LTD. - Key offerings
                  • SWOT
                • 16.12 Hydrotechnik Test Engineering Ltd.
                  • Hydrotechnik Test Engineering Ltd. - Overview
                  • Hydrotechnik Test Engineering Ltd. - Product / Service
                  • Hydrotechnik Test Engineering Ltd. - Key offerings
                  • SWOT
                • 16.13 Impact Subsea Ltd.
                  • Impact Subsea Ltd. - Overview
                  • Impact Subsea Ltd. - Product / Service
                  • Impact Subsea Ltd. - Key offerings
                  • SWOT
                • 16.14 NATEC Sensors GmbH
                  • NATEC Sensors GmbH - Overview
                  • NATEC Sensors GmbH - Product / Service
                  • NATEC Sensors GmbH - Key offerings
                  • SWOT
                • 16.15 Norwegian Subsea AS
                  • Norwegian Subsea AS - Overview
                  • Norwegian Subsea AS - Product / Service
                  • Norwegian Subsea AS - Key offerings
                  • SWOT
                • 16.16 Seatools
                  • Seatools - Overview
                  • Seatools - Product / Service
                  • Seatools - Key offerings
                  • SWOT
                • 16.17 Siemens Energy AG
                  • Siemens Energy AG - Overview
                  • Siemens Energy AG - Business segments
                  • Siemens Energy AG - Key news
                  • Siemens Energy AG - Key offerings
                  • Siemens Energy AG - Segment focus
                  • SWOT
                • 16.18 Teledyne Technologies Inc.
                  • Teledyne Technologies Inc. - Overview
                  • Teledyne Technologies Inc. - Business segments
                  • Teledyne Technologies Inc. - Key news
                  • Teledyne Technologies Inc. - Key offerings
                  • Teledyne Technologies Inc. - Segment focus
                  • SWOT

                17 Appendix

                • 17.1 Scope of the report
                  • 17.2 Inclusions and exclusions checklist
                    • Inclusions checklist
                    • Exclusions checklist
                  • 17.3 Currency conversion rates for US$
                    • Currency conversion rates for US$
                  • 17.4 Research methodology
                    • Research methodology
                  • 17.5 Data procurement
                    • Information sources
                  • 17.6 Data validation
                    • Data validation
                  • 17.7 Validation techniques employed for market sizing
                    • Validation techniques employed for market sizing
                  • 17.8 Data synthesis
                    • Data synthesis
                  • 17.9 360 degree market analysis
                    • 360 degree market analysis
                  • 17.10 List of abbreviations
                    • List of abbreviations

                  Research Methodology

                  Technavio presents a detailed picture of the market by way of study, synthesis, and summation of data from multiple sources. The analysts have presented the various facets of the market with a particular focus on identifying the key industry influencers. The data thus presented is comprehensive, reliable, and the result of extensive research, both primary and secondary.

                  INFORMATION SOURCES

                  Primary sources

                  • Manufacturers and suppliers
                  • Channel partners
                  • Industry experts
                  • Strategic decision makers

                  Secondary sources

                  • Industry journals and periodicals
                  • Government data
                  • Financial reports of key industry players
                  • Historical data
                  • Press releases

                  DATA ANALYSIS

                  Data Synthesis

                  • Collation of data
                  • Estimation of key figures
                  • Analysis of derived insights

                  Data Validation

                  • Triangulation with data models
                  • Reference against proprietary databases
                  • Corroboration with industry experts

                  REPORT WRITING

                  Qualitative

                  • Market drivers
                  • Market challenges
                  • Market trends
                  • Five forces analysis

                  Quantitative

                  • Market size and forecast
                  • Market segmentation
                  • Geographical insights
                  • Competitive landscape

                  Interested in this report?

                  Get your sample now to see our research methodology and insights!

                  Download Now

                  Frequently Asked Questions

                  Subsea Sensors market growth will increase by $ 355.1 mn during 2025-2029 .

                  The Subsea Sensors market is expected to grow at a CAGR of 7.1% during 2025-2029 .

                  Subsea Sensors market is segmented by Application( Commercial exploration, Defense and military, Oceanic research) Type( Pressure, Temperature, Acoustic, Image or optical, Others) End-user( Oilfield service companies, Defense contractors, Research institutions, Renewable energy firms, South America)

                  AIS, Amphenol Corp., Baker Hughes Co., Blueprint Subsea, ClampOn AS, Covelya Group Ltd., Emerson Electric Co., GP 50 NY LTD., Hydrotechnik Test Engineering Ltd., Impact Subsea Ltd., James Fisher and Sons Plc, NATEC Sensors GmbH, Norwegian Subsea AS, Seatools, Sensor Technik Sirnach AG, Siemens Energy AG, SUCO Robert Scheuffele GmbH and Co. KG, TE Connectivity Ltd., Teledyne Technologies Inc., TTL Subsea Inc. are a few of the key vendors in the Subsea Sensors market.

                  North America will register the highest growth rate of 31% among the other regions. Therefore, the Subsea Sensors market in North America is expected to garner significant business opportunities for the vendors during the forecast period.

                  US, Canada, Germany, UK, Italy, France, China, India, Japan, Brazil, Egypt, UAE, Oman, Argentina, KSA, UAE, Brazil, Rest of World (ROW)

                  • Expansion of offshore oil and gas industryThe global offshore oil and gas industry continues to explore oil and gas resources in deeper waters and more remote locations to meet global energy demands. Subsea sensors are essential for monitoring oil and gas well conditions is the driving factor this market.
                  • detecting leaks is the driving factor this market.
                  • and ensuring the integrity of underwater oil and gas infrastructure. As traditional onshore oil and gas reserves face increasing depletion is the driving factor this market.
                  • oil and gas companies are turning to deeper offshore locations for exploration and production activities. Maintaining the integrity of subsea infrastructure is essential for safe and efficient operations. Subsea sensors provide real-time data on the condition of oil and gas pipelines is the driving factor this market.
                  • wellheads is the driving factor this market.
                  • and other critical equipment is the driving factor this market.
                  • allowing operators to detect any signs of corrosion is the driving factor this market.
                  • fatigue is the driving factor this market.
                  • or other issues before they escalate into larger and more costly failures. Subsea sensors help operators optimize production efficiency from underwater and deepwater reservoirs and wells by monitoring reservoir conditions is the driving factor this market.
                  • controlling flow rates is the driving factor this market.
                  • and identifying opportunities for process optimization. This enables oil and gas E and P operators to maximize production rates while minimizing operating costs and the environmental impact of their operations. Overall is the driving factor this market.
                  • the expansion of the offshore oil and gas industry presents significant opportunities for the global subsea sensors market is the driving factor this market.
                  • as operators increasingly rely on these technologies to ensure safe is the driving factor this market.
                  • efficient is the driving factor this market.
                  • and environmentally responsible operations in challenging offshore environments is the driving factor this market.
                  • which is the driving factor this market.
                  • in turn is the driving factor this market.
                  • will have a positive impact on the growth of the global subsea sensors market during the forecast period. is the driving factor this market.

                  The Subsea Sensors market vendors should focus on grabbing business opportunities from the Commercial exploration segment as it accounted for the largest market share in the base year.