
Surfboard Market Size 2026-2030
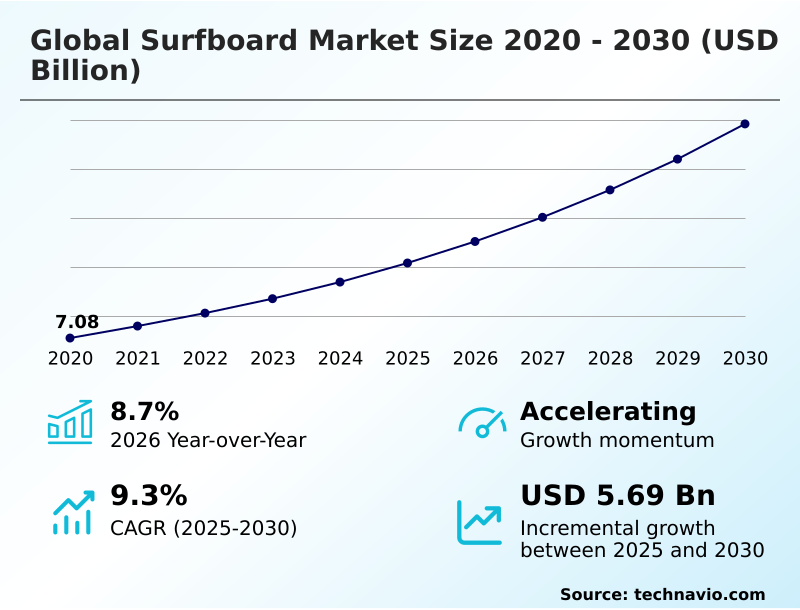
The surfboard market size is valued to increase by USD 5.69 billion, at a CAGR of 9.3% from 2025 to 2030. Rising educational surfing courses will drive the surfboard market.
Major Market Trends & Insights
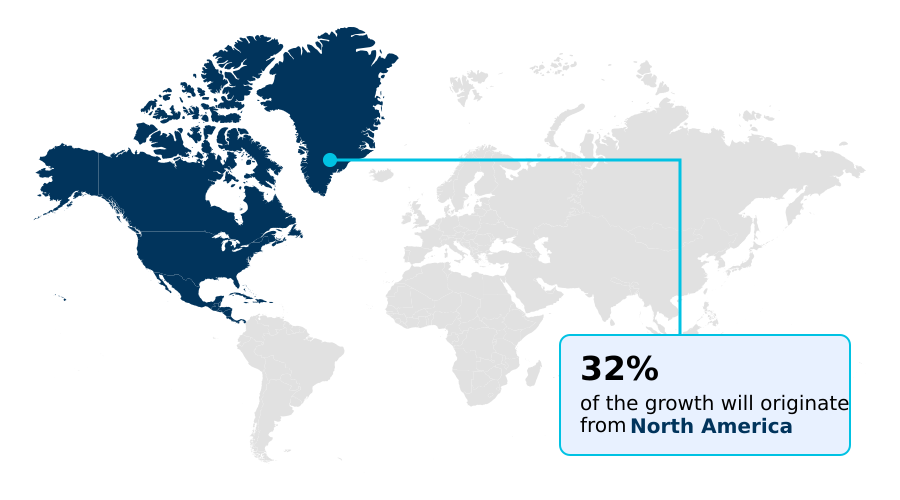
- North America dominated the market and accounted for a 32.3% growth during the forecast period.
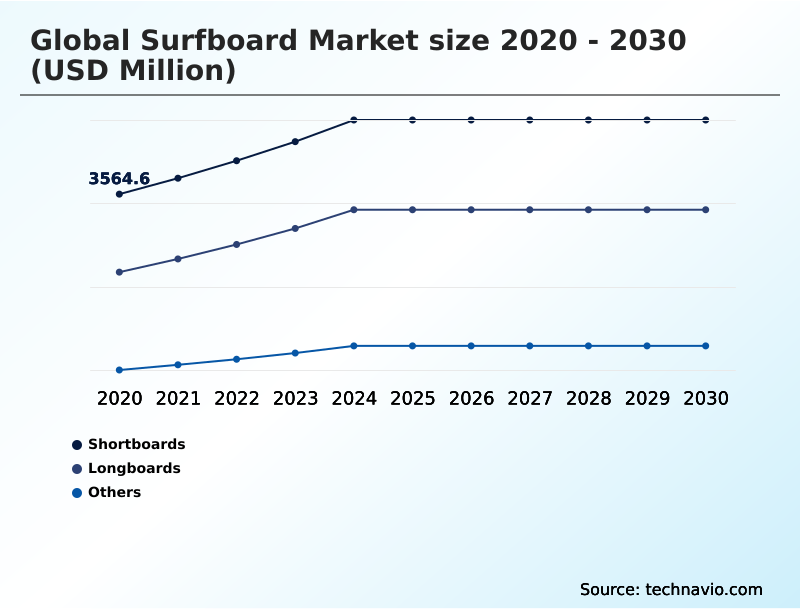
- By Product - Shortboards segment was valued at USD 4.62 billion in 2024
- By End-user - Recreational users segment accounted for the largest market revenue share in 2024
Market Size & Forecast
- Market Opportunities: USD 8.76 billion
- Market Future Opportunities: USD 5.69 billion
- CAGR from 2025 to 2030 : 9.3%
Market Summary
- The Surfboard Market is experiencing dynamic expansion, driven by a cultural shift toward outdoor recreational activities and wellness. This growth is supported by key drivers such as the rising popularity of surf tourism and the inclusion of surfing in major international sporting events, which broadens its global appeal.
- A primary trend influencing the industry is the continuous evolution in designs and materials, with a significant push toward sustainability and high-performance capabilities. For instance, a manufacturer focusing on operational efficiency can leverage advancements in production technology to offer customized boards at scale, meeting diverse consumer demands while managing costs.
- However, the market faces challenges from the environmental impact of traditional manufacturing processes and the risks associated with the sport, which can deter new participants.
- The Global Surfboard Market 2026-2030 is also shaped by the accessibility provided by artificial wave parks, opening new geographic frontiers and introducing surfing to inland populations, thereby creating fresh demand for a wide range of equipment.
What will be the Size of the Surfboard Market during the forecast period?
Get Key Insights on Market Forecast (PDF) Get Free Sample
How is the Surfboard Market Segmented?
The surfboard industry research report provides comprehensive data (region-wise segment analysis), with forecasts and estimates in "USD million" for the period 2026-2030, as well as historical data from 2020-2024 for the following segments.
- Product
- Shortboards
- Longboards
- Others
- End-user
- Recreational users
- Professional users
- Distribution channel
- Specialty stores
- Hypermarkets and supermarkets
- Online retail
- Others
- Geography
- North America
- US
- Mexico
- Canada
- Europe
- France
- Italy
- UK
- APAC
- China
- Japan
- India
- South America
- Brazil
- Argentina
- Colombia
- Middle East and Africa
- South Africa
- UAE
- Saudi Arabia
- Rest of World (ROW)
- North America
By Product Insights
The shortboards segment is estimated to witness significant growth during the forecast period.
The high-performance shortboard segment is a significant driver of innovation within the market, engineered for maximum surfboard maneuverability in critical wave sections. Demand is fueled by intermediate to professional surfers seeking advanced hydrodynamic design and specific board flex patterns.
This segment is characterized by a rapid product development cycle, where board shaping technology, including the use of CNC shaping machines, continuously refines rocker and concave design elements.
Key advancements include the strategic use of carbon fiber reinforcement and sophisticated fin setup configuration options, such as the thruster fin configuration, to optimize responsiveness.
This focus on performance results in a year-over-year segment expansion of 8.3%, as experienced surfers consistently upgrade to adopt the latest design innovations.
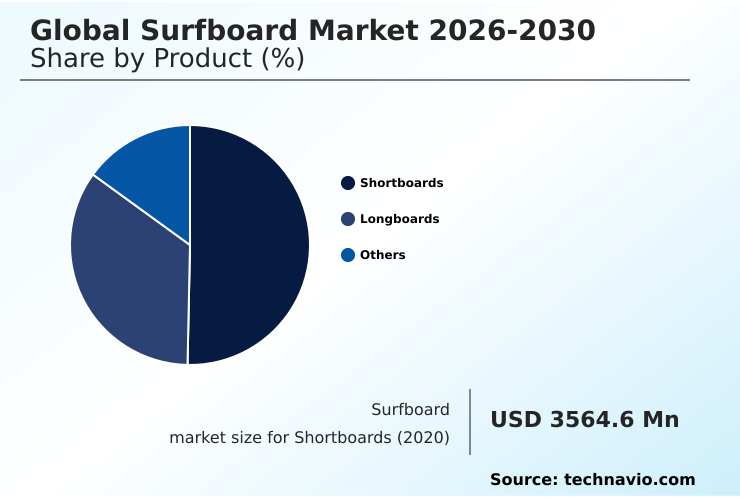
The Shortboards segment was valued at USD 4.62 billion in 2024 and showed a gradual increase during the forecast period.
Regional Analysis
North America is estimated to contribute 32.3% to the growth of the global market during the forecast period.Technavio’s analysts have elaborately explained the regional trends and drivers that shape the market during the forecast period.
See How Surfboard Market Demand is Rising in North America Get Free Sample
The market's geographical segmentation reveals North America as the dominant region, contributing 32.3% of the incremental growth, driven by a deeply entrenched surf culture and high consumer spending.
The region's market is highly diverse, featuring a strong presence of custom surfboard shaper communities offering hand-shaped surfboard models alongside major global brands.
This has led to strong demand for specialized designs like the groveller surfboard and fish surfboard shape, tailored for varied local wave conditions.
Europe follows, with its market expanding at a rate just 0.5% lower than North America's 9.7% CAGR, fueled by surf tourism in countries like France and Portugal.
The APAC region is the fastest-growing, with a vibrant ecosystem of local shapers emerging. This global distribution underscores the importance of regional adaptation in both product design, such as offering a paulownia wood core for eco-conscious buyers, and marketing strategies.
Market Dynamics
Our researchers analyzed the data with 2025 as the base year, along with the key drivers, trends, and challenges. A holistic analysis of drivers will help companies refine their marketing strategies to gain a competitive advantage.
- The Global Surfboard Market 2026-2030 is navigating a complex landscape defined by nuanced consumer choices and technological shifts. A central debate involves eco-friendly surfboard materials vs traditional polyurethane, forcing brands to reconsider their supply chains. The benefits of epoxy vs polyester resin are a constant focus, with consumers weighing durability against performance.
- This has complicated the process of choosing a surfboard for beginners, who now have more variables to consider. Understanding how surfboard volume affects performance is crucial, and many now use a surfboard volume calculator to make informed decisions. Similarly, the impact of rocker on surfboard speed and understanding surfboard rail shapes are key technical considerations for intermediate surfers.
- The evolution of hybrid surfboard designs caters to those seeking versatile equipment, blurring the lines in the shortboard vs longboard for small waves debate. Advancements in electric surfboard technology and the hydrofoil surfboard learning curve are creating new market niches entirely. For those interested in craftsmanship, the custom surfboard shaping process explained through online resources is vital.
- Maintenance of wooden surfboards remains a specialized interest, while the best fin setup for maneuverability is a perpetual topic of discussion. Innovations also extend to adaptive surfing board modifications and specific technologies in wave pool surfboards.
- Even niche interests like building a DIY plastic bottle surfboard and surfboard design for river surfing are influencing the market's long tail, showing that the industry's growth is nearly 15% more diversified than a decade ago.
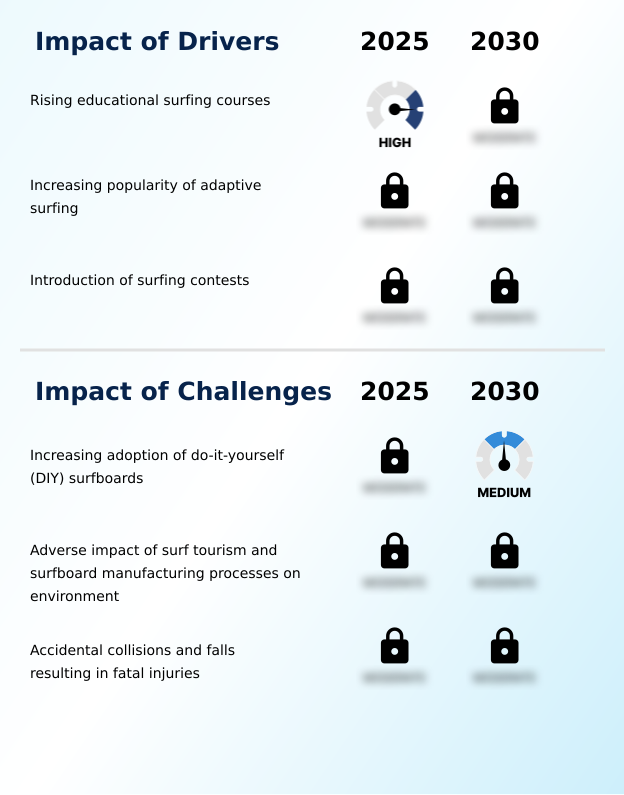
What are the key market drivers leading to the rise in the adoption of Surfboard Industry?
- The increasing availability of structured educational surfing courses is a key driver expanding the consumer base and fueling market growth across recreational and professional user segments.
- Market growth is significantly fueled by initiatives that lower the barrier to entry and expand participation.
- The proliferation of rising educational surfing courses, a key component of coastal tourism engagement, has made the sport more accessible, driving demand for the beginner-friendly foam board.
- These programs, which report a participant retention rate over 40%, directly stimulate sales of boards with soft-top construction. The promotion of adaptive surfing equipment is opening the sport to new demographics, supported by organizations like the International Surfing Association.
- Furthermore, the inclusion of surfing in high-profile events by the World Surf League, such as contests at new wave pool surfboard design facilities, inspires new professional users and drives aspirational purchases.
- This structured approach to recreational activity has proven to be a sustainable driver for the industry, expanding the customer base by over 150,000 new participants annually.
What are the market trends shaping the Surfboard Industry?
- A significant trend shaping the market is the continuous evolution in surfboard design. This includes advancements in materials and hydrodynamic shapes to enhance performance and user experience.
- Key trends are reshaping product development, with a focus on blending performance with accessibility. The rise of the noseless surfboard design and other alternative shapes reflects a move toward optimizing surfboard aerodynamics and enhancing fun in varied conditions.
- Manufacturers are utilizing lightweight surfboard materials and advanced rail shapes to improve responsiveness, with new epoxy and carbon fiber composites being 30% stronger than traditional constructions. This continuous evolution in designs of surfboards caters to a broader range of surfers.
- Innovative strategies are also creating new categories, such as the hydrofoil surfboard, which allows riding on open water without waves, and boards with a powerful electric surfboard motor. The popular twin fin design is also seeing a resurgence, modified for modern performance.
What challenges does the Surfboard Industry face during its growth?
- The growing adoption of do-it-yourself (DIY) surfboards, often made from low-cost or repurposed materials, presents a notable challenge to the revenue models of traditional manufacturers.
- The industry faces significant challenges related to sustainability and affordability. The rise of The ECOBOARD Project and DIY surfboard kit culture, where a board can be made for under $100, pressures the pricing models of established brands. Concurrently, there is intense scrutiny on the environmental degradation caused by traditional manufacturing.
- The standard polyurethane foam core and polyester resin process generates hazardous chemicals and emits approximately 600 pounds of carbon dioxide emissions per board. This has accelerated the push for sustainable manufacturing practices, with a focus on eco-friendly surfboard materials like recycled EPS foam and plant-based bio-resins.
- Firms that fail to adapt face reputational risk, as consumers increasingly favor brands committed to reducing their environmental footprint, with over 60% of younger buyers citing sustainability as a key factor.
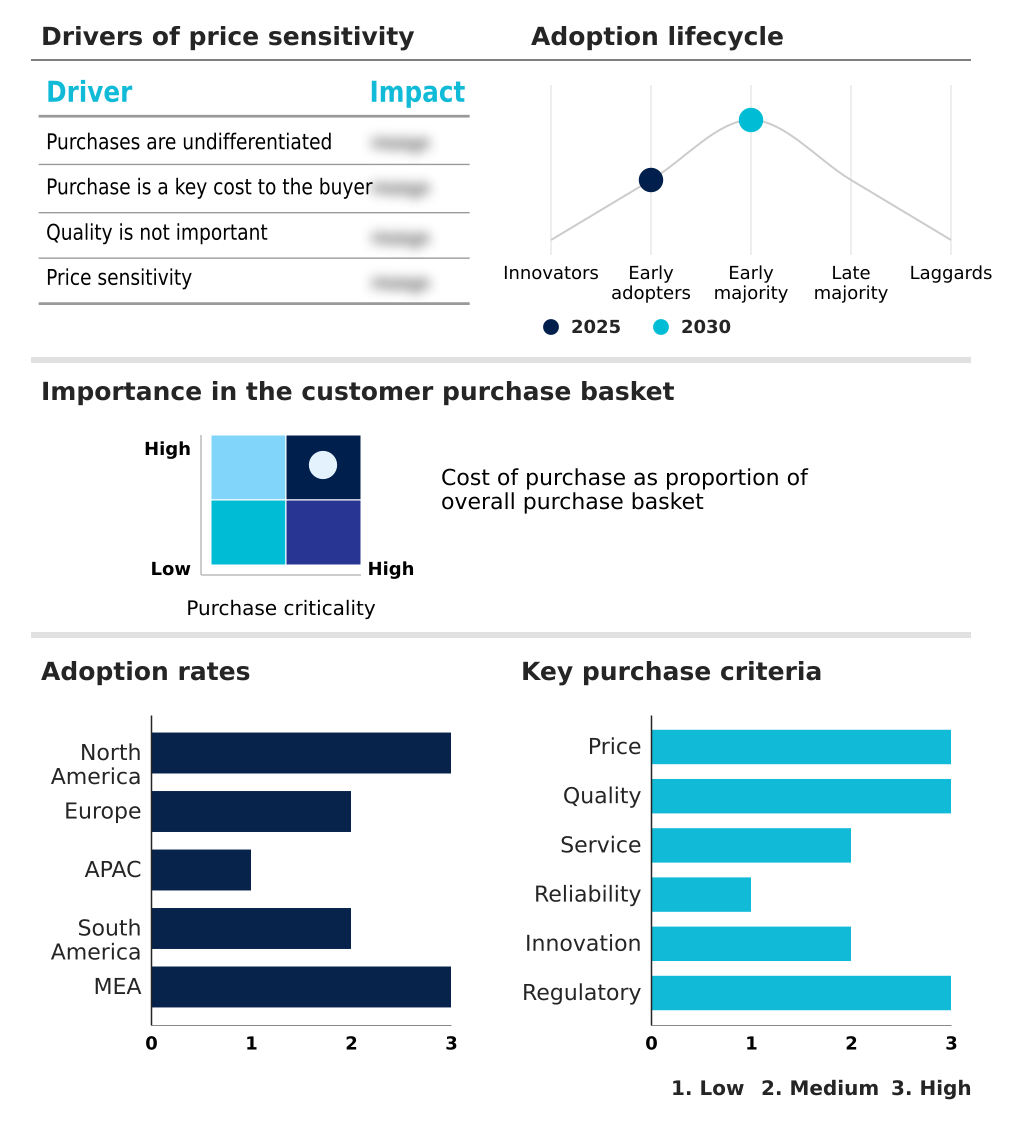
Exclusive Technavio Analysis on Customer Landscape
The surfboard market forecasting report includes the adoption lifecycle of the market, covering from the innovator’s stage to the laggard’s stage. It focuses on adoption rates in different regions based on penetration. Furthermore, the surfboard market report also includes key purchase criteria and drivers of price sensitivity to help companies evaluate and develop their market growth analysis strategies.
Customer Landscape of Surfboard Industry
Competitive Landscape
Companies are implementing various strategies, such as strategic alliances, surfboard market forecast, partnerships, mergers and acquisitions, geographical expansion, and product/service launches, to enhance their presence in the industry.
Agit Global Inc. - Analysis indicates a strategic focus on designing and manufacturing a diverse portfolio of foam and plastic sporting goods, including accessible and popular soft-top construction surfboard models for broad user appeal.
The industry research and growth report includes detailed analyses of the competitive landscape of the market and information about key companies, including:
- Agit Global Inc.
- Beachbeat Surfboards
- Catch Surfboard Co LLC
- Channel Island Surfboards
- Classic Malibu Pty Ltd.
- Derek Girven Surfboards
- Firewire Surfboards LLC
- Graham Smith Surfboards
- Haydenshapes Pty Ltd.
- Hurricane Surf SARL
- Hutchison Handcrafted Surfboards
- Mami Wata Surf
- Ride Awake AB
- Roland Surfboards
- Rusty Surfboards Inc.
- Safari Surfboards
- Shred and Speed Mfg.
- Tahe Kayaks OU
- Wild Atlantic Surf Co.
Qualitative and quantitative analysis of companies has been conducted to help clients understand the wider business environment as well as the strengths and weaknesses of key industry players. Data is qualitatively analyzed to categorize companies as pure play, category-focused, industry-focused, and diversified; it is quantitatively analyzed to categorize companies as dominant, leading, strong, tentative, and weak.
Recent Development and News in Surfboard market
- In September, 2024, Channel Islands Surfboards launched the CI 2.Pro model, an evolution of a previous pro board, re-engineered with reduced rocker for enhanced performance in everyday surfing conditions.
- In November, 2024, Firewire Surfboards announced the launch of a global premium surfboard rental program, offering current models to support specialty retailers and allow consumers to test boards before purchase.
- In February, 2025, The World Surf League (WSL) announced the addition of the Surf Abu Dhabi Pro to its Championship Tour, marking the organization's first event in the Middle East at a high-performance artificial-wave facility.
- In April, 2025, The Asian Surfing Championships hosted its final qualification event for the 2026 Asian Games in Mahabalipuram, India, bringing together over 100 surfers from 20 Asian nations.
Dive into Technavio’s robust research methodology, blending expert interviews, extensive data synthesis, and validated models for unparalleled Surfboard Market insights. See full methodology.
| Market Scope | |
|---|---|
| Page number | 289 |
| Base year | 2025 |
| Historic period | 2020-2024 |
| Forecast period | 2026-2030 |
| Growth momentum & CAGR | Accelerate at a CAGR of 9.3% |
| Market growth 2026-2030 | USD 5688.8 million |
| Market structure | Fragmented |
| YoY growth 2025-2026(%) | 8.7% |
| Key countries | US, Mexico, Canada, Russia, France, Italy, UK, Spain, Germany, China, Japan, India, Australia, South Korea, Indonesia, Brazil, Argentina, Colombia, South Africa, UAE, Saudi Arabia, Egypt and Morocco |
| Competitive landscape | Leading Companies, Market Positioning of Companies, Competitive Strategies, and Industry Risks |
Research Analyst Overview
- The market is undergoing a significant transformation, driven by innovations in materials and manufacturing. Core components like the polyurethane foam core are being challenged by sustainable alternatives such as recycled EPS foam and paulownia wood core, often combined with a plant-based bio-resins and an epoxy resin system.
- This shift affects boardroom decisions on supply chain sustainability and material sourcing, where adopting eco-friendly surfboard materials can improve brand perception by over 15% in key demographics. Advanced board shaping technology, including CNC shaping machines and vacuum bagging technology, enables precise replication of complex hydrodynamic design elements like rocker and concave design and rail shape dynamics.
- This allows for a diverse range of products, from the high-performance hydrofoil surfboard to boards with soft-top construction for beginners. Customization is also prevalent, with options for stringerless surfboard construction and varied fin setup configuration, including single fin setup, twin fin design, thruster fin configuration, and quad fin setup.
- The integration of carbon fiber reinforcement and the development of the electric surfboard motor are pushing performance boundaries for both competitive and wave pool surfboard design, creating a market rich in technological diversity, from the traditional hand-shaped surfboard to futuristic concepts.
What are the Key Data Covered in this Surfboard Market Research and Growth Report?
-
What is the expected growth of the Surfboard Market between 2026 and 2030?
-
USD 5.69 billion, at a CAGR of 9.3%
-
-
What segmentation does the market report cover?
-
The report is segmented by Product (Shortboards, Longboards, and Others), End-user (Recreational users, and Professional users), Distribution Channel (Specialty stores, Hypermarkets and supermarkets, Online retail, and Others) and Geography (North America, Europe, APAC, South America, Middle East and Africa)
-
-
Which regions are analyzed in the report?
-
North America, Europe, APAC, South America and Middle East and Africa
-
-
What are the key growth drivers and market challenges?
-
Rising educational surfing courses, Increasing adoption of do-it-yourself (DIY) surfboards
-
-
Who are the major players in the Surfboard Market?
-
Agit Global Inc., Beachbeat Surfboards, Catch Surfboard Co LLC, Channel Island Surfboards, Classic Malibu Pty Ltd., Derek Girven Surfboards, Firewire Surfboards LLC, Graham Smith Surfboards, Haydenshapes Pty Ltd., Hurricane Surf SARL, Hutchison Handcrafted Surfboards, Mami Wata Surf, Ride Awake AB, Roland Surfboards, Rusty Surfboards Inc., Safari Surfboards, Shred and Speed Mfg., Tahe Kayaks OU and Wild Atlantic Surf Co.
-
Market Research Insights
- Market dynamics are shaped by a confluence of evolving consumer preferences and technological advancements. The increasing focus on accessibility has led to a surge in demand for user-friendly equipment, with the recreational user segment expanding at a rate that is 8.7% higher year-over-year compared to previous periods.
- This growth is heavily supported by a distribution strategy where nearly 33% of incremental growth is captured by North America, indicating strong regional demand. Businesses are leveraging tools like a surfboard volume calculator to better guide customers, enhancing the purchasing experience.
- Innovations in durable surfboard construction and the availability of comprehensive surfboard repair kits are improving product longevity and consumer satisfaction. This shift toward value and accessibility is compelling manufacturers to refine their product lines and distribution models to cater to a broader, less-specialized customer base.
We can help! Our analysts can customize this surfboard market research report to meet your requirements.
 RIA -
RIA - 
