Sustainability Management Software Market Analysis, Size, and Forecast 2026-2030: North America (US, Canada, and Mexico), Europe (Germany, UK, and France), APAC (China, Japan, and India), South America (Brazil and Argentina), Middle East and Africa (Saudi Arabia, UAE, and South Africa), and Rest of World (ROW)

Sustainability Management Software Market Analysis, Size, and Forecast 2026-2030:
North America (US, Canada, and Mexico), Europe (Germany, UK, and France), APAC (China, Japan, and India), South America (Brazil and Argentina), Middle East and Africa (Saudi Arabia, UAE, and South Africa), and Rest of World (ROW)

Published: Mar 2026 312 Pages SKU: IRTNTR71466

Market Overview at a Glance

$1.82 B
Market Opportunity
14.9%
CAGR 2025 - 2030
36.9%
North America Growth
$872.9 Mn
IT and telecom segment 2024

Sustainability Management Software Market Size 2026-2030

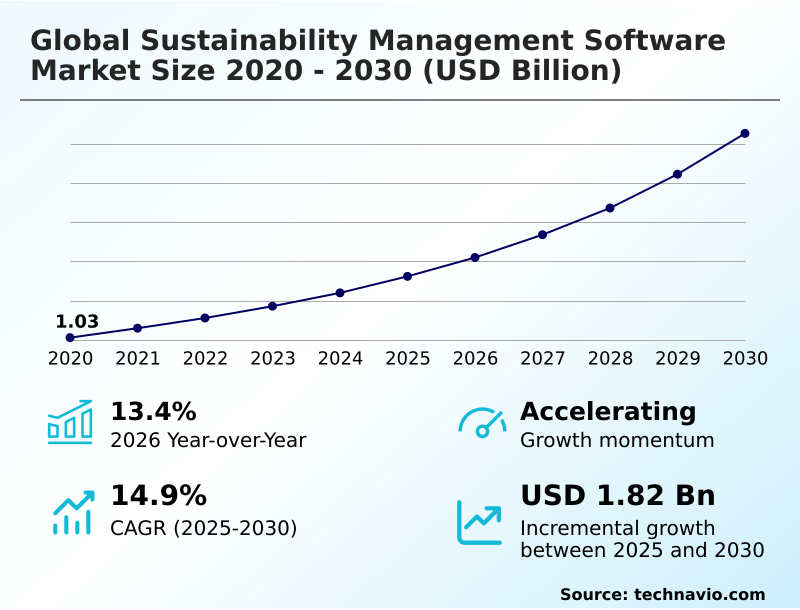
The sustainability management software market size is valued to increase by USD 1.82 billion, at a CAGR of 14.9% from 2025 to 2030. Regulatory compliance and industrialization of audit-ready reporting frameworks will drive the sustainability management software market.

Major Market Trends & Insights

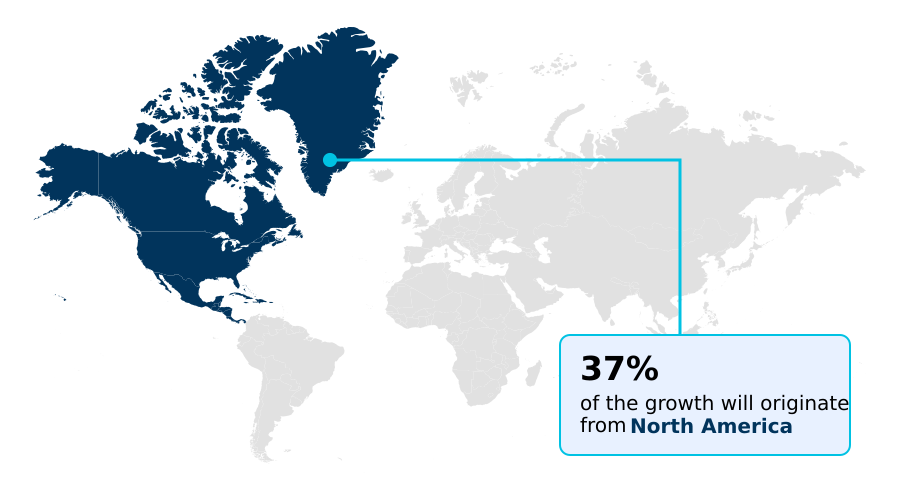
  • North America dominated the market and accounted for a 36.9% growth during the forecast period.
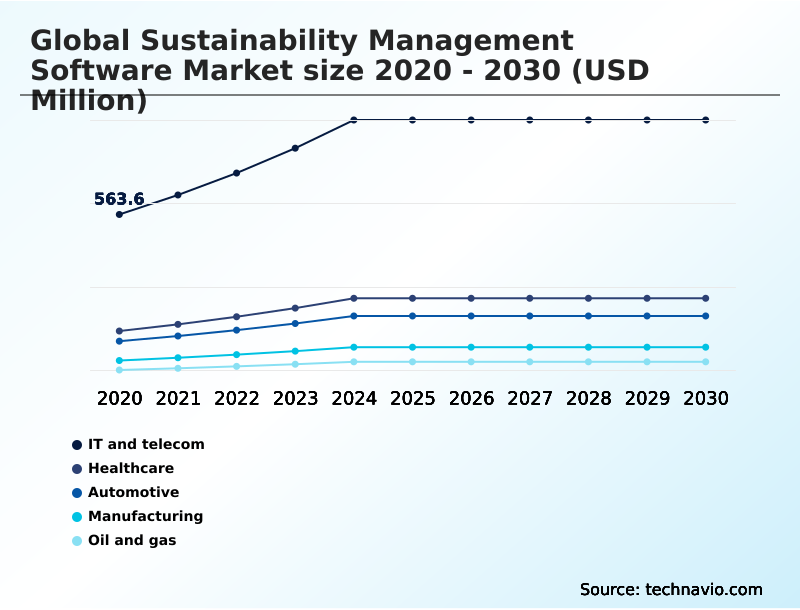
  • By Application - IT and telecom segment was valued at USD 872.9 million in 2024
  • By Deployment - Cloud segment accounted for the largest market revenue share in 2024

Market Size & Forecast

  • Market Opportunities: USD 2.59 billion
  • Market Future Opportunities: USD 1.82 billion
  • CAGR from 2025 to 2030 : 14.9%

Market Summary

  • The sustainability management software market is undergoing a transformative shift, moving beyond basic compliance to become a strategic engine for enterprise resilience. This evolution is driven by the urgent need for audit-ready reporting frameworks that satisfy mandates like the Corporate Sustainability Reporting Directive (CSRD).
  • Organizations are now required to perform double materiality assessments and provide transparent climate risk disclosures, which necessitates sophisticated ESG data management. For instance, a multinational manufacturing firm utilizes a carbon accounting platform to automate its scope 3 emissions tracking across a fragmented global supply chain.
  • By integrating life cycle assessment (LCA) tools, it calculates the product carbon footprint (PCF) for each SKU, preparing for the advent of digital product passports (DPP).
  • This move from manual spreadsheets to an integrated ESG reporting platform not only ensures GHG protocol compliance but also provides actionable insights for decarbonization, demonstrating how sustainability performance tracking has become integral to core business strategy and competitive positioning.

What will be the Size of the Sustainability Management Software Market during the forecast period?

Get Key Insights on Market Forecast (PDF) Request Free Sample

How is the Sustainability Management Software Market Segmented?

The sustainability management software industry research report provides comprehensive data (region-wise segment analysis), with forecasts and estimates in "USD million" for the period 2026-2030, as well as historical data from 2020-2024 for the following segments.

  • Application
    • IT and telecom
    • Healthcare
    • Automotive
    • Manufacturing
    • Oil and gas
  • Deployment
    • Cloud
    • On-premises
  • Type
    • Sustainability reporting and management
    • Utility data management
    • Carbon reporting and management
    • Energy optimization
    • Others
  • Geography
    • North America
      • US
      • Canada
      • Mexico
    • Europe
      • Germany
      • UK
      • France
    • APAC
      • China
      • Japan
      • India
    • South America
      • Brazil
      • Argentina
    • Middle East and Africa
      • Saudi Arabia
      • UAE
      • South Africa
    • Rest of World (ROW)

By Application Insights

The it and telecom segment is estimated to witness significant growth during the forecast period.

The IT and telecom segment leverages specialized platforms to manage the significant energy demands of data centers and network infrastructures.

Organizations use corporate sustainability software for energy consumption monitoring and to manage the carbon footprint of high-density computing, tracking metrics like real-time power usage effectiveness. These tools support a decarbonization pathway analysis and facilitate a shift toward renewable energy.

Beyond energy, the software aids in managing the hardware lifecycle, including e-waste recycling rate tracking, and ensures supply chain sustainability solutions adhere to circular economy principles.

As 5G deployment grows, the demand for scalable, cloud-based sustainability performance tracking tools with AI-powered ESG reporting and predictive emissions modeling is rising.

This allows for seamless enterprise resource planning integration and helps leaders align infrastructure expansion with net-zero commitments, supporting environmental compliance software needs.

Request Free Sample

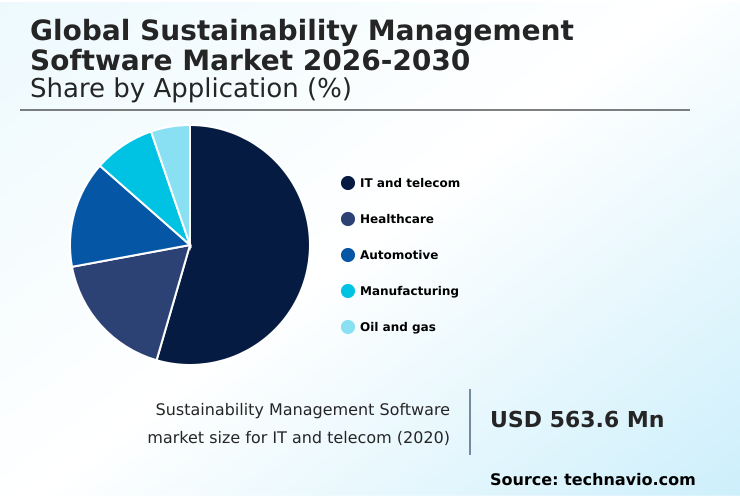
The IT and telecom segment was valued at USD 872.9 million in 2024 and showed a gradual increase during the forecast period.

Request Free Sample

Regional Analysis

North America is estimated to contribute 36.9% to the growth of the global market during the forecast period.Technavio’s analysts have elaborately explained the regional trends and drivers that shape the market during the forecast period.

See How Sustainability Management Software Market Demand is Rising in North America Request Free Sample

North America leads the global market, with a 36.9% share of the incremental growth, driven by a mature regulatory environment and intense investor pressure for ESG transparency.

Firms leverage corporate ESG platforms for GHG emissions calculation software and comprehensive climate risk disclosure. In Europe, which accounts for over 29% of the growth, mandates like the Carbon Border Adjustment Mechanism compel industries to adopt advanced compliance monitoring tools.

Software adoption is also high for managing supplier ESG scorecards and sustainable procurement software. The APAC region is the fastest-growing geography, where EHS management software is critical for tracking industrial outputs.

Across all regions, specialized modules for greenhouse gas emissions monitoring, methane leak detection, and water stewardship metrics are becoming standard as organizations use geospatial data analysis to refine their ESG risk management software strategies.

Market Dynamics

Our researchers analyzed the data with 2025 as the base year, along with the key drivers, trends, and challenges. A holistic analysis of drivers will help companies refine their marketing strategies to gain a competitive advantage.

  • Organizations are increasingly adopting specialized platforms to address complex sustainability challenges, moving beyond simple data collection. A primary focus is finding effective software for scope 3 emissions data collection, as this represents the largest and most difficult portion of a company's carbon footprint.
  • In parallel, CSRD compliance reporting software tools have become non-negotiable in Europe, compelling firms to enhance their data governance. The rise of AI for automated sustainability reporting is a critical enabler, reducing manual effort and improving accuracy. Another key area is digital product passport implementation software, which creates transparency at the SKU level.
  • This is often linked to technology for life cycle assessment for product carbon footprint, giving consumers and regulators a clear view of a product's impact. For holistic risk management, firms are investing in TNFD reporting and biodiversity tracking platforms. A significant technical hurdle remains the process of integrating ESG data with ERP systems, a task essential for real-time decision-making.
  • To manage value chain risks, companies are using supplier sustainability performance evaluation tools. The market also sees divergence in needs, with demand for the best sustainability software for manufacturing differing from the requirements of carbon accounting software for financial institutions. Other growing segments include software for real-time energy optimization and tools for managing climate risk with ESG software.
  • Automation is a recurring theme, evident in solutions for automating double materiality assessments. The ultimate goal for many is to understand how to achieve audit-ready esg disclosures. This has led to a varied technology landscape, seen in the cloud vs on-premise esg software comparison, and the emergence of sustainability management software for smes.
  • Finally, platforms are offering specific tools for tracking science-based targets and specialized ESG data platforms for private equity, alongside new tools for circular economy management and reporting on water stewardship metrics. Firms leveraging these integrated tools report a two-fold increase in the speed of responding to investor inquiries compared to those using siloed systems.

What are the key market drivers leading to the rise in the adoption of Sustainability Management Software Industry?

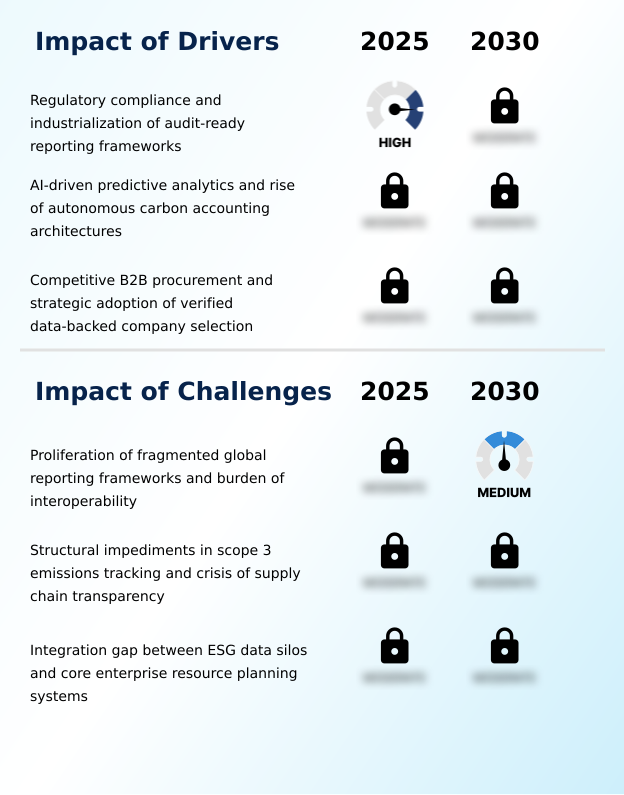
  • The transition toward mandatory regulatory compliance and the industrialization of audit-ready reporting frameworks are the primary drivers propelling market growth.

  • Regulatory mandates like the Corporate Sustainability Reporting Directive (CSRD) are a primary market driver, compelling firms to adopt corporate sustainability software for regulatory compliance automation. Automated ESG data collection has reduced manual data entry by over 60% for early adopters.
  • A second key driver is the rise of AI-powered ESG reporting and autonomous carbon accounting, which transforms sustainability data analytics from a reactive tool to a predictive engine.
  • These carbon accounting solutions enable deep decarbonization pathway analysis and use spend-based emission proxies to fill data gaps. The evolution of B2B procurement is a third driver, with buyers demanding verified data.
  • Over 10,000 companies have validated targets with the Science Based Targets initiative (SBTi), making verified performance from utility data management software a competitive necessity and driving ESG data aggregation.

What are the market trends shaping the Sustainability Management Software Industry?

  • The institutionalization of nature-related financial disclosures and the integration of biodiversity metrics into core enterprise reporting represent a structural market realignment.

  • Market trends are shifting toward the institutionalization of nature-related financial disclosures, with platforms now incorporating biodiversity metrics and environmental DNA (eDNA) data. This move beyond carbon aligns with frameworks like the TNFD.
  • The emergence of Digital Product Passports (DPP) is another key trend, with product sustainability tools now essential for cradle-to-gate emissions tracking; adoption of carbon footprint management software has helped firms reduce reporting errors by up to 25%.
  • A third major trend is the expansion of the continuous digital audit twin, which provides an always-on system for governance and has been shown to improve compliance verification speeds by 40%. These autonomous systems help automate double materiality assessment and enhance carbon credit management, moving firms toward audit-ready reporting frameworks and a robust net-zero strategy platform.

What challenges does the Sustainability Management Software Industry face during its growth?

  • The proliferation of fragmented global reporting frameworks and the resulting burden of interoperability pose a significant challenge to software implementation and adoption.

  • A primary market challenge is the difficulty of accurate Scope 3 emissions tracking, with over 55% of enterprises citing unreliable supplier data as a key obstacle, hindering full GHG protocol compliance and requiring better supply chain transparency tools. A second challenge is the integration gap between specialized ESG platforms and legacy enterprise resource planning (ERP) systems.
  • The demand for green ERP solutions is high, but the lack of standardized taxonomies impedes the flow of data for functions like life cycle assessment (LCA) and predictive emissions modeling. A third restraint is the fragmented global reporting landscape.
  • While bodies like the International Sustainability Standards Board (ISSB) aim for harmony, regional variations complicate ESG metrics tracking, social impact reporting, and specialized EHS management software functions like e-waste recycling rate tracking.

Exclusive Technavio Analysis on Customer Landscape

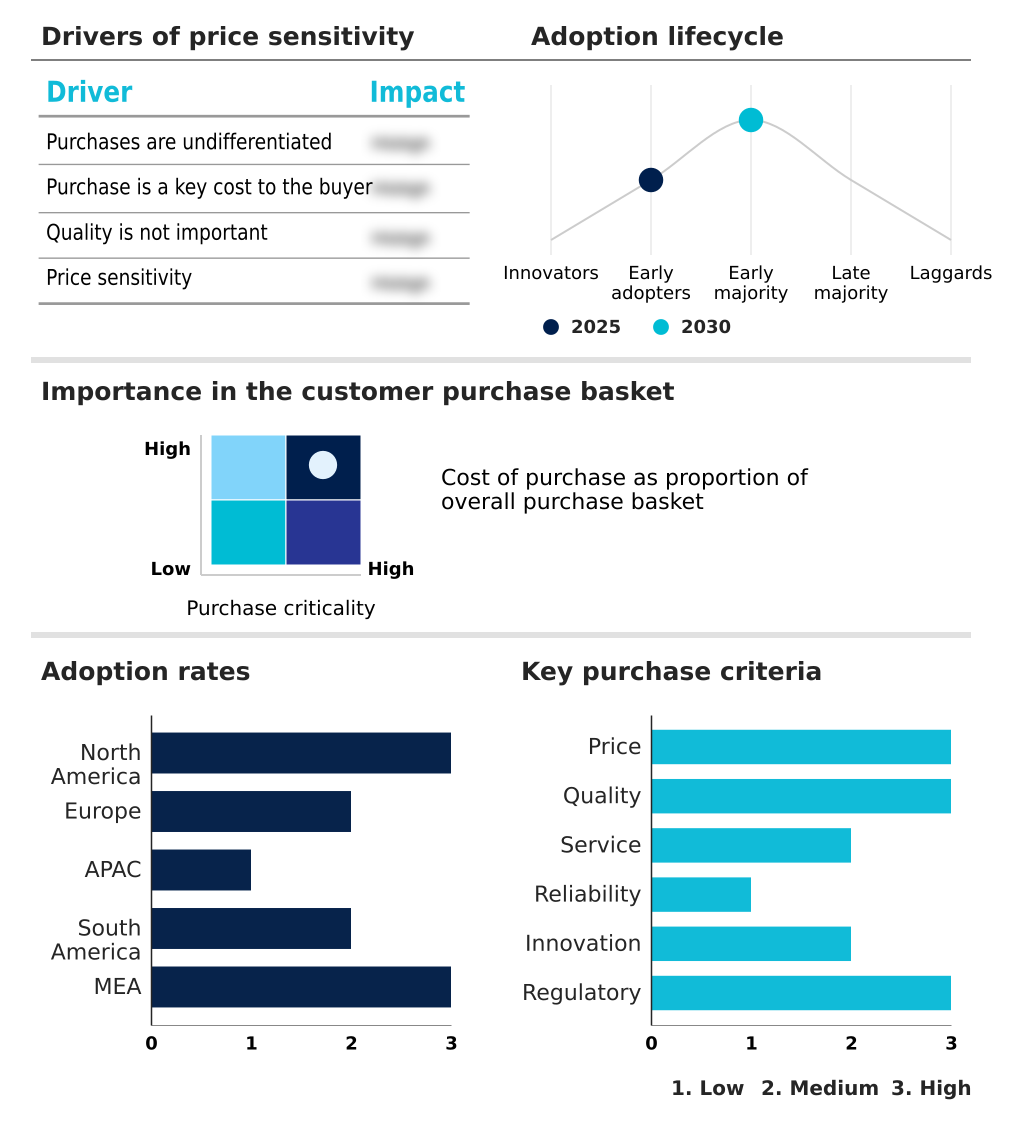
The sustainability management software market forecasting report includes the adoption lifecycle of the market, covering from the innovator’s stage to the laggard’s stage. It focuses on adoption rates in different regions based on penetration. Furthermore, the sustainability management software market report also includes key purchase criteria and drivers of price sensitivity to help companies evaluate and develop their market growth analysis strategies.

Customer Landscape of Sustainability Management Software Industry

Competitive Landscape

Companies are implementing various strategies, such as strategic alliances, sustainability management software market forecast, partnerships, mergers and acquisitions, geographical expansion, and product/service launches, to enhance their presence in the industry.

Benchmark Digital Partners LLC - Delivers unified software for ESG reporting, environmental compliance, and data-driven sustainability performance tracking to manage complex EHSQ requirements and ensure audit-readiness for enterprises.

The industry research and growth report includes detailed analyses of the competitive landscape of the market and information about key companies, including:

  • Benchmark Digital Partners LLC
  • Cority Software Inc.
  • Diligent Corp.
  • EcoVadis SAS
  • Emitwise Ltd.
  • IBM Corp.
  • Intelex Technologies ULC
  • Measurabl Inc.
  • Microsoft Corp.
  • NAVEX Global Inc.
  • Novata Inc.
  • OneTrust LLC
  • Persefoni AI Inc.
  • Salesforce Inc.
  • SAP SE
  • Sphera Solutions Inc.
  • UL LLC
  • VelocityEHS Holdings Inc.
  • Wolters Kluwer NV
  • Workiva Inc.

Qualitative and quantitative analysis of companies has been conducted to help clients understand the wider business environment as well as the strengths and weaknesses of key industry players. Data is qualitatively analyzed to categorize companies as pure play, category-focused, industry-focused, and diversified; it is quantitatively analyzed to categorize companies as dominant, leading, strong, tentative, and weak.

Recent Development and News in Sustainability management software market

  • In August, 2024, SAP SE announced an update to its Sustainability Control Tower, integrating advanced AI for autonomous carbon accounting to help enterprises automate Scope 3 emissions calculations and scenario modeling.
  • In November, 2024, Microsoft Corp. formed a strategic partnership with a leading geospatial data firm to integrate satellite-based biodiversity and land-use metrics into its Cloud for Sustainability, enhancing TNFD-aligned reporting capabilities.
  • In February, 2025, Workiva Inc. launched its ESRS Transition Accelerator, a solution designed to help organizations navigate the updated Corporate Sustainability Reporting Directive (CSRD) by automating gap analysis and streamlining audit-ready disclosures.
  • In May, 2025, Salesforce Inc. acquired a specialized Product Carbon Footprint (PCF) analytics startup, integrating its lifecycle assessment tools directly into the Net Zero Cloud to support digital product passport initiatives.

Dive into Technavio’s robust research methodology, blending expert interviews, extensive data synthesis, and validated models for unparalleled Sustainability Management Software Market insights. See full methodology.

Market Scope
Page number 312
Base year 2025
Historic period 2020-2024
Forecast period 2026-2030
Growth momentum & CAGR Accelerate at a CAGR of 14.9%
Market growth 2026-2030 USD 1819.4 million
Market structure Fragmented
YoY growth 2025-2026(%) 13.4%
Key countries US, Canada, Mexico, Germany, UK, France, Italy, Spain, The Netherlands, China, Japan, India, South Korea, Australia, Indonesia, Brazil, Argentina, Chile, Saudi Arabia, UAE, South Africa, Israel and Turkey
Competitive landscape Leading Companies, Market Positioning of Companies, Competitive Strategies, and Industry Risks

Request Free Sample

Research Analyst Overview

  • The sustainability management software market is maturing rapidly, driven by the need for enterprise-grade platforms that handle ESG data management and provide a clear decarbonization pathway analysis. At a boardroom level, decisions are now centered on achieving regulatory compliance automation for mandates like the Corporate Sustainability Reporting Directive (CSRD) and the Carbon Border Adjustment Mechanism.
  • This requires a sophisticated carbon accounting platform capable of detailed scope 3 emissions tracking and life cycle assessment (LCA) to generate an accurate Product Carbon Footprint (PCF). The focus is shifting to autonomous carbon accounting and predictive emissions modeling, where an AI-powered ESG reporting system functions as a continuous digital audit twin.
  • Leading firms have seen a 30% reduction in data validation errors by using such systems. This technology is crucial for adhering to standards from the International Sustainability Standards Board (ISSB) and the Science Based Targets initiative (SBTi). Furthermore, platforms must now integrate biodiversity metrics for TNFD reporting, manage carbon credit management, and support Digital Product Passports (DPP).
  • This involves everything from methane leak detection and water stewardship metrics to e-waste recycling rate tracking and enterprise resource planning integration, all underpinned by GHG protocol compliance, geospatial data analysis, and robust supplier ESG scorecards for verifiable climate risk disclosure.

What are the Key Data Covered in this Sustainability Management Software Market Research and Growth Report?

  • What is the expected growth of the Sustainability Management Software Market between 2026 and 2030?

    • USD 1.82 billion, at a CAGR of 14.9%

  • What segmentation does the market report cover?

    • The report is segmented by Application (IT and telecom, Healthcare, Automotive, Manufacturing, and Oil and gas), Deployment (Cloud, and On-premises), Type (Sustainability reporting and management, Utility data management, Carbon reporting and management, Energy optimization, and Others) and Geography (North America, Europe, APAC, South America, Middle East and Africa)

  • Which regions are analyzed in the report?

    • North America, Europe, APAC, South America and Middle East and Africa

  • What are the key growth drivers and market challenges?

    • Regulatory compliance and industrialization of audit-ready reporting frameworks, Proliferation of fragmented global reporting frameworks and burden of interoperability

  • Who are the major players in the Sustainability Management Software Market?

    • Benchmark Digital Partners LLC, Cority Software Inc., Diligent Corp., EcoVadis SAS, Emitwise Ltd., IBM Corp., Intelex Technologies ULC, Measurabl Inc., Microsoft Corp., NAVEX Global Inc., Novata Inc., OneTrust LLC, Persefoni AI Inc., Salesforce Inc., SAP SE, Sphera Solutions Inc., UL LLC, VelocityEHS Holdings Inc., Wolters Kluwer NV and Workiva Inc.

Market Research Insights

  • The market is defined by a shift from retrospective reporting to proactive, data-driven strategy. Organizations are adopting integrated platforms for ESG data aggregation and comprehensive sustainability performance tracking to meet complex regulatory demands. The use of environmental compliance software has enabled firms to align with new mandates, achieving a 95% audit-readiness rate within the first year of implementation.
  • Meanwhile, carbon footprint management software is critical for developing a credible net-zero strategy platform, with automated GHG emissions calculation software reducing reporting cycle times by up to 40%.
  • The demand for supply chain transparency tools is also surging as part of broader EHS management software ecosystems, with leading companies reporting a 15% improvement in identifying upstream risks through enhanced climate disclosure software.

We can help! Our analysts can customize this sustainability management software market research report to meet your requirements.

Get in touch

1. Executive Summary

1.1 Market overview

Executive Summary - Chart on Market Overview
Executive Summary - Data Table on Market Overview
Executive Summary - Chart on Global Market Characteristics
Executive Summary - Chart on Market by Geography
Executive Summary - Chart on Market Segmentation by Application
Executive Summary - Chart on Market Segmentation by Deployment
Executive Summary - Chart on Market Segmentation by Type
Executive Summary - Chart on Incremental Growth
Executive Summary - Data Table on Incremental Growth
Executive Summary - Chart on Company Market Positioning

2. Technavio Analysis

2.1 Analysis of price sensitivity, lifecycle, customer purchase basket, adoption rates, and purchase criteria

2.2 Criticality of inputs and Factors of differentiation

Chart on Overview on criticality of inputs and factors of differentiation

2.3 Factors of disruption

Chart on Overview on factors of disruption

2.4 Impact of drivers and challenges

Chart on Impact of drivers and challenges in 2025 and 2030

3. Market Landscape

3.1 Market ecosystem

Chart on Parent Market
Data Table on - Parent Market

3.2 Market characteristics

Chart on Market characteristics analysis

3.3 Value chain analysis

Chart on Value chain analysis

4. Market Sizing

4.1 Market definition

Data Table on Offerings of companies included in the market definition

4.2 Market segment analysis

Market segments

4.3 Market size 2025

4.4 Market outlook: Forecast for 2025-2030

Chart on Global - Market size and forecast 2025-2030 ($ million)
Data Table on Global - Market size and forecast 2025-2030 ($ million)
Chart on Global Market: Year-over-year growth 2025-2030 (%)
Data Table on Global Market: Year-over-year growth 2025-2030 (%)

5. Historic Market Size

5.1 Global Sustainability Management Software Market 2020 - 2024

Historic Market Size - Data Table on Global Sustainability Management Software Market 2020 - 2024 ($ million)

5.2 Application segment analysis 2020 - 2024

Historic Market Size - Application Segment 2020 - 2024 ($ million)

5.3 Deployment segment analysis 2020 - 2024

Historic Market Size - Deployment Segment 2020 - 2024 ($ million)

5.4 Type segment analysis 2020 - 2024

Historic Market Size - Type Segment 2020 - 2024 ($ million)

5.5 Geography segment analysis 2020 - 2024

Historic Market Size - Geography Segment 2020 - 2024 ($ million)

5.6 Country segment analysis 2020 - 2024

Historic Market Size - Country Segment 2020 - 2024 ($ million)

6. Qualitative Analysis

6.1 Impact of AI in global sustainability management software market

7. Five Forces Analysis

7.1 Five forces summary

Five forces analysis - Comparison between 2025 and 2030

7.2 Bargaining power of buyers

Bargaining power of buyers - Impact of key factors 2025 and 2030

7.3 Bargaining power of suppliers

Bargaining power of suppliers - Impact of key factors in 2025 and 2030

7.4 Threat of new entrants

Threat of new entrants - Impact of key factors in 2025 and 2030

7.5 Threat of substitutes

Threat of substitutes - Impact of key factors in 2025 and 2030

7.6 Threat of rivalry

Threat of rivalry - Impact of key factors in 2025 and 2030

7.7 Market condition

Chart on Market condition - Five forces 2025 and 2030

8. Market Segmentation by Application

8.1 Market segments

Chart on Application - Market share 2025-2030 (%)
Data Table on Application - Market share 2025-2030 (%)

8.2 Comparison by Application

Chart on Comparison by Application
Data Table on Comparison by Application

8.3 IT and telecom - Market size and forecast 2025-2030

Chart on IT and telecom - Market size and forecast 2025-2030 ($ million)
Data Table on IT and telecom - Market size and forecast 2025-2030 ($ million)
Chart on IT and telecom - Year-over-year growth 2025-2030 (%)
Data Table on IT and telecom - Year-over-year growth 2025-2030 (%)

8.4 Healthcare - Market size and forecast 2025-2030

Chart on Healthcare - Market size and forecast 2025-2030 ($ million)
Data Table on Healthcare - Market size and forecast 2025-2030 ($ million)
Chart on Healthcare - Year-over-year growth 2025-2030 (%)
Data Table on Healthcare - Year-over-year growth 2025-2030 (%)

8.5 Automotive - Market size and forecast 2025-2030

Chart on Automotive - Market size and forecast 2025-2030 ($ million)
Data Table on Automotive - Market size and forecast 2025-2030 ($ million)
Chart on Automotive - Year-over-year growth 2025-2030 (%)
Data Table on Automotive - Year-over-year growth 2025-2030 (%)

8.6 Manufacturing - Market size and forecast 2025-2030

Chart on Manufacturing - Market size and forecast 2025-2030 ($ million)
Data Table on Manufacturing - Market size and forecast 2025-2030 ($ million)
Chart on Manufacturing - Year-over-year growth 2025-2030 (%)
Data Table on Manufacturing - Year-over-year growth 2025-2030 (%)

8.7 Oil and gas - Market size and forecast 2025-2030

Chart on Oil and gas - Market size and forecast 2025-2030 ($ million)
Data Table on Oil and gas - Market size and forecast 2025-2030 ($ million)
Chart on Oil and gas - Year-over-year growth 2025-2030 (%)
Data Table on Oil and gas - Year-over-year growth 2025-2030 (%)

8.8 Market opportunity by Application

Market opportunity by Application ($ million)
Data Table on Market opportunity by Application ($ million)

9. Market Segmentation by Deployment

9.1 Market segments

Chart on Deployment - Market share 2025-2030 (%)
Data Table on Deployment - Market share 2025-2030 (%)

9.2 Comparison by Deployment

Chart on Comparison by Deployment
Data Table on Comparison by Deployment

9.3 Cloud - Market size and forecast 2025-2030

Chart on Cloud - Market size and forecast 2025-2030 ($ million)
Data Table on Cloud - Market size and forecast 2025-2030 ($ million)
Chart on Cloud - Year-over-year growth 2025-2030 (%)
Data Table on Cloud - Year-over-year growth 2025-2030 (%)

9.4 On-premises - Market size and forecast 2025-2030

Chart on On-premises - Market size and forecast 2025-2030 ($ million)
Data Table on On-premises - Market size and forecast 2025-2030 ($ million)
Chart on On-premises - Year-over-year growth 2025-2030 (%)
Data Table on On-premises - Year-over-year growth 2025-2030 (%)

9.5 Market opportunity by Deployment

Market opportunity by Deployment ($ million)
Data Table on Market opportunity by Deployment ($ million)

10. Market Segmentation by Type

10.1 Market segments

Chart on Type - Market share 2025-2030 (%)
Data Table on Type - Market share 2025-2030 (%)

10.2 Comparison by Type

Chart on Comparison by Type
Data Table on Comparison by Type

10.3 Sustainability reporting and management - Market size and forecast 2025-2030

Chart on Sustainability reporting and management - Market size and forecast 2025-2030 ($ million)
Data Table on Sustainability reporting and management - Market size and forecast 2025-2030 ($ million)
Chart on Sustainability reporting and management - Year-over-year growth 2025-2030 (%)
Data Table on Sustainability reporting and management - Year-over-year growth 2025-2030 (%)

10.4 Utility data management - Market size and forecast 2025-2030

Chart on Utility data management - Market size and forecast 2025-2030 ($ million)
Data Table on Utility data management - Market size and forecast 2025-2030 ($ million)
Chart on Utility data management - Year-over-year growth 2025-2030 (%)
Data Table on Utility data management - Year-over-year growth 2025-2030 (%)

10.5 Carbon reporting and management - Market size and forecast 2025-2030

Chart on Carbon reporting and management - Market size and forecast 2025-2030 ($ million)
Data Table on Carbon reporting and management - Market size and forecast 2025-2030 ($ million)
Chart on Carbon reporting and management - Year-over-year growth 2025-2030 (%)
Data Table on Carbon reporting and management - Year-over-year growth 2025-2030 (%)

10.6 Energy optimization - Market size and forecast 2025-2030

Chart on Energy optimization - Market size and forecast 2025-2030 ($ million)
Data Table on Energy optimization - Market size and forecast 2025-2030 ($ million)
Chart on Energy optimization - Year-over-year growth 2025-2030 (%)
Data Table on Energy optimization - Year-over-year growth 2025-2030 (%)

10.7 Others - Market size and forecast 2025-2030

Chart on Others - Market size and forecast 2025-2030 ($ million)
Data Table on Others - Market size and forecast 2025-2030 ($ million)
Chart on Others - Year-over-year growth 2025-2030 (%)
Data Table on Others - Year-over-year growth 2025-2030 (%)

10.8 Market opportunity by Type

Market opportunity by Type ($ million)
Data Table on Market opportunity by Type ($ million)

11. Customer Landscape

11.1 Customer landscape overview

Analysis of price sensitivity, lifecycle, customer purchase basket, adoption rates, and purchase criteria

12. Geographic Landscape

12.1 Geographic segmentation

Chart on Market share by geography 2025-2030 (%)
Data Table on Market share by geography 2025-2030 (%)

12.2 Geographic comparison

Chart on Geographic comparison
Data Table on Geographic comparison

12.3 North America - Market size and forecast 2025-2030

Chart on North America - Market size and forecast 2025-2030 ($ million)
Data Table on North America - Market size and forecast 2025-2030 ($ million)
Chart on North America - Year-over-year growth 2025-2030 (%)
Data Table on North America - Year-over-year growth 2025-2030 (%)
Chart on Regional Comparison - North America
Data Table on Regional Comparison - North America

12.3.1 US - Market size and forecast 2025-2030

Chart on US - Market size and forecast 2025-2030 ($ million)
Data Table on US - Market size and forecast 2025-2030 ($ million)
Chart on US - Year-over-year growth 2025-2030 (%)
Data Table on US - Year-over-year growth 2025-2030 (%)

12.3.2 Canada - Market size and forecast 2025-2030

Chart on Canada - Market size and forecast 2025-2030 ($ million)
Data Table on Canada - Market size and forecast 2025-2030 ($ million)
Chart on Canada - Year-over-year growth 2025-2030 (%)
Data Table on Canada - Year-over-year growth 2025-2030 (%)

12.3.3 Mexico - Market size and forecast 2025-2030

Chart on Mexico - Market size and forecast 2025-2030 ($ million)
Data Table on Mexico - Market size and forecast 2025-2030 ($ million)
Chart on Mexico - Year-over-year growth 2025-2030 (%)
Data Table on Mexico - Year-over-year growth 2025-2030 (%)

12.4 Europe - Market size and forecast 2025-2030

Chart on Europe - Market size and forecast 2025-2030 ($ million)
Data Table on Europe - Market size and forecast 2025-2030 ($ million)
Chart on Europe - Year-over-year growth 2025-2030 (%)
Data Table on Europe - Year-over-year growth 2025-2030 (%)
Chart on Regional Comparison - Europe
Data Table on Regional Comparison - Europe

12.4.1 Germany - Market size and forecast 2025-2030

Chart on Germany - Market size and forecast 2025-2030 ($ million)
Data Table on Germany - Market size and forecast 2025-2030 ($ million)
Chart on Germany - Year-over-year growth 2025-2030 (%)
Data Table on Germany - Year-over-year growth 2025-2030 (%)

12.4.2 UK - Market size and forecast 2025-2030

Chart on UK - Market size and forecast 2025-2030 ($ million)
Data Table on UK - Market size and forecast 2025-2030 ($ million)
Chart on UK - Year-over-year growth 2025-2030 (%)
Data Table on UK - Year-over-year growth 2025-2030 (%)

12.4.3 France - Market size and forecast 2025-2030

Chart on France - Market size and forecast 2025-2030 ($ million)
Data Table on France - Market size and forecast 2025-2030 ($ million)
Chart on France - Year-over-year growth 2025-2030 (%)
Data Table on France - Year-over-year growth 2025-2030 (%)

12.4.4 Italy - Market size and forecast 2025-2030

Chart on Italy - Market size and forecast 2025-2030 ($ million)
Data Table on Italy - Market size and forecast 2025-2030 ($ million)
Chart on Italy - Year-over-year growth 2025-2030 (%)
Data Table on Italy - Year-over-year growth 2025-2030 (%)

12.4.5 Spain - Market size and forecast 2025-2030

Chart on Spain - Market size and forecast 2025-2030 ($ million)
Data Table on Spain - Market size and forecast 2025-2030 ($ million)
Chart on Spain - Year-over-year growth 2025-2030 (%)
Data Table on Spain - Year-over-year growth 2025-2030 (%)

12.4.6 The Netherlands - Market size and forecast 2025-2030

Chart on The Netherlands - Market size and forecast 2025-2030 ($ million)
Data Table on The Netherlands - Market size and forecast 2025-2030 ($ million)
Chart on The Netherlands - Year-over-year growth 2025-2030 (%)
Data Table on The Netherlands - Year-over-year growth 2025-2030 (%)

12.5 APAC - Market size and forecast 2025-2030

Chart on APAC - Market size and forecast 2025-2030 ($ million)
Data Table on APAC - Market size and forecast 2025-2030 ($ million)
Chart on APAC - Year-over-year growth 2025-2030 (%)
Data Table on APAC - Year-over-year growth 2025-2030 (%)
Chart on Regional Comparison - APAC
Data Table on Regional Comparison - APAC

12.5.1 China - Market size and forecast 2025-2030

Chart on China - Market size and forecast 2025-2030 ($ million)
Data Table on China - Market size and forecast 2025-2030 ($ million)
Chart on China - Year-over-year growth 2025-2030 (%)
Data Table on China - Year-over-year growth 2025-2030 (%)

12.5.2 Japan - Market size and forecast 2025-2030

Chart on Japan - Market size and forecast 2025-2030 ($ million)
Data Table on Japan - Market size and forecast 2025-2030 ($ million)
Chart on Japan - Year-over-year growth 2025-2030 (%)
Data Table on Japan - Year-over-year growth 2025-2030 (%)

12.5.3 India - Market size and forecast 2025-2030

Chart on India - Market size and forecast 2025-2030 ($ million)
Data Table on India - Market size and forecast 2025-2030 ($ million)
Chart on India - Year-over-year growth 2025-2030 (%)
Data Table on India - Year-over-year growth 2025-2030 (%)

12.5.4 South Korea - Market size and forecast 2025-2030

Chart on South Korea - Market size and forecast 2025-2030 ($ million)
Data Table on South Korea - Market size and forecast 2025-2030 ($ million)
Chart on South Korea - Year-over-year growth 2025-2030 (%)
Data Table on South Korea - Year-over-year growth 2025-2030 (%)

12.5.5 Australia - Market size and forecast 2025-2030

Chart on Australia - Market size and forecast 2025-2030 ($ million)
Data Table on Australia - Market size and forecast 2025-2030 ($ million)
Chart on Australia - Year-over-year growth 2025-2030 (%)
Data Table on Australia - Year-over-year growth 2025-2030 (%)

12.5.6 Indonesia - Market size and forecast 2025-2030

Chart on Indonesia - Market size and forecast 2025-2030 ($ million)
Data Table on Indonesia - Market size and forecast 2025-2030 ($ million)
Chart on Indonesia - Year-over-year growth 2025-2030 (%)
Data Table on Indonesia - Year-over-year growth 2025-2030 (%)

12.6 South America - Market size and forecast 2025-2030

Chart on South America - Market size and forecast 2025-2030 ($ million)
Data Table on South America - Market size and forecast 2025-2030 ($ million)
Chart on South America - Year-over-year growth 2025-2030 (%)
Data Table on South America - Year-over-year growth 2025-2030 (%)
Chart on Regional Comparison - South America
Data Table on Regional Comparison - South America

12.6.1 Brazil - Market size and forecast 2025-2030

Chart on Brazil - Market size and forecast 2025-2030 ($ million)
Data Table on Brazil - Market size and forecast 2025-2030 ($ million)
Chart on Brazil - Year-over-year growth 2025-2030 (%)
Data Table on Brazil - Year-over-year growth 2025-2030 (%)

12.6.2 Argentina - Market size and forecast 2025-2030

Chart on Argentina - Market size and forecast 2025-2030 ($ million)
Data Table on Argentina - Market size and forecast 2025-2030 ($ million)
Chart on Argentina - Year-over-year growth 2025-2030 (%)
Data Table on Argentina - Year-over-year growth 2025-2030 (%)

12.6.3 Chile - Market size and forecast 2025-2030

Chart on Chile - Market size and forecast 2025-2030 ($ million)
Data Table on Chile - Market size and forecast 2025-2030 ($ million)
Chart on Chile - Year-over-year growth 2025-2030 (%)
Data Table on Chile - Year-over-year growth 2025-2030 (%)

12.7 Middle East and Africa - Market size and forecast 2025-2030

Chart on Middle East and Africa - Market size and forecast 2025-2030 ($ million)
Data Table on Middle East and Africa - Market size and forecast 2025-2030 ($ million)
Chart on Middle East and Africa - Year-over-year growth 2025-2030 (%)
Data Table on Middle East and Africa - Year-over-year growth 2025-2030 (%)
Chart on Regional Comparison - Middle East and Africa
Data Table on Regional Comparison - Middle East and Africa

12.7.1 Saudi Arabia - Market size and forecast 2025-2030

Chart on Saudi Arabia - Market size and forecast 2025-2030 ($ million)
Data Table on Saudi Arabia - Market size and forecast 2025-2030 ($ million)
Chart on Saudi Arabia - Year-over-year growth 2025-2030 (%)
Data Table on Saudi Arabia - Year-over-year growth 2025-2030 (%)

12.7.2 UAE - Market size and forecast 2025-2030

Chart on UAE - Market size and forecast 2025-2030 ($ million)
Data Table on UAE - Market size and forecast 2025-2030 ($ million)
Chart on UAE - Year-over-year growth 2025-2030 (%)
Data Table on UAE - Year-over-year growth 2025-2030 (%)

12.7.3 South Africa - Market size and forecast 2025-2030

Chart on South Africa - Market size and forecast 2025-2030 ($ million)
Data Table on South Africa - Market size and forecast 2025-2030 ($ million)
Chart on South Africa - Year-over-year growth 2025-2030 (%)
Data Table on South Africa - Year-over-year growth 2025-2030 (%)

12.7.4 Israel - Market size and forecast 2025-2030

Chart on Israel - Market size and forecast 2025-2030 ($ million)
Data Table on Israel - Market size and forecast 2025-2030 ($ million)
Chart on Israel - Year-over-year growth 2025-2030 (%)
Data Table on Israel - Year-over-year growth 2025-2030 (%)

12.7.5 Turkey - Market size and forecast 2025-2030

Chart on Turkey - Market size and forecast 2025-2030 ($ million)
Data Table on Turkey - Market size and forecast 2025-2030 ($ million)
Chart on Turkey - Year-over-year growth 2025-2030 (%)
Data Table on Turkey - Year-over-year growth 2025-2030 (%)

12.8 Market opportunity by geography

Market opportunity by geography ($ million)
Data Tables on Market opportunity by geography ($ million)

13. Drivers, Challenges, and Opportunity

13.1 Market drivers

Regulatory compliance and industrialization of audit-ready reporting frameworks
AI-driven predictive analytics and rise of autonomous carbon accounting architectures
Competitive B2B procurement and strategic adoption of verified data-backed company selection

13.2 Market challenges

Proliferation of fragmented global reporting frameworks and burden of interoperability
Structural impediments in scope 3 emissions tracking and crisis of supply chain transparency
Integration gap between ESG data silos and core enterprise resource planning systems

13.3 Impact of drivers and challenges

Impact of drivers and challenges in 2025 and 2030

13.4 Market opportunities

Nature-related financial disclosures and biodiversity metrics
Increase in product carbon footprints (PCF) and digital product passports
Strategic expansion of continuous digital audit twins and autonomous governance

14. Competitive Landscape

14.1 Overview

14.2

Overview on criticality of inputs and factors of differentiation

14.3 Landscape disruption

Overview on factors of disruption

14.4 Industry risks

Impact of key risks on business

15. Competitive Analysis

15.1 Companies profiled

Companies covered

15.2 Company ranking index

15.3 Market positioning of companies

Matrix on companies position and classification

15.4 Cority Software Inc.

Cority Software Inc. - Overview
Cority Software Inc. - Product / Service
Cority Software Inc. - Key offerings
SWOT

15.5 Diligent Corp.

Diligent Corp. - Overview
Diligent Corp. - Product / Service
Diligent Corp. - Key offerings
SWOT

15.6 EcoVadis SAS

EcoVadis SAS - Overview
EcoVadis SAS - Product / Service
EcoVadis SAS - Key offerings
SWOT

15.7 IBM Corp.

IBM Corp. - Overview
IBM Corp. - Business segments
IBM Corp. - Key news
IBM Corp. - Key offerings
IBM Corp. - Segment focus
SWOT

15.8 Intelex Technologies ULC

Intelex Technologies ULC - Overview
Intelex Technologies ULC - Product / Service
Intelex Technologies ULC - Key offerings
SWOT

15.9 Microsoft Corp.

Microsoft Corp. - Overview
Microsoft Corp. - Business segments
Microsoft Corp. - Key news
Microsoft Corp. - Key offerings
Microsoft Corp. - Segment focus
SWOT

15.10 Novata Inc.

Novata Inc. - Overview
Novata Inc. - Product / Service
Novata Inc. - Key offerings
SWOT

15.11 Persefoni AI Inc.

Persefoni AI Inc. - Overview
Persefoni AI Inc. - Product / Service
Persefoni AI Inc. - Key offerings
SWOT

15.12 Salesforce Inc.

Salesforce Inc. - Overview
Salesforce Inc. - Product / Service
Salesforce Inc. - Key news
Salesforce Inc. - Key offerings
SWOT

15.13 SAP SE

SAP SE - Overview
SAP SE - Business segments
SAP SE - Key news
SAP SE - Key offerings
SAP SE - Segment focus
SWOT

15.14 Sphera Solutions Inc.

Sphera Solutions Inc. - Overview
Sphera Solutions Inc. - Product / Service
Sphera Solutions Inc. - Key offerings
SWOT

15.15 UL LLC

UL LLC - Overview
UL LLC - Business segments
UL LLC - Key offerings
UL LLC - Segment focus
SWOT

15.16 VelocityEHS Holdings Inc.

VelocityEHS Holdings Inc. - Overview
VelocityEHS Holdings Inc. - Product / Service
VelocityEHS Holdings Inc. - Key offerings
SWOT

15.17 Wolters Kluwer NV

Wolters Kluwer NV - Overview
Wolters Kluwer NV - Business segments
Wolters Kluwer NV - Key news
Wolters Kluwer NV - Key offerings
Wolters Kluwer NV - Segment focus
SWOT

15.18 Workiva Inc.

Workiva Inc. - Overview
Workiva Inc. - Product / Service
Workiva Inc. - Key offerings
SWOT

16. Appendix

16.1 Scope of the report

Market definition
Objectives
Notes and caveats

16.2 Inclusions and exclusions checklist

Inclusions checklist
Exclusions checklist

16.3 Currency conversion rates for US$

16.4 Research methodology

16.5 Data procurement

Information sources

16.6 Data validation

16.7 Validation techniques employed for market sizing

16.8 Data synthesis

16.9 360 degree market analysis

16.10 List of abbreviations

Research Methodology

Technavio presents a detailed picture of the market by way of study, synthesis, and summation of data from multiple sources. The analysts have presented the various facets of the market with a particular focus on identifying the key industry influencers. The data thus presented is comprehensive, reliable, and the result of extensive research, both primary and secondary.

INFORMATION SOURCES

Primary sources

  • Manufacturers and suppliers
  • Channel partners
  • Industry experts
  • Strategic decision makers

Secondary sources

  • Industry journals and periodicals
  • Government data
  • Financial reports of key industry players
  • Historical data
  • Press releases

DATA ANALYSIS

Data Synthesis

  • Collation of data
  • Estimation of key figures
  • Analysis of derived insights

Data Validation

  • Triangulation with data models
  • Reference against proprietary databases
  • Corroboration with industry experts

REPORT WRITING

Qualitative

  • Market drivers
  • Market challenges
  • Market trends
  • Five forces analysis

Quantitative

  • Market size and forecast
  • Market segmentation
  • Geographical insights
  • Competitive landscape

Interested in this report?

Get your sample now to see our research methodology and insights!

Download Now

Frequently Asked Questions

Sustainability Management Software market growth will increase by USD 1819.4 million during 2026-2030.

The Sustainability Management Software market is expected to grow at a CAGR of 14.9% during 2026-2030.

Sustainability Management Software market is segmented by Application (IT and telecom, Healthcare, Automotive, Manufacturing, Oil and gas) Deployment (Cloud, On-premises) Type (Sustainability reporting and management, Utility data management, Carbon reporting and management, Energy optimization, Others)

Benchmark Digital Partners LLC, Cority Software Inc., Diligent Corp., EcoVadis SAS, Emitwise Ltd., IBM Corp., Intelex Technologies ULC, Measurabl Inc., Microsoft Corp., NAVEX Global Inc., Novata Inc., OneTrust LLC, Persefoni AI Inc., Salesforce Inc., SAP SE, Sphera Solutions Inc., UL LLC, VelocityEHS Holdings Inc., Wolters Kluwer NV, Workiva Inc. are a few of the key vendors in the Sustainability Management Software market.

North America will register the highest growth rate of 36.9% among the other regions. Therefore, the Sustainability Management Software market in North America is expected to garner significant business opportunities for the vendors during the forecast period.

US, Canada, Mexico, Germany, UK, France, Italy, Spain, The Netherlands, China, Japan, India, South Korea, Australia, Indonesia, Brazil, Argentina, Chile, Saudi Arabia, UAE, South Africa, Israel, Turkey

  • Regulatory compliance and industrialization of audit-ready reporting frameworks is the driving factor this market.

The Sustainability Management Software market vendors should focus on grabbing business opportunities from the Application segment as it accounted for the largest market share in the base year.
RIA - Research AI Assistant
Ask RIA