Sustainable Fabrics Market Analysis, Size, and Forecast 2026-2030: APAC (China, India, and Japan), Europe (Germany, France, and Italy), North America (US, Canada, and Mexico), South America (Brazil and Argentina), Middle East and Africa (Saudi Arabia, UAE, and South Africa), and Rest of World (ROW)

Sustainable Fabrics Market Analysis, Size, and Forecast 2026-2030:
APAC (China, India, and Japan), Europe (Germany, France, and Italy), North America (US, Canada, and Mexico), South America (Brazil and Argentina), Middle East and Africa (Saudi Arabia, UAE, and South Africa), and Rest of World (ROW)

Published: Apr 2026 299 Pages SKU: IRTNTR76376

Market Overview at a Glance

$29.29 B
Market Opportunity
8.2%
CAGR 2025 - 2030
43.4%
APAC Growth
$23.48 B
Regenerated segment 2024

Sustainable Fabrics Market Size 2026-2030

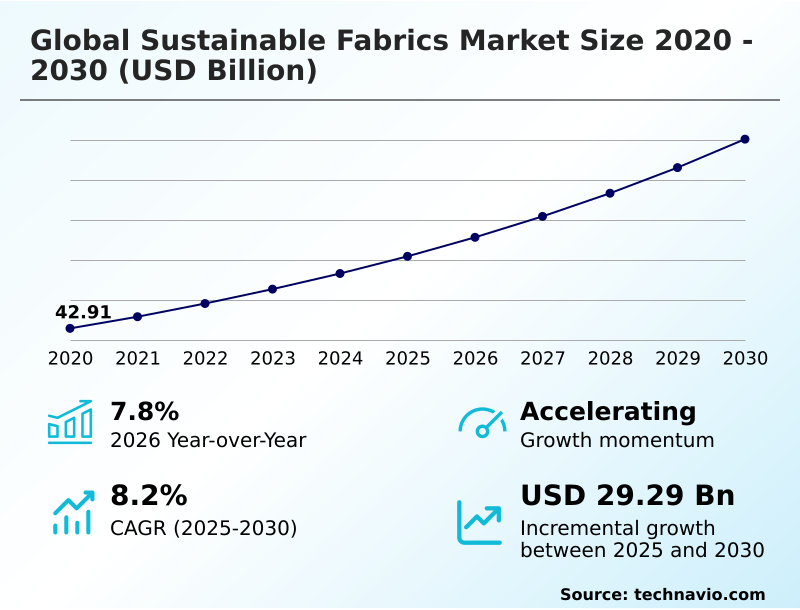
The sustainable fabrics market size is valued to increase by USD 29.29 billion, at a CAGR of 8.2% from 2025 to 2030. Intensified consumer demand for ethical and transparent production will drive the sustainable fabrics market.

Major Market Trends & Insights

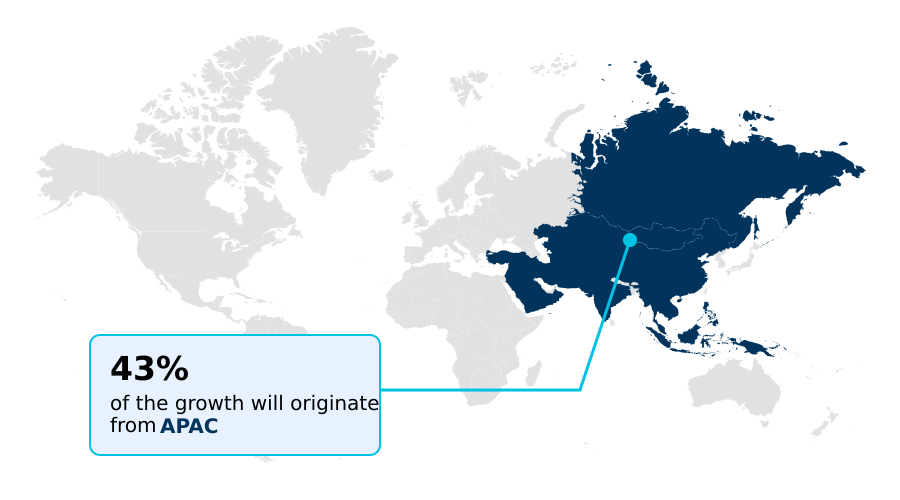
  • APAC dominated the market and accounted for a 43.4% growth during the forecast period.
  • By Product - Regenerated segment was valued at USD 23.48 billion in 2024
  • By Application - Textiles segment accounted for the largest market revenue share in 2024

Market Size & Forecast

  • Market Opportunities: USD 47.31 billion
  • Market Future Opportunities: USD 29.29 billion
  • CAGR from 2025 to 2030 : 8.2%

Market Summary

  • The sustainable fabrics market is undergoing a significant transformation, moving away from linear production models toward circular systems that prioritize resource efficiency and ecological responsibility. This shift is driven by heightened consumer awareness regarding environmental issues and a growing demand for transparency in material sourcing and manufacturing.
  • Key trends include the adoption of regenerative agriculture to cultivate natural fibers, advancements in bio-fabrication to create novel materials like mycelium-based leather, and the scaling of textile-to-textile recycling technologies. For instance, a global apparel brand could implement a blockchain-enabled traceability system to provide customers with verifiable data on a garment's journey from an organic cotton farm to the final product.
  • This not only meets regulatory requirements like the digital product passport but also builds consumer trust and differentiates the brand from competitors engaged in greenwashing. However, challenges such as the high cost of sustainable production, technological hurdles in recycling blended fabrics, and the prevalence of misleading environmental claims continue to shape the competitive landscape.

What will be the Size of the Sustainable Fabrics Market during the forecast period?

Get Key Insights on Market Forecast (PDF) Request Free Sample

How is the Sustainable Fabrics Market Segmented?

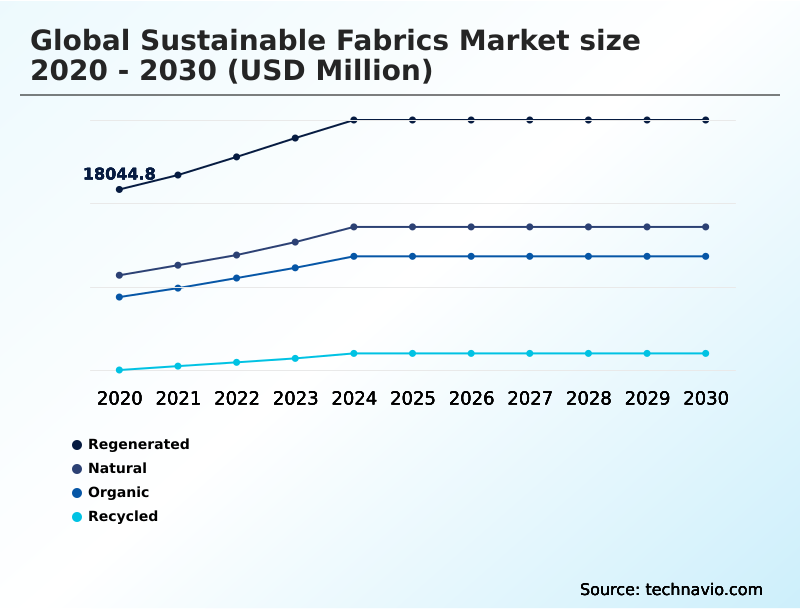
The sustainable fabrics industry research report provides comprehensive data (region-wise segment analysis), with forecasts and estimates in "USD million" for the period 2026-2030, as well as historical data from 2020-2024 for the following segments.

  • Product
    • Regenerated
    • Natural
    • Organic
    • Recycled
  • Application
    • Textiles
    • Household and furnishing
    • Medical
    • Others
  • Distribution channel
    • Indirect channel
    • Direct channel
  • Geography
    • APAC
      • China
      • India
      • Japan
    • Europe
      • Germany
      • France
      • Italy
    • North America
      • US
      • Canada
      • Mexico
    • South America
      • Brazil
      • Argentina
    • Middle East and Africa
      • Saudi Arabia
      • UAE
      • South Africa
    • Rest of World (ROW)

By Product Insights

The regenerated segment is estimated to witness significant growth during the forecast period.

The regenerated segment is a critical component of the sustainable fabrics market, centered on manmade cellulosic fibers engineered from botanical sources. This category, which includes materials derived from wood-based regenerated cellulose, represents a move toward high-performance, biodegradable materials.

Production relies on advanced material engineering, often using closed-loop systems where solvent recovery rates exceed 99%, significantly reducing environmental discharge.

The resulting botanic cellulosic fibers offer versatility, blending silk-like aesthetics with functional moisture management, making them suitable for both fashion and technical apparel.

As brands increasingly commit to circular economy models and seek to eliminate deforestation from supply chains, these advanced cellulosic fibers are positioned for continued expansion, helping divert post-consumer textile waste and create new bio-based textiles.

Request Free Sample

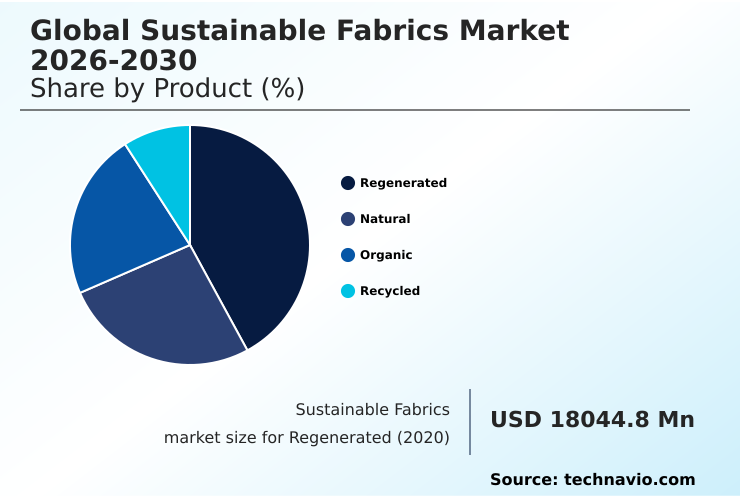
The Regenerated segment was valued at USD 23.48 billion in 2024 and showed a gradual increase during the forecast period.

Request Free Sample

Regional Analysis

APAC is estimated to contribute 43.4% to the growth of the global market during the forecast period.Technavio’s analysts have elaborately explained the regional trends and drivers that shape the market during the forecast period.

See How Sustainable Fabrics Market Demand is Rising in APAC Request Free Sample

The market in APAC is characterized by its dual role as both a major manufacturing hub and a region facing significant environmental pressures.

Accounting for 43.4% of the market's incremental growth, the region is pivotal in the global shift toward sustainability. A significant transformation is underway, driven by government policies and international brand requirements for eco-friendly manufacturing technologies.

Countries are increasingly focusing on sustainable raw materials, with an emphasis on organic cotton cultivation and innovations that promote soil health restoration.

For example, Vietnam's Eco-Fibre 2030 initiative is designed to help manufacturers adopt renewable energy and low-impact viscose production, targeting a 50% reduction in water consumption.

This transition reflects a broader regional ambition to move from low-cost production to high-value, sustainable manufacturing, incorporating closed-loop chemical process innovations.

Market Dynamics

Our researchers analyzed the data with 2025 as the base year, along with the key drivers, trends, and challenges. A holistic analysis of drivers will help companies refine their marketing strategies to gain a competitive advantage.

  • Strategic decision-making in the sustainable fabrics market is increasingly focused on specialized innovations and navigating a complex regulatory environment. The impact of regenerative agriculture on cotton is a central theme, as it directly influences raw material quality and supply chain resilience. Concurrently, the benefits of mycelium-based leather alternatives are being explored beyond fashion, entering sectors like automotive interiors.
  • However, significant challenges in commercial scale textile recycling persist, particularly concerning the circular economy for blended fabrics. Advancements in chemical recycling of polyester, including methanolysis for post-consumer textiles and enzymatic recycling for nylon 6,6, are crucial for progress. The role of blockchain in supply chain transparency is becoming non-negotiable, reinforced by mandates like the digital product passport for textiles.
  • Firms leveraging blockchain for this purpose report that stakeholder engagement metrics are twice as high as those relying on traditional certification alone. This technological integration is vital, as is the development of pfas-free coatings for home textiles and the effectiveness of waterless dyeing technologies.
  • As the market matures, understanding the nuances between mechanical vs chemical textile recycling and the future of bio-fabricated silk materials will be key to maintaining a competitive edge.

What are the key market drivers leading to the rise in the adoption of Sustainable Fabrics Industry?

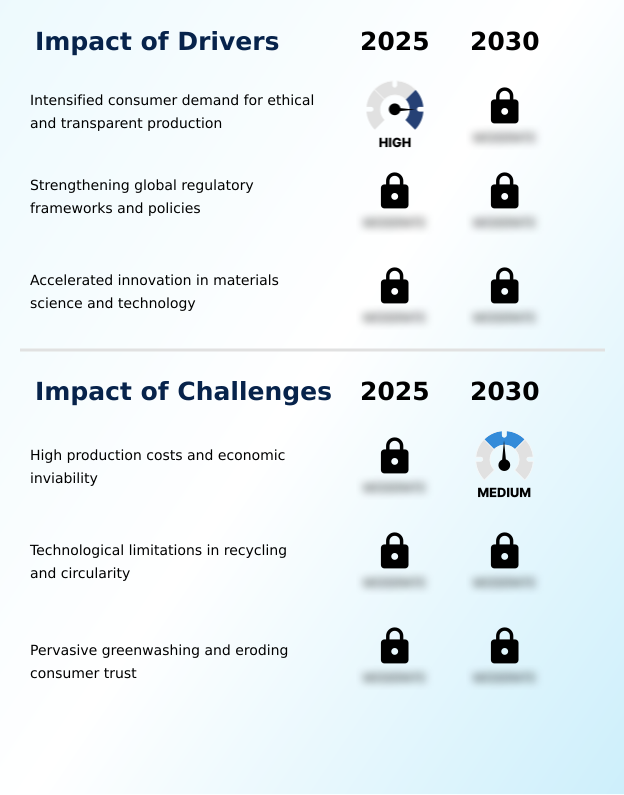
  • Intensified consumer demand for ethical practices and production transparency is a primary driver for the sustainable fabrics market.

  • Regulatory mandates and evolving consumer expectations are the primary drivers compelling market transformation. Forthcoming policies, such as the European Union's digital product passport, are institutionalizing the need for radical supply chain traceability.
  • This is accelerating the adoption of blockchain-enabled traceability systems that provide verifiable proof of fair-trade origins and compliance with ethical production standards.
  • Data shows that 72% of younger consumers actively prioritize brands offering this level of transparency, making it a critical tool to combat greenwashing detection.
  • Concurrently, regulations mandating a 40% reduction in greenhouse gas emissions are pushing manufacturers toward innovations like waterless dyeing technologies to lower their carbon footprint.
  • Adherence to strict GOTS certification criteria is also becoming a baseline requirement for market access in key regions.

What are the market trends shaping the Sustainable Fabrics Industry?

  • The increasing focus on regenerative agriculture and the emergence of advanced bio-fabricated materials represent a pivotal market trend, steering the industry toward net-positive environmental outcomes.

  • Key market trends are centered on the commercialization of next-generation materials and circular systems. The rise of bio-fabrication is introducing novel material categories, such as mycelium-based leather, while advanced material engineering is improving the performance of existing bio-based textiles. A significant focus is on scaling textile-to-textile recycling through sophisticated chemical recycling technologies.
  • Advanced facilities using methanolysis technology are now capable of processing over 100,000 metric tons of post-consumer textile waste annually, creating high-quality recycled PET yarns. These processes achieve virgin-equivalent quality, marking a 25% improvement over the fiber degradation common in mechanical recycling methods.
  • This progress is fundamental to establishing viable circular economy models that can effectively manage the vast streams of post-consumer textile waste.

What challenges does the Sustainable Fabrics Industry face during its growth?

  • High production costs and the challenge of achieving economic viability for sustainable fabrics remain a significant restraint on widespread market adoption.

  • Significant technical and economic challenges hinder the widespread adoption of circular practices in the market. The primary obstacle is the difficulty of blended fabric processing, as most current systems cannot efficiently separate mixed fibers for high-value recycling.
  • While emerging solutions like AI-powered near-infrared spectroscopy show promise, automated sorting facilities still struggle to achieve the 95% purity rate essential for high-quality chemical recycling. Furthermore, the high cost of advanced processes like enzymatic recycling and molecular regeneration process remains a barrier to scalability. Ensuring chemical safety compliance and developing durable pfas-free coatings adds another layer of complexity and expense.
  • These factors contribute to a price premium of up to 20% for sustainable textiles, impacting their competitiveness against conventional materials and challenging the industry's transition to low-impact manufacturing.

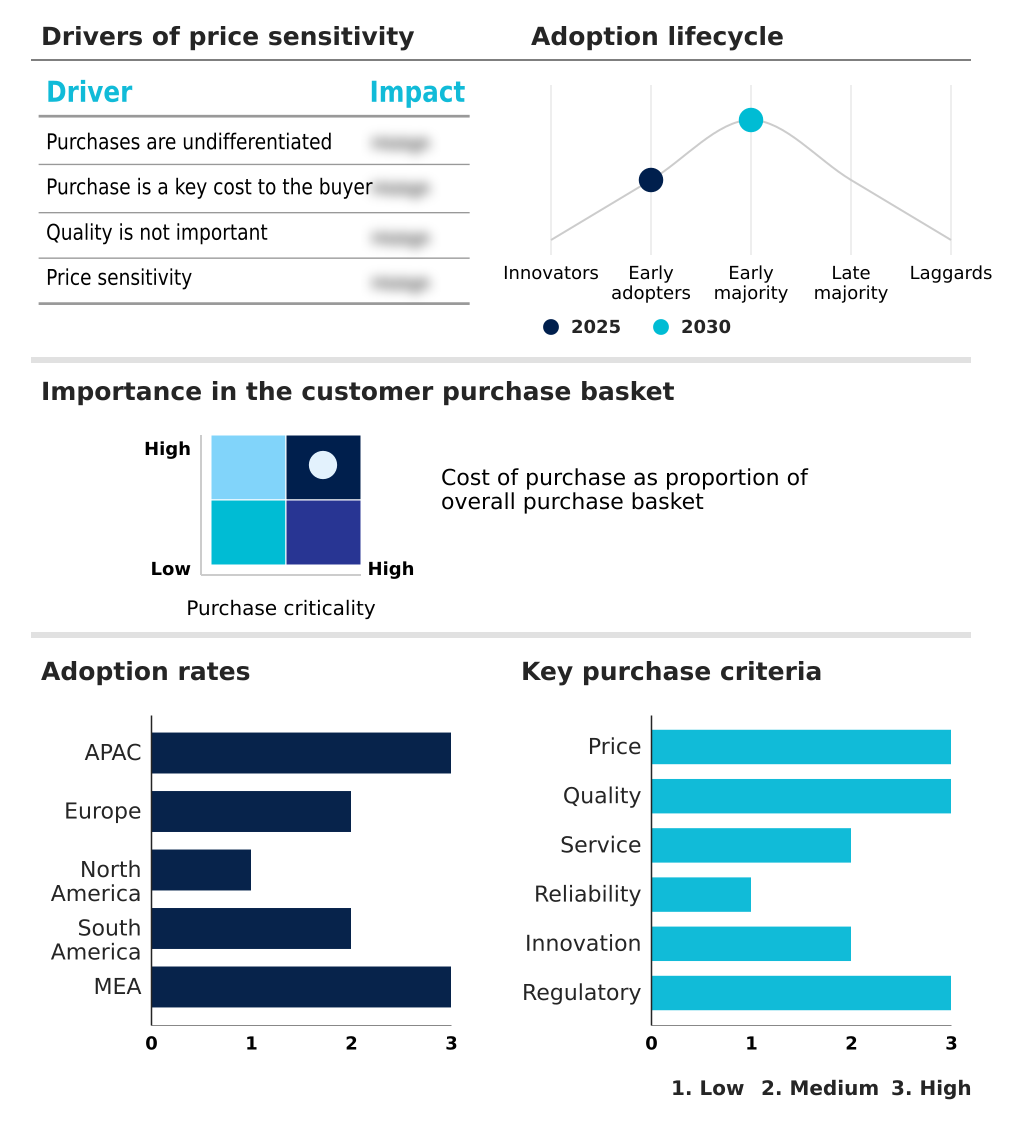
Exclusive Technavio Analysis on Customer Landscape

The sustainable fabrics market forecasting report includes the adoption lifecycle of the market, covering from the innovator’s stage to the laggard’s stage. It focuses on adoption rates in different regions based on penetration. Furthermore, the sustainable fabrics market report also includes key purchase criteria and drivers of price sensitivity to help companies evaluate and develop their market growth analysis strategies.

Customer Landscape of Sustainable Fabrics Industry

Competitive Landscape

Companies are implementing various strategies, such as strategic alliances, sustainable fabrics market forecast, partnerships, mergers and acquisitions, geographical expansion, and product/service launches, to enhance their presence in the industry.

A and A Eco Products - Specializes in wood-based regenerated cellulose textiles, offering botanic cellulosic fibers like TENCEL lyocell and modal fabrics derived from sustainable wood sources.

The industry research and growth report includes detailed analyses of the competitive landscape of the market and information about key companies, including:

  • A and A Eco Products
  • Anuprerna Artisan Alliance Pvt. Ltd.
  • China Bambro Textile Co. Ltd.
  • Elevate Textiles Inc.
  • Five P venture India Pvt. Ltd.
  • Hyosung TNC Corp.
  • JCraftEco
  • Lenzing AG
  • lululemon athletica Inc.
  • Modern Crew
  • MycoWorks
  • Net Paradigm India Pvt. Ltd.
  • Rawganique USA
  • Shanghai Tenbro Bamboo Textile
  • Siyaram Silk Mills Ltd.
  • Symphony Fabrics
  • Teijin Ltd.
  • The Yarn Guru India Inc.
  • Unifi Inc.
  • Vivify Textiles

Qualitative and quantitative analysis of companies has been conducted to help clients understand the wider business environment as well as the strengths and weaknesses of key industry players. Data is qualitatively analyzed to categorize companies as pure play, category-focused, industry-focused, and diversified; it is quantitatively analyzed to categorize companies as dominant, leading, strong, tentative, and weak.

Recent Development and News in Sustainable fabrics market

  • In September, 2025, the Global Organic Textile Standard (GOTS) released Version 8.0 of its certification, introducing mandatory social criteria and enhanced water management protocols for organic processing facilities.
  • In June, 2025, Oracle, in partnership with the Global Apparel Alliance, launched its FibreTrace platform, using blockchain and AI to trace certified organic cotton from farm to retail.
  • In May, 2025, the European Union passed the Sustainable Textiles Regulation, establishing strict rules for hazardous chemicals and mandating a 40% reduction in greenhouse gas emissions by 2030.
  • In March, 2025, MycoVero announced a partnership with luxury automotive group InterAero to supply its M-LETHR, a mycelium-based leather, for the interiors of their 2026 electric vehicle line.

Dive into Technavio’s robust research methodology, blending expert interviews, extensive data synthesis, and validated models for unparalleled Sustainable Fabrics Market insights. See full methodology.

Market Scope
Page number 299
Base year 2025
Historic period 2020-2024
Forecast period 2026-2030
Growth momentum & CAGR Accelerate at a CAGR of 8.2%
Market growth 2026-2030 USD 29289.4 million
Market structure Fragmented
YoY growth 2025-2026(%) 7.8%
Key countries China, India, Japan, South Korea, Indonesia, Australia, Germany, France, Italy, UK, Spain, The Netherlands, US, Canada, Mexico, Brazil, Argentina, Chile, Saudi Arabia, UAE, South Africa, Egypt and Israel
Competitive landscape Leading Companies, Market Positioning of Companies, Competitive Strategies, and Industry Risks

Request Free Sample

Research Analyst Overview

  • The sustainable fabrics market is evolving from niche applications to a mainstream industrial imperative, driven by technological and regulatory convergence. The integration of bio-fabrication, including mycelium-based leather and other biodegradable materials, is compelling businesses to rethink material science and R&D investments. Boardroom-level strategies are now centered on achieving circularity through advanced textile-to-textile recycling and closed-loop chemical process manufacturing.
  • Innovations in chemical recycling technologies, such as molecular regeneration process and enzymatic recycling, are critical for processing blended fabrics. For example, companies pioneering these methods have reported a 20% improvement in material performance consistency over traditional mechanical recycling.
  • This progress is essential for meeting forthcoming mandates like the digital product passport, which demands blockchain-enabled traceability and verifiable data on manmade cellulosic fibers. As the industry scales waterless dyeing technologies and adopts GOTS certification criteria, the focus on creating pfas-free coatings and low-impact viscose will define market leadership.

What are the Key Data Covered in this Sustainable Fabrics Market Research and Growth Report?

  • What is the expected growth of the Sustainable Fabrics Market between 2026 and 2030?

    • USD 29.29 billion, at a CAGR of 8.2%

  • What segmentation does the market report cover?

    • The report is segmented by Product (Regenerated, Natural, Organic, and Recycled), Application (Textiles, Household and furnishing, Medical, and Others), Distribution Channel (Indirect channel, and Direct channel) and Geography (APAC, Europe, North America, South America, Middle East and Africa)

  • Which regions are analyzed in the report?

    • APAC, Europe, North America, South America and Middle East and Africa

  • What are the key growth drivers and market challenges?

    • Intensified consumer demand for ethical and transparent production, High production costs and economic inviability

  • Who are the major players in the Sustainable Fabrics Market?

    • A and A Eco Products, Anuprerna Artisan Alliance Pvt. Ltd., China Bambro Textile Co. Ltd., Elevate Textiles Inc., Five P venture India Pvt. Ltd., Hyosung TNC Corp., JCraftEco, Lenzing AG, lululemon athletica Inc., Modern Crew, MycoWorks, Net Paradigm India Pvt. Ltd., Rawganique USA, Shanghai Tenbro Bamboo Textile, Siyaram Silk Mills Ltd., Symphony Fabrics, Teijin Ltd., The Yarn Guru India Inc., Unifi Inc. and Vivify Textiles

Market Research Insights

  • The market is defined by a dynamic shift toward circular economy models, where advanced material engineering and ethical production standards are paramount. This transition is fueled by intense consumer demand for supply chain traceability and verifiable fair-trade origins. Companies implementing transparent sourcing, often through digital platforms, report a 15% increase in consumer trust metrics, directly impacting brand loyalty.
  • Furthermore, the adoption of low-impact manufacturing processes and a focus on carbon footprint reduction are becoming critical differentiators. Businesses leveraging these strategies not only mitigate regulatory risks but also achieve operational efficiencies, with some firms reducing material input costs by up to 30% by integrating post-consumer textile waste into their production cycles.
  • The ability to navigate greenwashing detection and adhere to stringent chemical safety compliance is essential for sustained market participation.

We can help! Our analysts can customize this sustainable fabrics market research report to meet your requirements.

Get in touch

1. Executive Summary

1.1 Market overview

Executive Summary - Chart on Market Overview
Executive Summary - Data Table on Market Overview
Executive Summary - Chart on Global Market Characteristics
Executive Summary - Chart on Market by Geography
Executive Summary - Chart on Market Segmentation by Product
Executive Summary - Chart on Market Segmentation by Application
Executive Summary - Chart on Market Segmentation by Distribution Channel
Executive Summary - Chart on Incremental Growth
Executive Summary - Data Table on Incremental Growth
Executive Summary - Chart on Company Market Positioning

2. Technavio Analysis

2.1 Analysis of price sensitivity, lifecycle, customer purchase basket, adoption rates, and purchase criteria

2.2 Criticality of inputs and Factors of differentiation

Chart on Overview on criticality of inputs and factors of differentiation

2.3 Factors of disruption

Chart on Overview on factors of disruption

2.4 Impact of drivers and challenges

Chart on Impact of drivers and challenges in 2025 and 2030

3. Market Landscape

3.1 Market ecosystem

Chart on Parent Market
Data Table on - Parent Market

3.2 Market characteristics

Chart on Market characteristics analysis

3.3 Value chain analysis

Chart on Value chain analysis

4. Market Sizing

4.1 Market definition

Data Table on Offerings of companies included in the market definition

4.2 Market segment analysis

Market segments

4.3 Market size 2025

4.4 Market outlook: Forecast for 2025-2030

Chart on Global - Market size and forecast 2025-2030 ($ million)
Data Table on Global - Market size and forecast 2025-2030 ($ million)
Chart on Global Market: Year-over-year growth 2025-2030 (%)
Data Table on Global Market: Year-over-year growth 2025-2030 (%)

5. Historic Market Size

5.1 Global Sustainable Fabrics Market 2020 - 2024

Historic Market Size - Data Table on Global Sustainable Fabrics Market 2020 - 2024 ($ million)

5.2 Product segment analysis 2020 - 2024

Historic Market Size - Product Segment 2020 - 2024 ($ million)

5.3 Application segment analysis 2020 - 2024

Historic Market Size - Application Segment 2020 - 2024 ($ million)

5.4 Distribution Channel segment analysis 2020 - 2024

Historic Market Size - Distribution Channel Segment 2020 - 2024 ($ million)

5.5 Geography segment analysis 2020 - 2024

Historic Market Size - Geography Segment 2020 - 2024 ($ million)

5.6 Country segment analysis 2020 - 2024

Historic Market Size - Country Segment 2020 - 2024 ($ million)

6. Qualitative Analysis

6.1 Impact of AI on Global Sustainable Fabrics Market

6.2 Impact of Geopolitical Conflicts on Global Sustainable Fabrics Market

7. Five Forces Analysis

7.1 Five forces summary

Five forces analysis - Comparison between 2025 and 2030

7.2 Bargaining power of buyers

Bargaining power of buyers - Impact of key factors 2025 and 2030

7.3 Bargaining power of suppliers

Bargaining power of suppliers - Impact of key factors in 2025 and 2030

7.4 Threat of new entrants

Threat of new entrants - Impact of key factors in 2025 and 2030

7.5 Threat of substitutes

Threat of substitutes - Impact of key factors in 2025 and 2030

7.6 Threat of rivalry

Threat of rivalry - Impact of key factors in 2025 and 2030

7.7 Market condition

Chart on Market condition - Five forces 2025 and 2030

8. Market Segmentation by Product

8.1 Market segments

Chart on Product - Market share 2025-2030 (%)
Data Table on Product - Market share 2025-2030 (%)

8.2 Comparison by Product

Chart on Comparison by Product
Data Table on Comparison by Product

8.3 Regenerated - Market size and forecast 2025-2030

Chart on Regenerated - Market size and forecast 2025-2030 ($ million)
Data Table on Regenerated - Market size and forecast 2025-2030 ($ million)
Chart on Regenerated - Year-over-year growth 2025-2030 (%)
Data Table on Regenerated - Year-over-year growth 2025-2030 (%)

8.4 Natural - Market size and forecast 2025-2030

Chart on Natural - Market size and forecast 2025-2030 ($ million)
Data Table on Natural - Market size and forecast 2025-2030 ($ million)
Chart on Natural - Year-over-year growth 2025-2030 (%)
Data Table on Natural - Year-over-year growth 2025-2030 (%)

8.5 Organic - Market size and forecast 2025-2030

Chart on Organic - Market size and forecast 2025-2030 ($ million)
Data Table on Organic - Market size and forecast 2025-2030 ($ million)
Chart on Organic - Year-over-year growth 2025-2030 (%)
Data Table on Organic - Year-over-year growth 2025-2030 (%)

8.6 Recycled - Market size and forecast 2025-2030

Chart on Recycled - Market size and forecast 2025-2030 ($ million)
Data Table on Recycled - Market size and forecast 2025-2030 ($ million)
Chart on Recycled - Year-over-year growth 2025-2030 (%)
Data Table on Recycled - Year-over-year growth 2025-2030 (%)

8.7 Market opportunity by Product

Market opportunity by Product ($ million)
Data Table on Market opportunity by Product ($ million)

9. Market Segmentation by Application

9.1 Market segments

Chart on Application - Market share 2025-2030 (%)
Data Table on Application - Market share 2025-2030 (%)

9.2 Comparison by Application

Chart on Comparison by Application
Data Table on Comparison by Application

9.3 Textiles - Market size and forecast 2025-2030

Chart on Textiles - Market size and forecast 2025-2030 ($ million)
Data Table on Textiles - Market size and forecast 2025-2030 ($ million)
Chart on Textiles - Year-over-year growth 2025-2030 (%)
Data Table on Textiles - Year-over-year growth 2025-2030 (%)

9.4 Household and furnishing - Market size and forecast 2025-2030

Chart on Household and furnishing - Market size and forecast 2025-2030 ($ million)
Data Table on Household and furnishing - Market size and forecast 2025-2030 ($ million)
Chart on Household and furnishing - Year-over-year growth 2025-2030 (%)
Data Table on Household and furnishing - Year-over-year growth 2025-2030 (%)

9.5 Medical - Market size and forecast 2025-2030

Chart on Medical - Market size and forecast 2025-2030 ($ million)
Data Table on Medical - Market size and forecast 2025-2030 ($ million)
Chart on Medical - Year-over-year growth 2025-2030 (%)
Data Table on Medical - Year-over-year growth 2025-2030 (%)

9.6 Others - Market size and forecast 2025-2030

Chart on Others - Market size and forecast 2025-2030 ($ million)
Data Table on Others - Market size and forecast 2025-2030 ($ million)
Chart on Others - Year-over-year growth 2025-2030 (%)
Data Table on Others - Year-over-year growth 2025-2030 (%)

9.7 Market opportunity by Application

Market opportunity by Application ($ million)
Data Table on Market opportunity by Application ($ million)

10. Market Segmentation by Distribution Channel

10.1 Market segments

Chart on Distribution Channel - Market share 2025-2030 (%)
Data Table on Distribution Channel - Market share 2025-2030 (%)

10.2 Comparison by Distribution Channel

Chart on Comparison by Distribution Channel
Data Table on Comparison by Distribution Channel

10.3 Indirect channel - Market size and forecast 2025-2030

Chart on Indirect channel - Market size and forecast 2025-2030 ($ million)
Data Table on Indirect channel - Market size and forecast 2025-2030 ($ million)
Chart on Indirect channel - Year-over-year growth 2025-2030 (%)
Data Table on Indirect channel - Year-over-year growth 2025-2030 (%)

10.4 Direct channel - Market size and forecast 2025-2030

Chart on Direct channel - Market size and forecast 2025-2030 ($ million)
Data Table on Direct channel - Market size and forecast 2025-2030 ($ million)
Chart on Direct channel - Year-over-year growth 2025-2030 (%)
Data Table on Direct channel - Year-over-year growth 2025-2030 (%)

10.5 Market opportunity by Distribution Channel

Market opportunity by Distribution Channel ($ million)
Data Table on Market opportunity by Distribution Channel ($ million)

11. Customer Landscape

11.1 Customer landscape overview

Analysis of price sensitivity, lifecycle, customer purchase basket, adoption rates, and purchase criteria

12. Geographic Landscape

12.1 Geographic segmentation

Chart on Market share by geography 2025-2030 (%)
Data Table on Market share by geography 2025-2030 (%)

12.2 Geographic comparison

Chart on Geographic comparison
Data Table on Geographic comparison

12.3 APAC - Market size and forecast 2025-2030

Chart on APAC - Market size and forecast 2025-2030 ($ million)
Data Table on APAC - Market size and forecast 2025-2030 ($ million)
Chart on APAC - Year-over-year growth 2025-2030 (%)
Data Table on APAC - Year-over-year growth 2025-2030 (%)
Chart on Regional Comparison - APAC
Data Table on Regional Comparison - APAC

12.3.1 China - Market size and forecast 2025-2030

Chart on China - Market size and forecast 2025-2030 ($ million)
Data Table on China - Market size and forecast 2025-2030 ($ million)
Chart on China - Year-over-year growth 2025-2030 (%)
Data Table on China - Year-over-year growth 2025-2030 (%)

12.3.2 India - Market size and forecast 2025-2030

Chart on India - Market size and forecast 2025-2030 ($ million)
Data Table on India - Market size and forecast 2025-2030 ($ million)
Chart on India - Year-over-year growth 2025-2030 (%)
Data Table on India - Year-over-year growth 2025-2030 (%)

12.3.3 Japan - Market size and forecast 2025-2030

Chart on Japan - Market size and forecast 2025-2030 ($ million)
Data Table on Japan - Market size and forecast 2025-2030 ($ million)
Chart on Japan - Year-over-year growth 2025-2030 (%)
Data Table on Japan - Year-over-year growth 2025-2030 (%)

12.3.4 South Korea - Market size and forecast 2025-2030

Chart on South Korea - Market size and forecast 2025-2030 ($ million)
Data Table on South Korea - Market size and forecast 2025-2030 ($ million)
Chart on South Korea - Year-over-year growth 2025-2030 (%)
Data Table on South Korea - Year-over-year growth 2025-2030 (%)

12.3.5 Indonesia - Market size and forecast 2025-2030

Chart on Indonesia - Market size and forecast 2025-2030 ($ million)
Data Table on Indonesia - Market size and forecast 2025-2030 ($ million)
Chart on Indonesia - Year-over-year growth 2025-2030 (%)
Data Table on Indonesia - Year-over-year growth 2025-2030 (%)

12.3.6 Australia - Market size and forecast 2025-2030

Chart on Australia - Market size and forecast 2025-2030 ($ million)
Data Table on Australia - Market size and forecast 2025-2030 ($ million)
Chart on Australia - Year-over-year growth 2025-2030 (%)
Data Table on Australia - Year-over-year growth 2025-2030 (%)

12.4 Europe - Market size and forecast 2025-2030

Chart on Europe - Market size and forecast 2025-2030 ($ million)
Data Table on Europe - Market size and forecast 2025-2030 ($ million)
Chart on Europe - Year-over-year growth 2025-2030 (%)
Data Table on Europe - Year-over-year growth 2025-2030 (%)
Chart on Regional Comparison - Europe
Data Table on Regional Comparison - Europe

12.4.1 Germany - Market size and forecast 2025-2030

Chart on Germany - Market size and forecast 2025-2030 ($ million)
Data Table on Germany - Market size and forecast 2025-2030 ($ million)
Chart on Germany - Year-over-year growth 2025-2030 (%)
Data Table on Germany - Year-over-year growth 2025-2030 (%)

12.4.2 France - Market size and forecast 2025-2030

Chart on France - Market size and forecast 2025-2030 ($ million)
Data Table on France - Market size and forecast 2025-2030 ($ million)
Chart on France - Year-over-year growth 2025-2030 (%)
Data Table on France - Year-over-year growth 2025-2030 (%)

12.4.3 Italy - Market size and forecast 2025-2030

Chart on Italy - Market size and forecast 2025-2030 ($ million)
Data Table on Italy - Market size and forecast 2025-2030 ($ million)
Chart on Italy - Year-over-year growth 2025-2030 (%)
Data Table on Italy - Year-over-year growth 2025-2030 (%)

12.4.4 UK - Market size and forecast 2025-2030

Chart on UK - Market size and forecast 2025-2030 ($ million)
Data Table on UK - Market size and forecast 2025-2030 ($ million)
Chart on UK - Year-over-year growth 2025-2030 (%)
Data Table on UK - Year-over-year growth 2025-2030 (%)

12.4.5 Spain - Market size and forecast 2025-2030

Chart on Spain - Market size and forecast 2025-2030 ($ million)
Data Table on Spain - Market size and forecast 2025-2030 ($ million)
Chart on Spain - Year-over-year growth 2025-2030 (%)
Data Table on Spain - Year-over-year growth 2025-2030 (%)

12.4.6 The Netherlands - Market size and forecast 2025-2030

Chart on The Netherlands - Market size and forecast 2025-2030 ($ million)
Data Table on The Netherlands - Market size and forecast 2025-2030 ($ million)
Chart on The Netherlands - Year-over-year growth 2025-2030 (%)
Data Table on The Netherlands - Year-over-year growth 2025-2030 (%)

12.5 North America - Market size and forecast 2025-2030

Chart on North America - Market size and forecast 2025-2030 ($ million)
Data Table on North America - Market size and forecast 2025-2030 ($ million)
Chart on North America - Year-over-year growth 2025-2030 (%)
Data Table on North America - Year-over-year growth 2025-2030 (%)
Chart on Regional Comparison - North America
Data Table on Regional Comparison - North America

12.5.1 US - Market size and forecast 2025-2030

Chart on US - Market size and forecast 2025-2030 ($ million)
Data Table on US - Market size and forecast 2025-2030 ($ million)
Chart on US - Year-over-year growth 2025-2030 (%)
Data Table on US - Year-over-year growth 2025-2030 (%)

12.5.2 Canada - Market size and forecast 2025-2030

Chart on Canada - Market size and forecast 2025-2030 ($ million)
Data Table on Canada - Market size and forecast 2025-2030 ($ million)
Chart on Canada - Year-over-year growth 2025-2030 (%)
Data Table on Canada - Year-over-year growth 2025-2030 (%)

12.5.3 Mexico - Market size and forecast 2025-2030

Chart on Mexico - Market size and forecast 2025-2030 ($ million)
Data Table on Mexico - Market size and forecast 2025-2030 ($ million)
Chart on Mexico - Year-over-year growth 2025-2030 (%)
Data Table on Mexico - Year-over-year growth 2025-2030 (%)

12.6 South America - Market size and forecast 2025-2030

Chart on South America - Market size and forecast 2025-2030 ($ million)
Data Table on South America - Market size and forecast 2025-2030 ($ million)
Chart on South America - Year-over-year growth 2025-2030 (%)
Data Table on South America - Year-over-year growth 2025-2030 (%)
Chart on Regional Comparison - South America
Data Table on Regional Comparison - South America

12.6.1 Brazil - Market size and forecast 2025-2030

Chart on Brazil - Market size and forecast 2025-2030 ($ million)
Data Table on Brazil - Market size and forecast 2025-2030 ($ million)
Chart on Brazil - Year-over-year growth 2025-2030 (%)
Data Table on Brazil - Year-over-year growth 2025-2030 (%)

12.6.2 Argentina - Market size and forecast 2025-2030

Chart on Argentina - Market size and forecast 2025-2030 ($ million)
Data Table on Argentina - Market size and forecast 2025-2030 ($ million)
Chart on Argentina - Year-over-year growth 2025-2030 (%)
Data Table on Argentina - Year-over-year growth 2025-2030 (%)

12.6.3 Chile - Market size and forecast 2025-2030

Chart on Chile - Market size and forecast 2025-2030 ($ million)
Data Table on Chile - Market size and forecast 2025-2030 ($ million)
Chart on Chile - Year-over-year growth 2025-2030 (%)
Data Table on Chile - Year-over-year growth 2025-2030 (%)

12.7 Middle East and Africa - Market size and forecast 2025-2030

Chart on Middle East and Africa - Market size and forecast 2025-2030 ($ million)
Data Table on Middle East and Africa - Market size and forecast 2025-2030 ($ million)
Chart on Middle East and Africa - Year-over-year growth 2025-2030 (%)
Data Table on Middle East and Africa - Year-over-year growth 2025-2030 (%)
Chart on Regional Comparison - Middle East and Africa
Data Table on Regional Comparison - Middle East and Africa

12.7.1 Saudi Arabia - Market size and forecast 2025-2030

Chart on Saudi Arabia - Market size and forecast 2025-2030 ($ million)
Data Table on Saudi Arabia - Market size and forecast 2025-2030 ($ million)
Chart on Saudi Arabia - Year-over-year growth 2025-2030 (%)
Data Table on Saudi Arabia - Year-over-year growth 2025-2030 (%)

12.7.2 UAE - Market size and forecast 2025-2030

Chart on UAE - Market size and forecast 2025-2030 ($ million)
Data Table on UAE - Market size and forecast 2025-2030 ($ million)
Chart on UAE - Year-over-year growth 2025-2030 (%)
Data Table on UAE - Year-over-year growth 2025-2030 (%)

12.7.3 South Africa - Market size and forecast 2025-2030

Chart on South Africa - Market size and forecast 2025-2030 ($ million)
Data Table on South Africa - Market size and forecast 2025-2030 ($ million)
Chart on South Africa - Year-over-year growth 2025-2030 (%)
Data Table on South Africa - Year-over-year growth 2025-2030 (%)

12.7.4 Egypt - Market size and forecast 2025-2030

Chart on Egypt - Market size and forecast 2025-2030 ($ million)
Data Table on Egypt - Market size and forecast 2025-2030 ($ million)
Chart on Egypt - Year-over-year growth 2025-2030 (%)
Data Table on Egypt - Year-over-year growth 2025-2030 (%)

12.7.5 Israel - Market size and forecast 2025-2030

Chart on Israel - Market size and forecast 2025-2030 ($ million)
Data Table on Israel - Market size and forecast 2025-2030 ($ million)
Chart on Israel - Year-over-year growth 2025-2030 (%)
Data Table on Israel - Year-over-year growth 2025-2030 (%)

12.8 Market opportunity by geography

Market opportunity by geography ($ million)
Data Tables on Market opportunity by geography ($ million)

13. Drivers, Challenges, and Opportunity

13.1 Market drivers

Intensified consumer demand for ethical and transparent production
Strengthening global regulatory frameworks and policies
Accelerated innovation in materials science and technology

13.2 Market challenges

High production costs and economic inviability
Technological limitations in recycling and circularity
Pervasive greenwashing and eroding consumer trust

13.3 Impact of drivers and challenges

Impact of drivers and challenges in 2025 and 2030

13.4 Market opportunities

Rise of regenerative and bio-fabricated materials
Hyper-transparency through digital supply chain integration
Commercial scaling of advanced textile-to-textile recycling

14. Competitive Landscape

14.1 Overview

14.2

Overview on criticality of inputs and factors of differentiation

14.3 Landscape disruption

Overview on factors of disruption

14.4 Industry risks

Impact of key risks on business

15. Competitive Analysis

15.1 Companies profiled

Companies covered

15.2 Company ranking index

15.3 Market positioning of companies

Matrix on companies position and classification

15.4 Anuprerna Artisan Alliance Pvt. Ltd.

Anuprerna Artisan Alliance Pvt. Ltd. - Overview
Anuprerna Artisan Alliance Pvt. Ltd. - Product / Service
Anuprerna Artisan Alliance Pvt. Ltd. - Key offerings
SWOT

15.5 China Bambro Textile Co. Ltd.

China Bambro Textile Co. Ltd. - Overview
China Bambro Textile Co. Ltd. - Product / Service
China Bambro Textile Co. Ltd. - Key offerings
SWOT

15.6 Elevate Textiles Inc.

Elevate Textiles Inc. - Overview
Elevate Textiles Inc. - Product / Service
Elevate Textiles Inc. - Key offerings
SWOT

15.7 Hyosung TNC Corp.

Hyosung TNC Corp. - Overview
Hyosung TNC Corp. - Business segments
Hyosung TNC Corp. - Key offerings
Hyosung TNC Corp. - Segment focus
SWOT

15.8 JCraftEco

JCraftEco - Overview
JCraftEco - Product / Service
JCraftEco - Key offerings
SWOT

15.9 Lenzing AG

Lenzing AG - Overview
Lenzing AG - Business segments
Lenzing AG - Key offerings
Lenzing AG - Segment focus
SWOT

15.10 lululemon athletica Inc.

lululemon athletica Inc. - Overview
lululemon athletica Inc. - Business segments
lululemon athletica Inc. - Key offerings
lululemon athletica Inc. - Segment focus
SWOT

15.11 Modern Crew

Modern Crew - Overview
Modern Crew - Product / Service
Modern Crew - Key offerings
SWOT

15.12 Net Paradigm India Pvt. Ltd.

Net Paradigm India Pvt. Ltd. - Overview
Net Paradigm India Pvt. Ltd. - Product / Service
Net Paradigm India Pvt. Ltd. - Key offerings
SWOT

15.13 Rawganique USA

Rawganique USA - Overview
Rawganique USA - Product / Service
Rawganique USA - Key offerings
SWOT

15.14 Siyaram Silk Mills Ltd.

Siyaram Silk Mills Ltd. - Overview
Siyaram Silk Mills Ltd. - Product / Service
Siyaram Silk Mills Ltd. - Key offerings
SWOT

15.15 Symphony Fabrics

Symphony Fabrics - Overview
Symphony Fabrics - Product / Service
Symphony Fabrics - Key offerings
SWOT

15.16 Teijin Ltd.

Teijin Ltd. - Overview
Teijin Ltd. - Business segments
Teijin Ltd. - Key offerings
Teijin Ltd. - Segment focus
SWOT

15.17 Unifi Inc.

Unifi Inc. - Overview
Unifi Inc. - Business segments
Unifi Inc. - Key offerings
Unifi Inc. - Segment focus
SWOT

15.18 Vivify Textiles

Vivify Textiles - Overview
Vivify Textiles - Product / Service
Vivify Textiles - Key offerings
SWOT

16. Appendix

16.1 Scope of the report

Market definition
Objectives
Notes and caveats

16.2 Inclusions and exclusions checklist

Inclusions checklist
Exclusions checklist

16.3 Currency conversion rates for US$

16.4 Research methodology

16.5 Data procurement

Information sources

16.6 Data validation

16.7 Validation techniques employed for market sizing

16.8 Data synthesis

16.9 360 degree market analysis

16.10 List of abbreviations

Research Methodology

Technavio presents a detailed picture of the market by way of study, synthesis, and summation of data from multiple sources. The analysts have presented the various facets of the market with a particular focus on identifying the key industry influencers. The data thus presented is comprehensive, reliable, and the result of extensive research, both primary and secondary.

INFORMATION SOURCES

Primary sources

  • Manufacturers and suppliers
  • Channel partners
  • Industry experts
  • Strategic decision makers

Secondary sources

  • Industry journals and periodicals
  • Government data
  • Financial reports of key industry players
  • Historical data
  • Press releases

DATA ANALYSIS

Data Synthesis

  • Collation of data
  • Estimation of key figures
  • Analysis of derived insights

Data Validation

  • Triangulation with data models
  • Reference against proprietary databases
  • Corroboration with industry experts

REPORT WRITING

Qualitative

  • Market drivers
  • Market challenges
  • Market trends
  • Five forces analysis

Quantitative

  • Market size and forecast
  • Market segmentation
  • Geographical insights
  • Competitive landscape

Interested in this report?

Get your sample now to see our research methodology and insights!

Download Now

Frequently Asked Questions

Sustainable Fabrics market growth will increase by USD 29289.4 million during 2026-2030.

The Sustainable Fabrics market is expected to grow at a CAGR of 8.2% during 2026-2030.

Sustainable Fabrics market is segmented by Product (Regenerated, Natural, Organic, Recycled) Application (Textiles, Household and furnishing, Medical, Others) Distribution channel (Indirect channel, Direct channel)

A and A Eco Products, Anuprerna Artisan Alliance Pvt. Ltd., China Bambro Textile Co. Ltd., Elevate Textiles Inc., Five P venture India Pvt. Ltd., Hyosung TNC Corp., JCraftEco, Lenzing AG, lululemon athletica Inc., Modern Crew, MycoWorks, Net Paradigm India Pvt. Ltd., Rawganique USA, Shanghai Tenbro Bamboo Textile, Siyaram Silk Mills Ltd., Symphony Fabrics, Teijin Ltd., The Yarn Guru India Inc., Unifi Inc., Vivify Textiles are a few of the key vendors in the Sustainable Fabrics market.

APAC will register the highest growth rate of 43.4% among the other regions. Therefore, the Sustainable Fabrics market in APAC is expected to garner significant business opportunities for the vendors during the forecast period.

China, India, Japan, South Korea, Indonesia, Australia, Germany, France, Italy, UK, Spain, The Netherlands, US, Canada, Mexico, Brazil, Argentina, Chile, Saudi Arabia, UAE, South Africa, Egypt, Israel

  • Intensified consumer demand for ethical and transparent production is the driving factor this market.

The Sustainable Fabrics market vendors should focus on grabbing business opportunities from the Product segment as it accounted for the largest market share in the base year.
RIA - Research AI Assistant
Ask RIA