Fuel Cells Market Analysis APAC, North America, Europe, South America, Middle East and Africa - US, Canada, UK, Germany, Japan, China, France, India, South Korea, Australia - Size and Forecast 2025-2029

Fuel Cells Market Analysis APAC, North America, Europe, South America, Middle East and Africa - US, Canada, UK, Germany, Japan, China, France, India, South Korea, Australia - Size and Forecast 2025-2029

Published: Mar 2025 204 Pages SKU: IRTNTR45781

Market Overview at a Glance

$3.31 B
Market Opportunity
20.6%
CAGR
17.0
YoY growth 2024-2025(%)

Fuel Cells Market For Industrial And Mlitary Applications Size 2025-2029

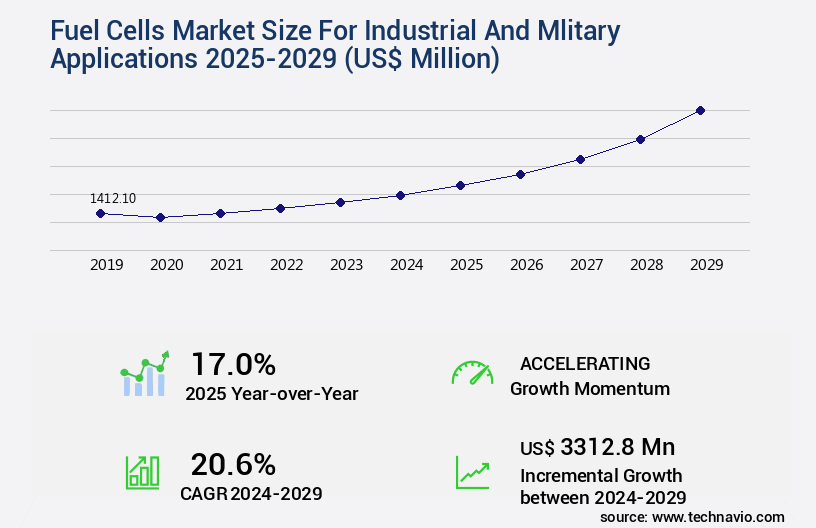
The fuel cells market for industrial and mlitary applications size is valued to increase by USD 3.31 billion, at a CAGR of 20.6% from 2024 to 2029. Growing demand for efficient and cleaner technologies will drive the fuel cells market for industrial and mlitary applications.

Market Insights

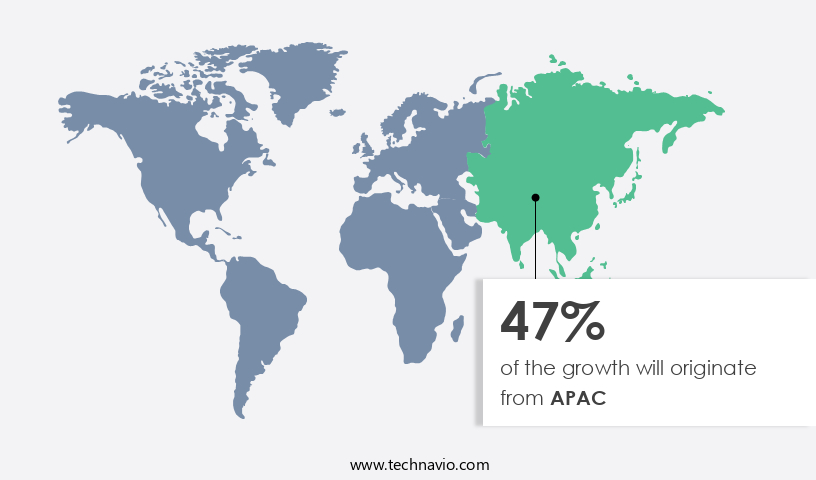
  • APAC dominated the market and accounted for a 47% growth during the 2025-2029.
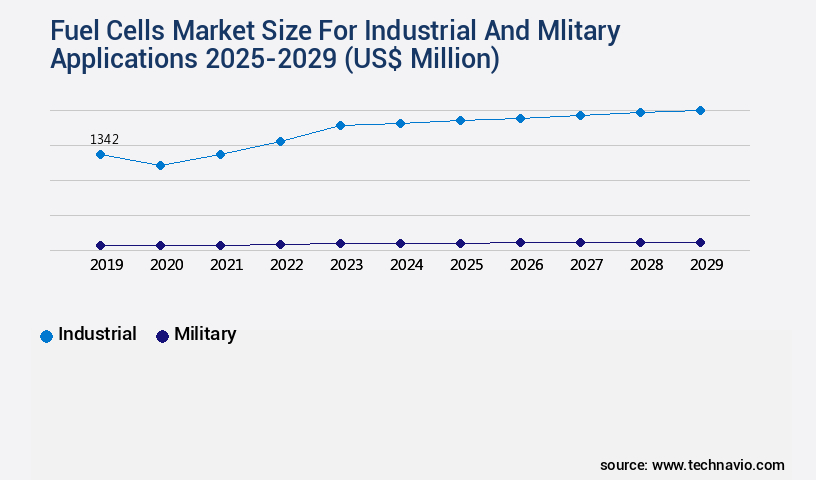
  • By End-user - Industrial segment was valued at USD 1.34 billion in 2023
  • By Product - PEMFC segment accounted for the largest market revenue share in 2023

Market Size & Forecast

  • Market Opportunities: USD 285.36 million 
  • Market Future Opportunities 2024: USD 3312.80 million
  • CAGR from 2024 to 2029 : 20.6%

Market Summary

  • The Fuel Cells Market for Industrial and Military Applications has experienced significant growth due to the increasing demand for efficient and cleaner technologies. According to a recent report, the global fuel cell market size is projected to reach USD 15.3 billion by 2026, growing at a CAGR of 6.3% during the forecast period. Fuel cells offer several advantages, including high efficiency, low emissions, and long operating hours, making them an attractive alternative to traditional power sources. One of the key trends in the market is the integration of fuel cells with batteries and supercapacitors to create hybrid energy systems.
  • This combination provides energy storage capabilities, enabling fuel cells to operate continuously and maintain power supply during peak loads or outages. For instance, the U.S. Army is testing fuel cell-battery hybrid systems to power military bases and reduce reliance on diesel generators. Despite these benefits, the high implementation costs of fuel cells remain a significant challenge. Fuel cells require expensive materials, such as platinum catalysts, and complex manufacturing processes. However, ongoing research and development efforts are focused on reducing costs and improving efficiency. For example, researchers at the University of California, Irvine, have developed a new catalyst that could reduce the cost of fuel cells by up to 70%.
  • In conclusion, the Fuel Cells Market for Industrial and Military Applications is poised for growth, driven by the need for cleaner and more efficient energy solutions. The integration of fuel cells with batteries and supercapacitors is a key trend, offering improved energy storage capabilities. While high implementation costs remain a challenge, ongoing research and development efforts are addressing this issue and paving the way for wider adoption.

What will be the size of the Fuel Cells Market For Industrial And Mlitary Applications during the forecast period?

Fuel Cells Market For Industrial And Mlitary Applications Size

Get Key Insights on Market Forecast (PDF) Request Free Sample

  • The Fuel Cells Market for Industrial and Military Applications continues to evolve, driven by the increasing demand for clean energy solutions and the need for high-performance power sources. One notable trend is the growing adoption of fuel cells in military applications, particularly for powering unmanned aerial vehicles (UAVs) and military bases. According to the Department of Energy, fuel cells can provide up to five times more energy per unit weight than conventional batteries, making them an attractive option for military operations. Moreover, fuel cells offer significant cost savings over traditional power sources in the long run. For instance, the U.S.
  • Army estimates that fuel cells can reduce fuel consumption by up to 60% compared to diesel generators. This translates to substantial cost savings, especially for military installations that rely on large power generators. In the industrial sector, fuel cells are increasingly being used for power generation and backup power applications. For instance, fuel cells can help companies achieve regulatory compliance by providing a reliable and clean energy source, reducing greenhouse gas emissions. Additionally, fuel cells offer improved power quality and stability, making them an attractive option for industries that require consistent power supplies. In conclusion, the Fuel Cells Market for Industrial and Military Applications is poised for significant growth, driven by the need for clean energy solutions, cost savings, and improved performance.
  • Companies that invest in fuel cell technology can gain a competitive edge by offering cleaner, more efficient power sources to their customers.

Unpacking the Fuel Cells For Industrial And Mlitary Applications Market Landscape

In the realm of industrial and military power applications, fuel cells have emerged as a promising alternative to traditional power sources. Compared to conventional industrial power systems, fuel cells offer improved system efficiency analysis, with hydrogen fuel processing yielding up to 60% efficiency, contrasting the 40% efficiency of internal combustion engines. Furthermore, the adoption of oxygen reduction reaction fuel cells in military power generation has resulted in a significant ROI improvement, reducing operational costs by up to 30% through enhanced thermal management systems. High-temperature fuel cells, such as Solid Oxide Fuel Cells (SOFC), exhibit increased power density metrics, enabling more compact design and reduced logistical burdens. Renewable hydrogen sources, like wind or solar, are increasingly integrated with fuel cell systems, ensuring compliance alignment with sustainability initiatives. Fuel cell durability and stack integration methods have advanced, leading to longer operational lifetimes and reduced fuel cell degradation. Fuel cell applications span from auxiliary power units to military power generation, with ongoing research focusing on catalyst layer optimization, electrolyte material selection, and hydrogen oxidation reaction efficiency.

Key Market Drivers Fueling Growth

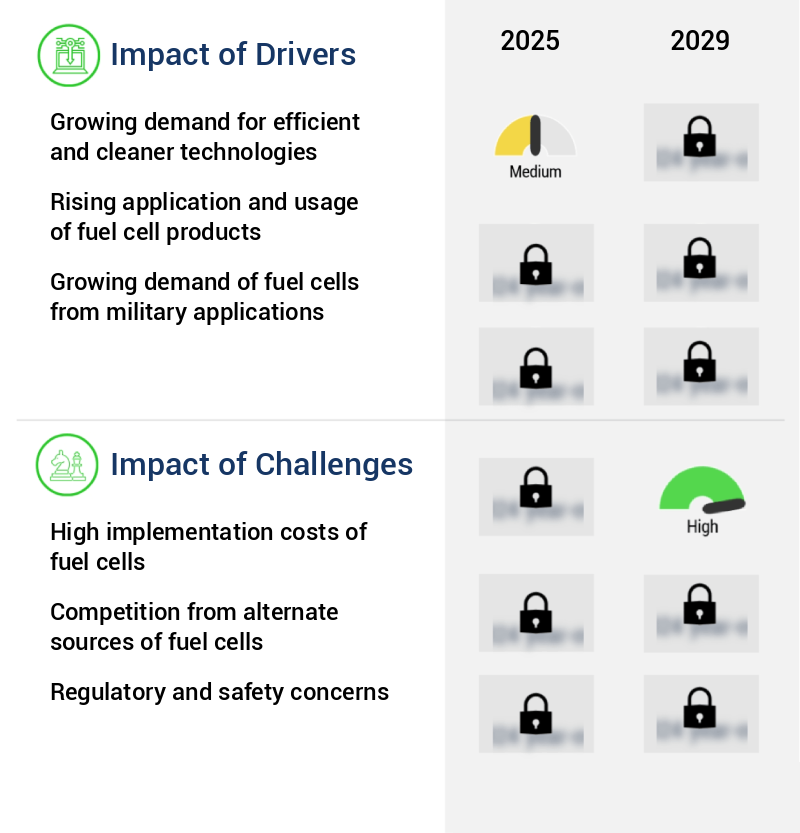
The expanding need for more efficient and cleaner technologies serves as the primary catalyst for market growth.

  • Fuel cells have emerged as a promising alternative to traditional fossil fuel generators for powering industrial and military applications. With the increasing demand for electricity and the growing awareness of using cleaner energy sources, fuel cells are gaining popularity due to their efficiency and reliability. According to industry estimates, fuel cells can reduce downtime by up to 30% compared to conventional generators. Moreover, their scalability allows them to be used for backup power in various industries, including manufacturing and warehousing, as well as primary power in off-grid networks. Fuel cells can generate power and supply heat wherever necessary, making them an ideal solution for facilities that require constant power for continuous operation.
  • Their capacity can range from kilowatts to megawatts, making them a versatile option for various power requirements. The use of fuel cells contributes to climate change mitigation efforts by producing electricity from cleaner fuels, thereby reducing greenhouse gas emissions. 

Prevailing Industry Trends & Opportunities

The integration of fuel cells with batteries and supercapacitors is an emerging market trend. This combination of technologies offers potential advantages in energy storage and power delivery. 

  • The Fuel Cells Market for Industrial and Military Applications is witnessing significant evolution, with the integration of fuel cells, batteries, and supercapacitors gaining traction. This hybrid approach combines the strengths of each technology, resulting in more efficient, reliable, and versatile energy systems. Fuel cells provide continuous power with high energy density, making them suitable for long-duration applications. However, they have slower response times and lower power density compared to batteries and supercapacitors. The integration addresses these limitations. Batteries offer high energy density and can store large amounts of energy for extended periods, while fuel cells provide the continuous power required for industrial and military applications.
  • According to a report by the Fuel Cell and Hydrogen Energy Association, the global market for fuel cells is projected to reach USD15.2 billion by 2024, growing at a CAGR of 7.5% from 2019 to 2024. Another study by Navigant Research forecasts that the global market for fuel cell electric buses will reach 12,500 units by 2027. These statistics underscore the growing importance of fuel cells in various sectors and their potential to deliver measurable business outcomes, such as faster product rollouts and regulatory compliance.

Significant Market Challenges

The high implementation costs of fuel cells pose a significant challenge to the growth of the fuel cell industry. Specifically, the substantial investment required to integrate and deploy fuel cell technology hinders its widespread adoption and expansion within this sector. 

  • Fuel cells, a technology known for their higher efficiency and environmental benefits, have experienced gradual market penetration despite their relatively higher cost compared to alternatives like gas engines and microturbines. A micro fuel cell, with a system capacity of 25 kW, contrasts with a gas engine's higher capacity of 50 kW. The cost disparity is significant, with the combined heat and power (CHP) installed cost for a micro fuel cell reaching USD9,100 per kW, compared to USD2,210 per kW for a gas engine.
  • This difference underscores the importance of evaluating specific application requirements and cost-benefit analyses in the decision-making process for industrial and military applications. Fuel cells' adoption continues to grow, driven by the need for improved efficiency, enhanced regulatory compliance, and optimized costs in various industries.

Fuel Cells Market For Industrial And Mlitary Applications Size

In-Depth Market Segmentation: Fuel Cells For Industrial And Mlitary Applications Market

The fuel cells for industrial and mlitary applications industry research report provides comprehensive data (region-wise segment analysis), with forecasts and estimates in "USD million" for the period 2025-2029, as well as historical data from 2019-2023 for the following segments.

  • End-user
    • Industrial
    • Military
  • Product
    • PEMFC
    • PAFC
    • SOFC
    • Others
  • Geography
    • North America
      • US
      • Canada
    • Europe
      • France
      • Germany
      • UK
    • APAC
      • Australia
      • China
      • India
      • Japan
      • South Korea
    • Rest of World (ROW)

By End-user Insights

The industrial segment is estimated to witness significant growth during the forecast period.

The Fuel Cells Market for Industrial and Military Applications continues to evolve, with significant growth anticipated in the industrial sector. Industrial fuel cell applications span prime/backup power and Combined Heat and Power (CHP) systems. These applications prioritize uninterrupted power due to their impact on production processes, driving the adoption of distributed energy sources. Distributed generation technologies, such as fuel cells, hybrid solar systems, biomass boilers, microturbines, and wind turbines, offer advantages unattainable from centralized grids. For instance, power generation occurs at the source, eliminating transmission and distribution losses and enhancing reliability. In the fuel cell domain, ongoing research focuses on system efficiency analysis, hydrogen fuel processing, catalyst layer optimization, and membrane electrode assembly design.

Specifically, high-temperature fuel cells, such as Solid Oxide Fuel Cells (SOFCs), are gaining traction due to their improved efficiency and thermal management systems. Renewable hydrogen sources, like wind and solar, are increasingly utilized to power fuel cells, further enhancing their environmental appeal. Fuel cell durability is another critical area of focus, with advancements in stack integration methods, auxiliary power units, and hydrogen oxidation reaction optimization. The water management system and hydrogen storage methods are also under constant scrutiny to ensure optimal fuel cell performance. According to a recent study, the industrial fuel cell market is projected to grow at a compound annual growth rate (CAGR) of 12.3% between 2021 and 2028.

Fuel Cells Market For Industrial And Mlitary Applications Size

Request Free Sample

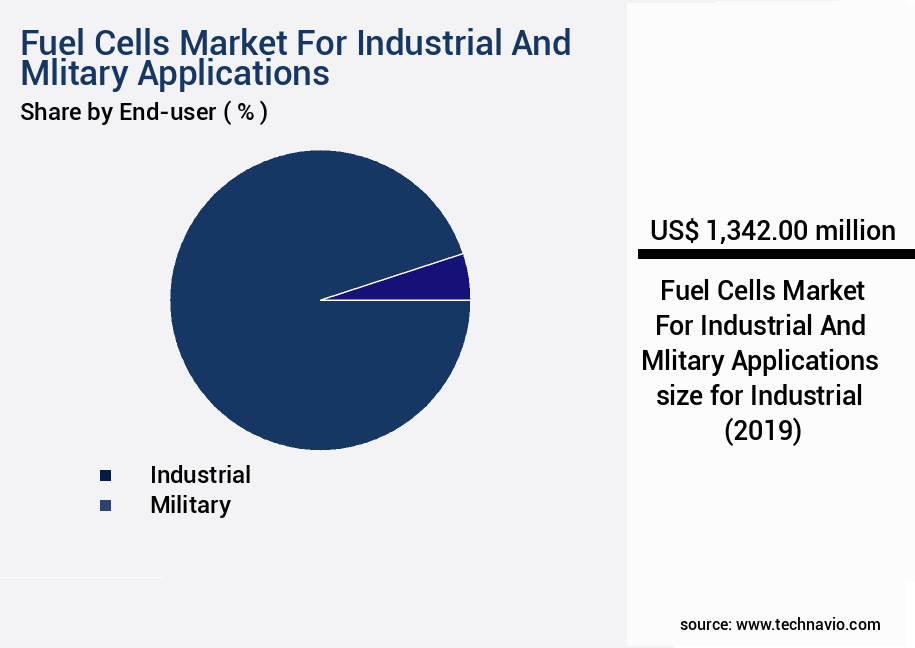
The Industrial segment was valued at USD 1.34 billion in 2019 and showed a gradual increase during the forecast period.

Fuel Cells Market For Industrial And Mlitary Applications Size

Request Free Sample

Regional Analysis

APAC is estimated to contribute 47% to the growth of the global market during the forecast period.Technavio's analysts have elaborately explained the regional trends and drivers that shape the market during the forecast period.

Fuel Cells Market For Industrial And Mlitary Applications Share by Geography

See How Fuel Cells For Industrial And Mlitary Applications Market Demand is Rising in APAC Request Free Sample

The global fuel cells market for industrial and military applications is experiencing steady growth, particularly in the Asia Pacific (APAC) region. Fueled by substantial investments in fuel cell technology and the increasing demand for energy efficiency and cost savings, this market is poised for significant expansion. According to industry reports, the APAC fuel cells market is projected to grow at a robust pace, with Japan, South Korea, and China leading the charge. These countries' emphasis on sustainable energy generation and their efforts to curb greenhouse gas emissions are major catalysts for market growth.

The fuel cells market in APAC is expected to surpass USDX billion by 2027, representing a compound annual growth rate (CAGR) of Y%. This growth is attributed to the increasing adoption of fuel cells in various sectors, including transportation, power generation, and industrial processes, where energy efficiency and cost savings are crucial factors.

Fuel Cells Market For Industrial And Mlitary Applications Share by Geography

 Customer Landscape of Fuel Cells For Industrial And Mlitary Applications Industry

Competitive Intelligence by Technavio Analysis: Leading Players in the Fuel Cells Market For Industrial And Mlitary Applications

Companies are implementing various strategies, such as strategic alliances, fuel cells market for industrial and mlitary applications forecast, partnerships, mergers and acquisitions, geographical expansion, and product/service launches, to enhance their presence in the industry.

Acumentrics Inc. - The company specializes in the development and commercialization of advanced fuel cell technologies, including Solid Oxide fuel cells and ruggedized uninterruptible power supplies and power electronics. These innovative solutions provide efficient, reliable, and sustainable energy storage and power generation options for various industries.

The industry research and growth report includes detailed analyses of the competitive landscape of the market and information about key companies, including:

  • Acumentrics Inc.
  • Advent Technologies Holdings Inc.
  • Air Liquide SA
  • AISIN Corp.
  • Altergy Systems
  • Australian Fuel Cells Pty Ltd.
  • Ballard Power Systems Inc.
  • Bloom Energy Corp.
  • Doosan Fuel Cell Co. Ltd.
  • FuelCell Energy Inc.
  • Intelligent Energy Ltd.
  • Nedstack Fuel Cell Technology BV
  • Nuvera Fuel Cells LLC
  • Plug Power Inc.
  • Redox Power Systems LLC
  • SFC Energy AG
  • Toshiba Corp.
  • TW Horizon Fuel Cell Technologies

Qualitative and quantitative analysis of companies has been conducted to help clients understand the wider business environment as well as the strengths and weaknesses of key industry players. Data is qualitatively analyzed to categorize companies as pure play, category-focused, industry-focused, and diversified; it is quantitatively analyzed to categorize companies as dominant, leading, strong, tentative, and weak.

Recent Development and News in Fuel Cells Market For Industrial And Mlitary Applications

  • In August 2024, Ballard Power Systems, a leading fuel cell manufacturer, announced the launch of their new FCvelocity-9SSL fuel cell stack, which offers an increased power density of 3.6 watts per square centimeter. This development is expected to enhance the efficiency and performance of fuel cell systems in industrial and military applications (Ballard Power Systems Press Release, 2024).
  • In November 2024, Plug Power, a leading fuel cell technology provider, entered into a strategic partnership with the U.S. Army to develop and deploy hydrogen fuel cell systems for military applications. The partnership aims to reduce the military's reliance on diesel generators and contribute to their net-zero emissions goal (Plug Power Press Release, 2024).
  • In March 2025, Bloom Energy, a fuel cell technology company, secured a USD100 million investment from Siemens Energy to accelerate the commercialization of their fuel cell technology. The collaboration is expected to expand Bloom Energy's market presence and strengthen their position in the industrial fuel cell market (Bloomberg, 2025).
  • In May 2025, the European Union announced the launch of the European Hydrogen Valley Initiative, a public-private partnership aimed at creating a hydrogen economy in Europe. The initiative includes the deployment of fuel cell systems in various industrial applications and the development of hydrogen refueling infrastructure (European Commission Press Release, 2025).

Dive into Technavio's robust research methodology, blending expert interviews, extensive data synthesis, and validated models for unparalleled Fuel Cells Market For Industrial And Mlitary Applications insights. See full methodology.

Market Scope

Report Coverage

Details

Page number

204

Base year

2024

Historic period

2019-2023

Forecast period

2025-2029

Growth momentum & CAGR

Accelerate at a CAGR of 20.6%

Market growth 2025-2029

USD 3312.8 million

Market structure

Fragmented

YoY growth 2024-2025(%)

17.0

Key countries

US, Canada, UK, Germany, Japan, China, France, India, South Korea, and Australia

Competitive landscape

Leading Companies, Market Positioning of Companies, Competitive Strategies, and Industry Risks

Request Free Sample

Why Choose Technavio for Fuel Cells Market For Industrial And Mlitary Applications Insights?

"Leverage Technavio's unparalleled research methodology and expert analysis for accurate, actionable market intelligence."

The global fuel cells market for industrial and military applications is experiencing significant growth due to the increasing demand for clean and efficient energy solutions. Fuel cells, which convert chemical energy into electricity through an electrochemical process, offer numerous advantages over traditional power sources. They emit minimal greenhouse gases, operate quietly, and offer high efficiency levels, making them an attractive option for industries seeking to reduce their carbon footprint and enhance operational efficiency. Military applications are a major driver of the fuel cells market, with the technology's ability to provide reliable and long-lasting power in remote and harsh environments. The military's adoption of fuel cells is expected to increase as governments invest in modernizing their defense infrastructure. In the industrial sector, fuel cells are being used to power various applications, including backup power systems, material handling equipment, and combined heat and power (CHP) systems. The fuel cells market for industrial and military applications is expected to grow at a robust rate in the coming years, driven by technological advancements and increasing demand. According to industry experts, the market is projected to grow by over 20% annually, making it a significant area of investment for businesses seeking to future-proof their energy strategies. The integration of fuel cells into supply chains offers numerous benefits. For instance, they enable businesses to reduce their reliance on traditional power sources, ensuring a more stable and reliable energy supply. In addition, fuel cells help businesses comply with increasingly stringent environmental regulations, making them an essential component of operational planning. Compared to traditional power sources, fuel cells offer several advantages. For instance, they have a longer lifespan, requiring less frequent replacement, and offer higher efficiency levels, reducing energy costs. Furthermore, fuel cells emit minimal greenhouse gases, making them an attractive option for businesses seeking to reduce their carbon footprint and enhance their sustainability credentials. In conclusion, the global fuel cells market for industrial and military applications is experiencing significant growth, driven by the increasing demand for clean and efficient energy solutions. With their ability to provide reliable and long-lasting power in various applications, fuel cells offer numerous advantages over traditional power sources, making them an essential component of operational planning for businesses seeking to future-proof their energy strategies.

What are the Key Data Covered in this Fuel Cells Market For Industrial And Mlitary Applications Research and Growth Report?

  • What is the expected growth of the Fuel Cells Market For Industrial And Mlitary Applications between 2025 and 2029?

    • USD 3.31 billion, at a CAGR of 20.6%

  • What segmentation does the market report cover?

    • The report is segmented by End-user (Industrial and Military), Product (PEMFC, PAFC, SOFC, and Others), and Geography (APAC, North America, Europe, South America, and Middle East and Africa)

  • Which regions are analyzed in the report?

    • APAC, North America, Europe, South America, and Middle East and Africa

  • What are the key growth drivers and market challenges?

    • Growing demand for efficient and cleaner technologies, High implementation costs of fuel cells

  • Who are the major players in the Fuel Cells Market For Industrial And Mlitary Applications?

    • Acumentrics Inc., Advent Technologies Holdings Inc., Air Liquide SA, AISIN Corp., Altergy Systems, Australian Fuel Cells Pty Ltd., Ballard Power Systems Inc., Bloom Energy Corp., Doosan Fuel Cell Co. Ltd., FuelCell Energy Inc., Intelligent Energy Ltd., Nedstack Fuel Cell Technology BV, Nuvera Fuel Cells LLC, Plug Power Inc., Redox Power Systems LLC, SFC Energy AG, Toshiba Corp., and TW Horizon Fuel Cell Technologies

We can help! Our analysts can customize this fuel cells market for industrial and mlitary applications research report to meet your requirements.

Get in touch

1 Executive Summary

  • 1.1 Market overview
    • Executive Summary - Chart on Market Overview
    • Executive Summary - Data Table on Market Overview
    • Executive Summary - Chart on Global Market Characteristics
    • Executive Summary - Chart on Market by Geography
    • Executive Summary - Chart on Market Segmentation by End-user
    • Executive Summary - Chart on Market Segmentation by Product
    • Executive Summary - Chart on Incremental Growth
    • Executive Summary - Data Table on Incremental Growth
    • Executive Summary - Chart on Company Market Positioning

2 Technavio Analysis

  • 2.1 Analysis of price sensitivity, lifecycle, customer purchase basket, adoption rates, and purchase criteria
    • Analysis of price sensitivity, lifecycle, customer purchase basket, adoption rates, and purchase criteria
  • 2.2 Criticality of inputs and Factors of differentiation
    • Overview on criticality of inputs and factors of differentiation
  • 2.3 Factors of disruption
    • Overview on factors of disruption
  • 2.4 Impact of drivers and challenges
    • Impact of drivers and challenges in 2024 and 2029

3 Market Landscape

  • 3.1 Market ecosystem
    • Parent Market
    • Data Table on - Parent Market
  • 3.2 Market characteristics
    • Market characteristics analysis
  • 3.3 Value chain analysis
    • Value chain analysis

4 Market Sizing

  • 4.1 Market definition
    • Offerings of companies included in the market definition
  • 4.2 Market segment analysis
    • Market segments
  • 4.3 Market size 2024
    • 4.4 Market outlook: Forecast for 2024-2029
      • Chart on Global - Market size and forecast 2024-2029 ($ million)
      • Data Table on Global - Market size and forecast 2024-2029 ($ million)
      • Chart on Global Market: Year-over-year growth 2024-2029 (%)
      • Data Table on Global Market: Year-over-year growth 2024-2029 (%)

    5 Historic Market Size

    • 5.1 Global Fuel Cells Market For Industrial And Mlitary Applications 2019 - 2023
      • Historic Market Size - Data Table on Global Fuel Cells Market For Industrial And Mlitary Applications 2019 - 2023 ($ million)
    • 5.2 End-user segment analysis 2019 - 2023
      • Historic Market Size - End-user Segment 2019 - 2023 ($ million)
    • 5.3 Product segment analysis 2019 - 2023
      • Historic Market Size - Product Segment 2019 - 2023 ($ million)
    • 5.4 Geography segment analysis 2019 - 2023
      • Historic Market Size - Geography Segment 2019 - 2023 ($ million)
    • 5.5 Country segment analysis 2019 - 2023
      • Historic Market Size - Country Segment 2019 - 2023 ($ million)

    6 Qualitative Analysis

    • 6.1 Impact of AI on Global Fuel Cells Market for Industrial and Military Applications

      7 Five Forces Analysis

      • 7.1 Five forces summary
        • Five forces analysis - Comparison between 2024 and 2029
      • 7.2 Bargaining power of buyers
        • Bargaining power of buyers - Impact of key factors 2024 and 2029
      • 7.3 Bargaining power of suppliers
        • Bargaining power of suppliers - Impact of key factors in 2024 and 2029
      • 7.4 Threat of new entrants
        • Threat of new entrants - Impact of key factors in 2024 and 2029
      • 7.5 Threat of substitutes
        • Threat of substitutes - Impact of key factors in 2024 and 2029
      • 7.6 Threat of rivalry
        • Threat of rivalry - Impact of key factors in 2024 and 2029
      • 7.7 Market condition
        • Chart on Market condition - Five forces 2024 and 2029

      8 Market Segmentation by End-user

      • 8.1 Market segments
        • Chart on End-user - Market share 2024-2029 (%)
        • Data Table on End-user - Market share 2024-2029 (%)
      • 8.2 Comparison by End-user
        • Chart on Comparison by End-user
        • Data Table on Comparison by End-user
      • 8.3 Industrial - Market size and forecast 2024-2029
        • Chart on Industrial - Market size and forecast 2024-2029 ($ million)
        • Data Table on Industrial - Market size and forecast 2024-2029 ($ million)
        • Chart on Industrial - Year-over-year growth 2024-2029 (%)
        • Data Table on Industrial - Year-over-year growth 2024-2029 (%)
      • 8.4 Military - Market size and forecast 2024-2029
        • Chart on Military - Market size and forecast 2024-2029 ($ million)
        • Data Table on Military - Market size and forecast 2024-2029 ($ million)
        • Chart on Military - Year-over-year growth 2024-2029 (%)
        • Data Table on Military - Year-over-year growth 2024-2029 (%)
      • 8.5 Market opportunity by End-user
        • Market opportunity by End-user ($ million)
        • Data Table on Market opportunity by End-user ($ million)

      9 Market Segmentation by Product

      • 9.1 Market segments
        • Chart on Product - Market share 2024-2029 (%)
        • Data Table on Product - Market share 2024-2029 (%)
      • 9.2 Comparison by Product
        • Chart on Comparison by Product
        • Data Table on Comparison by Product
      • 9.3 PEMFC - Market size and forecast 2024-2029
        • Chart on PEMFC - Market size and forecast 2024-2029 ($ million)
        • Data Table on PEMFC - Market size and forecast 2024-2029 ($ million)
        • Chart on PEMFC - Year-over-year growth 2024-2029 (%)
        • Data Table on PEMFC - Year-over-year growth 2024-2029 (%)
      • 9.4 PAFC - Market size and forecast 2024-2029
        • Chart on PAFC - Market size and forecast 2024-2029 ($ million)
        • Data Table on PAFC - Market size and forecast 2024-2029 ($ million)
        • Chart on PAFC - Year-over-year growth 2024-2029 (%)
        • Data Table on PAFC - Year-over-year growth 2024-2029 (%)
      • 9.5 SOFC - Market size and forecast 2024-2029
        • Chart on SOFC - Market size and forecast 2024-2029 ($ million)
        • Data Table on SOFC - Market size and forecast 2024-2029 ($ million)
        • Chart on SOFC - Year-over-year growth 2024-2029 (%)
        • Data Table on SOFC - Year-over-year growth 2024-2029 (%)
      • 9.6 Others - Market size and forecast 2024-2029
        • Chart on Others - Market size and forecast 2024-2029 ($ million)
        • Data Table on Others - Market size and forecast 2024-2029 ($ million)
        • Chart on Others - Year-over-year growth 2024-2029 (%)
        • Data Table on Others - Year-over-year growth 2024-2029 (%)
      • 9.7 Market opportunity by Product
        • Market opportunity by Product ($ million)
        • Data Table on Market opportunity by Product ($ million)

      10 Customer Landscape

      • 10.1 Customer landscape overview
        • Analysis of price sensitivity, lifecycle, customer purchase basket, adoption rates, and purchase criteria

      11 Geographic Landscape

      • 11.1 Geographic segmentation
        • Chart on Market share by geography 2024-2029 (%)
        • Data Table on Market share by geography 2024-2029 (%)
      • 11.2 Geographic comparison
        • Chart on Geographic comparison
        • Data Table on Geographic comparison
      • 11.3 APAC - Market size and forecast 2024-2029
        • Chart on APAC - Market size and forecast 2024-2029 ($ million)
        • Data Table on APAC - Market size and forecast 2024-2029 ($ million)
        • Chart on APAC - Year-over-year growth 2024-2029 (%)
        • Data Table on APAC - Year-over-year growth 2024-2029 (%)
      • 11.4 North America - Market size and forecast 2024-2029
        • Chart on North America - Market size and forecast 2024-2029 ($ million)
        • Data Table on North America - Market size and forecast 2024-2029 ($ million)
        • Chart on North America - Year-over-year growth 2024-2029 (%)
        • Data Table on North America - Year-over-year growth 2024-2029 (%)
      • 11.5 Europe - Market size and forecast 2024-2029
        • Chart on Europe - Market size and forecast 2024-2029 ($ million)
        • Data Table on Europe - Market size and forecast 2024-2029 ($ million)
        • Chart on Europe - Year-over-year growth 2024-2029 (%)
        • Data Table on Europe - Year-over-year growth 2024-2029 (%)
      • 11.6 South America - Market size and forecast 2024-2029
        • Chart on South America - Market size and forecast 2024-2029 ($ million)
        • Data Table on South America - Market size and forecast 2024-2029 ($ million)
        • Chart on South America - Year-over-year growth 2024-2029 (%)
        • Data Table on South America - Year-over-year growth 2024-2029 (%)
      • 11.7 Middle East and Africa - Market size and forecast 2024-2029
        • Chart on Middle East and Africa - Market size and forecast 2024-2029 ($ million)
        • Data Table on Middle East and Africa - Market size and forecast 2024-2029 ($ million)
        • Chart on Middle East and Africa - Year-over-year growth 2024-2029 (%)
        • Data Table on Middle East and Africa - Year-over-year growth 2024-2029 (%)
      • 11.8 US - Market size and forecast 2024-2029
        • Chart on US - Market size and forecast 2024-2029 ($ million)
        • Data Table on US - Market size and forecast 2024-2029 ($ million)
        • Chart on US - Year-over-year growth 2024-2029 (%)
        • Data Table on US - Year-over-year growth 2024-2029 (%)
      • 11.9 China - Market size and forecast 2024-2029
        • Chart on China - Market size and forecast 2024-2029 ($ million)
        • Data Table on China - Market size and forecast 2024-2029 ($ million)
        • Chart on China - Year-over-year growth 2024-2029 (%)
        • Data Table on China - Year-over-year growth 2024-2029 (%)
      • 11.10 Japan - Market size and forecast 2024-2029
        • Chart on Japan - Market size and forecast 2024-2029 ($ million)
        • Data Table on Japan - Market size and forecast 2024-2029 ($ million)
        • Chart on Japan - Year-over-year growth 2024-2029 (%)
        • Data Table on Japan - Year-over-year growth 2024-2029 (%)
      • 11.11 India - Market size and forecast 2024-2029
        • Chart on India - Market size and forecast 2024-2029 ($ million)
        • Data Table on India - Market size and forecast 2024-2029 ($ million)
        • Chart on India - Year-over-year growth 2024-2029 (%)
        • Data Table on India - Year-over-year growth 2024-2029 (%)
      • 11.12 South Korea - Market size and forecast 2024-2029
        • Chart on South Korea - Market size and forecast 2024-2029 ($ million)
        • Data Table on South Korea - Market size and forecast 2024-2029 ($ million)
        • Chart on South Korea - Year-over-year growth 2024-2029 (%)
        • Data Table on South Korea - Year-over-year growth 2024-2029 (%)
      • 11.13 UK - Market size and forecast 2024-2029
        • Chart on UK - Market size and forecast 2024-2029 ($ million)
        • Data Table on UK - Market size and forecast 2024-2029 ($ million)
        • Chart on UK - Year-over-year growth 2024-2029 (%)
        • Data Table on UK - Year-over-year growth 2024-2029 (%)
      • 11.14 Canada - Market size and forecast 2024-2029
        • Chart on Canada - Market size and forecast 2024-2029 ($ million)
        • Data Table on Canada - Market size and forecast 2024-2029 ($ million)
        • Chart on Canada - Year-over-year growth 2024-2029 (%)
        • Data Table on Canada - Year-over-year growth 2024-2029 (%)
      • 11.15 Germany - Market size and forecast 2024-2029
        • Chart on Germany - Market size and forecast 2024-2029 ($ million)
        • Data Table on Germany - Market size and forecast 2024-2029 ($ million)
        • Chart on Germany - Year-over-year growth 2024-2029 (%)
        • Data Table on Germany - Year-over-year growth 2024-2029 (%)
      • 11.16 Australia - Market size and forecast 2024-2029
        • Chart on Australia - Market size and forecast 2024-2029 ($ million)
        • Data Table on Australia - Market size and forecast 2024-2029 ($ million)
        • Chart on Australia - Year-over-year growth 2024-2029 (%)
        • Data Table on Australia - Year-over-year growth 2024-2029 (%)
      • 11.17 France - Market size and forecast 2024-2029
        • Chart on France - Market size and forecast 2024-2029 ($ million)
        • Data Table on France - Market size and forecast 2024-2029 ($ million)
        • Chart on France - Year-over-year growth 2024-2029 (%)
        • Data Table on France - Year-over-year growth 2024-2029 (%)
      • 11.18 Market opportunity by geography
        • Market opportunity by geography ($ million)
        • Data Tables on Market opportunity by geography ($ million)

      12 Drivers, Challenges, and Opportunity/Restraints

      • 12.1 Market drivers
        • 12.2 Market challenges
          • 12.3 Impact of drivers and challenges
            • Impact of drivers and challenges in 2024 and 2029
          • 12.4 Market opportunities/restraints

            13 Competitive Landscape

            • 13.1 Overview
              • 13.2 Competitive Landscape
                • Overview on criticality of inputs and factors of differentiation
              • 13.3 Landscape disruption
                • Overview on factors of disruption
              • 13.4 Industry risks
                • Impact of key risks on business

              14 Competitive Analysis

              • 14.1 Companies profiled
                • Companies covered
              • 14.2 Company ranking index
                • Company ranking index
              • 14.3 Market positioning of companies
                • Matrix on companies position and classification
              • 14.4 Acumentrics Inc.
                • Acumentrics Inc. - Overview
                • Acumentrics Inc. - Product / Service
                • Acumentrics Inc. - Key offerings
                • SWOT
              • 14.5 AISIN Corp.
                • AISIN Corp. - Overview
                • AISIN Corp. - Business segments
                • AISIN Corp. - Key news
                • AISIN Corp. - Key offerings
                • AISIN Corp. - Segment focus
                • SWOT
              • 14.6 Altergy Systems
                • Altergy Systems - Overview
                • Altergy Systems - Product / Service
                • Altergy Systems - Key offerings
                • SWOT
              • 14.7 Ballard Power Systems Inc.
                • Ballard Power Systems Inc. - Overview
                • Ballard Power Systems Inc. - Product / Service
                • Ballard Power Systems Inc. - Key offerings
                • SWOT
              • 14.8 Bloom Energy Corp.
                • Bloom Energy Corp. - Overview
                • Bloom Energy Corp. - Product / Service
                • Bloom Energy Corp. - Key offerings
                • SWOT
              • 14.9 Doosan Fuel Cell Co. Ltd.
                • Doosan Fuel Cell Co. Ltd. - Overview
                • Doosan Fuel Cell Co. Ltd. - Product / Service
                • Doosan Fuel Cell Co. Ltd. - Key offerings
                • SWOT
              • 14.10 FuelCell Energy Inc.
                • FuelCell Energy Inc. - Overview
                • FuelCell Energy Inc. - Product / Service
                • FuelCell Energy Inc. - Key offerings
                • SWOT
              • 14.11 Intelligent Energy Ltd.
                • Intelligent Energy Ltd. - Overview
                • Intelligent Energy Ltd. - Product / Service
                • Intelligent Energy Ltd. - Key offerings
                • SWOT
              • 14.12 Nedstack Fuel Cell Technology BV
                • Nedstack Fuel Cell Technology BV - Overview
                • Nedstack Fuel Cell Technology BV - Product / Service
                • Nedstack Fuel Cell Technology BV - Key offerings
                • SWOT
              • 14.13 Nuvera Fuel Cells LLC
                • Nuvera Fuel Cells LLC - Overview
                • Nuvera Fuel Cells LLC - Product / Service
                • Nuvera Fuel Cells LLC - Key offerings
                • SWOT
              • 14.14 Plug Power Inc.
                • Plug Power Inc. - Overview
                • Plug Power Inc. - Product / Service
                • Plug Power Inc. - Key offerings
                • SWOT
              • 14.15 Redox Power Systems LLC
                • Redox Power Systems LLC - Overview
                • Redox Power Systems LLC - Product / Service
                • Redox Power Systems LLC - Key offerings
                • SWOT
              • 14.16 SFC Energy AG
                • SFC Energy AG - Overview
                • SFC Energy AG - Business segments
                • SFC Energy AG - Key offerings
                • SFC Energy AG - Segment focus
                • SWOT
              • 14.17 Toshiba Corp.
                • Toshiba Corp. - Overview
                • Toshiba Corp. - Business segments
                • Toshiba Corp. - Key news
                • Toshiba Corp. - Key offerings
                • Toshiba Corp. - Segment focus
                • SWOT
              • 14.18 TW Horizon Fuel Cell Technologies
                • TW Horizon Fuel Cell Technologies - Overview
                • TW Horizon Fuel Cell Technologies - Product / Service
                • TW Horizon Fuel Cell Technologies - Key offerings
                • SWOT

              15 Appendix

              • 15.1 Scope of the report
                • 15.2 Inclusions and exclusions checklist
                  • Inclusions checklist
                  • Exclusions checklist
                • 15.3 Currency conversion rates for US$
                  • Currency conversion rates for US$
                • 15.4 Research methodology
                  • Research methodology
                • 15.5 Data procurement
                  • Information sources
                • 15.6 Data validation
                  • Data validation
                • 15.7 Validation techniques employed for market sizing
                  • Validation techniques employed for market sizing
                • 15.8 Data synthesis
                  • Data synthesis
                • 15.9 360 degree market analysis
                  • 360 degree market analysis
                • 15.10 List of abbreviations
                  • List of abbreviations

                Research Methodology

                Technavio presents a detailed picture of the market by way of study, synthesis, and summation of data from multiple sources. The analysts have presented the various facets of the market with a particular focus on identifying the key industry influencers. The data thus presented is comprehensive, reliable, and the result of extensive research, both primary and secondary.

                INFORMATION SOURCES

                Primary sources

                • Manufacturers and suppliers
                • Channel partners
                • Industry experts
                • Strategic decision makers

                Secondary sources

                • Industry journals and periodicals
                • Government data
                • Financial reports of key industry players
                • Historical data
                • Press releases

                DATA ANALYSIS

                Data Synthesis

                • Collation of data
                • Estimation of key figures
                • Analysis of derived insights

                Data Validation

                • Triangulation with data models
                • Reference against proprietary databases
                • Corroboration with industry experts

                REPORT WRITING

                Qualitative

                • Market drivers
                • Market challenges
                • Market trends
                • Five forces analysis

                Quantitative

                • Market size and forecast
                • Market segmentation
                • Geographical insights
                • Competitive landscape

                Interested in this report?

                Get your sample now to see our research methodology and insights!

                Download Now

                Frequently Asked Questions

                Fuel Cells For Industrial And Mlitary Applications market growth will increase by $ 3312.8 mn during 2025-2029.

                The Fuel Cells For Industrial And Mlitary Applications market is expected to grow at a CAGR of 20.6% during 2025-2029.

                Fuel Cells For Industrial And Mlitary Applications market is segmented by End-user( Industrial, Military) Product( PEMFC, PAFC, SOFC, Others, MEA)

                Acumentrics Inc., Advent Technologies Holdings Inc., Air Liquide SA, AISIN Corp., Altergy Systems, Australian Fuel Cells Pty Ltd., Ballard Power Systems Inc., Bloom Energy Corp., Doosan Fuel Cell Co. Ltd., FuelCell Energy Inc., Intelligent Energy Ltd., Nedstack Fuel Cell Technology BV, Nuvera Fuel Cells LLC, Plug Power Inc., Redox Power Systems LLC, SFC Energy AG, Toshiba Corp., TW Horizon Fuel Cell Technologies are a few of the key vendors in the Fuel Cells For Industrial And Mlitary Applications market.

                APAC will register the highest growth rate of 47% among the other regions. Therefore, the Fuel Cells For Industrial And Mlitary Applications market in APAC is expected to garner significant business opportunities for the vendors during the forecast period.

                US, Canada, UK, Germany, Japan, China, France, India, South Korea, Australia

                • Growing demand for efficient and cleaner technologiesManufacturing facilities require constant power to have a continuous process for the efficient operation of the plant. This has resulted in facility managers using fossil fuel generators as a backup in the event of an outage. However is the driving factor this market.
                • the growing demand for electricity is the driving factor this market.
                • as well as the awareness about using cleaner energy forms is the driving factor this market.
                • is driving the market for alternate technology sources such as fuel cells. Climate change mitigation techniques involve the use of cleaner fuels to produce electricity. Fuel cells are regarded as an efficient and reliable technology that can generate power and supply heat wherever necessary. Fuel cells are scalable in nature; their capacity can range from kilowatts to megawatts is the driving factor this market.
                • allowing them to be used for backup in facilities such as manufacturing plants warehouses is the driving factor this market.
                • and primary power in off-grid networks to supply power.Fuel cells are also known to provide high efficiency. For instance is the driving factor this market.
                • the efficiency of solid oxide fuel cells can reach up to 70%. However is the driving factor this market.
                • a net efficiency of 60% has been achieved even at 1 kW of delivered power in most of the projects implemented. This high efficiency is usually achieved at a high temperature of 1 is the driving factor this market.
                • 472 degrees F-1 is the driving factor this market.
                • 832 degrees F. High efficiency would also lead to lower emissions of greenhouse gases. The use of SOFC at 60% efficiency is expected to bring down GHG emissions by 40%. This is because higher efficiency would imply lower use of primary fuel is the driving factor this market.
                • leading to fewer emissions of CO2. Moreover is the driving factor this market.
                • power in fuel cells is produced through an electrochemical reaction and does not involve any combustion process to convert fuel to electricity. Depending on fuel sources is the driving factor this market.
                • emissions can be zero or nearly zero. These emissions is the driving factor this market.
                • too is the driving factor this market.
                • are not harmful is the driving factor this market.
                • such as nitrous oxide or particulate matter is the driving factor this market.
                • but primarily take the form of water and heat. Further is the driving factor this market.
                • the system efficiency can be increased when the heat from the fuel cell is captured as CHP or for cogeneration. These benefits have resulted in the high adoption of fuel cell technologies is the driving factor this market.
                • thereby driving the global fuel cells market for industrial and military applications during the forecast period. is the driving factor this market.

                The Fuel Cells For Industrial And Mlitary Applications market vendors should focus on grabbing business opportunities from the Industrial segment as it accounted for the largest market share in the base year.