
Synthetic Monitoring Market Size 2025-2029
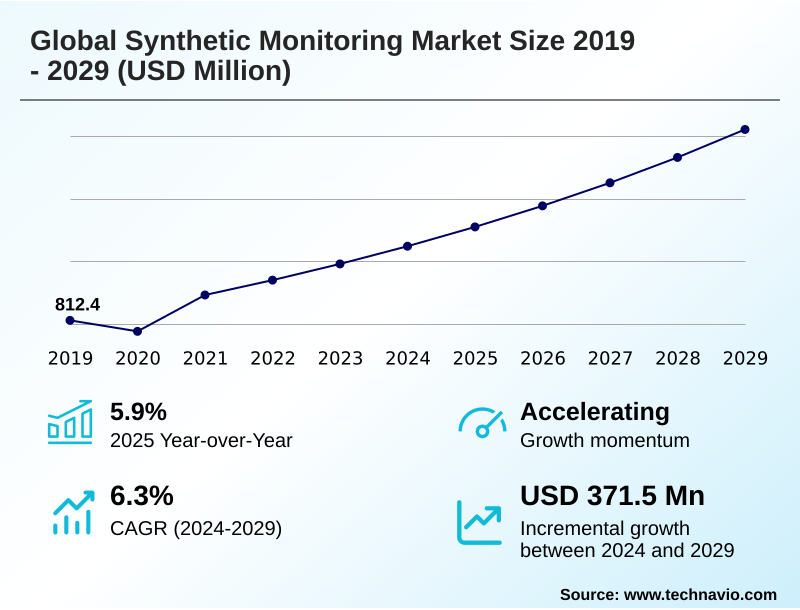
The synthetic monitoring market size is valued to increase by USD 371.5 million, at a CAGR of 6.3% from 2024 to 2029. Pricing strategies of companies will drive the synthetic monitoring market.
Major Market Trends & Insights
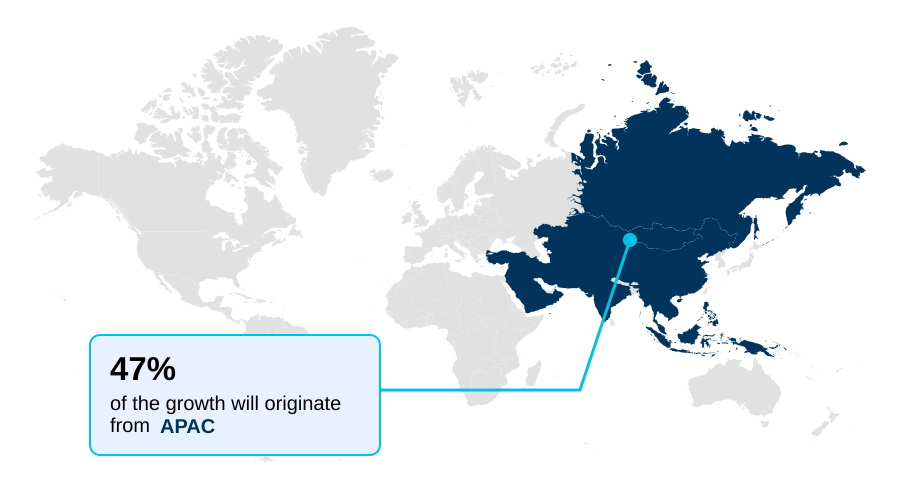
- APAC dominated the market and accounted for a 46.9% growth during the forecast period.
- By Type - API monitoring segment was valued at USD 473.3 million in 2023
- By Deployment - Cloud segment accounted for the largest market revenue share in 2023
Market Size & Forecast
- Market Opportunities: USD 607.5 million
- Market Future Opportunities: USD 371.5 million
- CAGR from 2024 to 2029 : 6.3%
Market Summary
- The Synthetic Monitoring Market is undergoing substantial evolution, driven by the escalating complexity of digital infrastructures and the non-negotiable demand for flawless digital experiences. As enterprises shift to distributed architectures like microservices and multi-cloud environments, traditional reactive monitoring becomes insufficient.
- Proactive performance testing is now essential, using scripted user interaction to simulate complete business processes and validate functionality before customers are affected. For instance, a global e-commerce platform relies on synthetic tests to continuously validate its multi-step checkout process across different regions, ensuring third-party payment gateway integrations are performing optimally.
- This approach, which includes application availability monitoring and page load speed analysis, allows operations teams to establish performance benchmarks and uphold service level agreements, directly safeguarding revenue and brand reputation by identifying issues before they cause widespread outages. The integration of these tools into broader observability strategies is a key trend.
What will be the Size of the Synthetic Monitoring Market during the forecast period?
Get Key Insights on Market Forecast (PDF) Get Free Sample
How is the Synthetic Monitoring Market Segmented?
The synthetic monitoring industry research report provides comprehensive data (region-wise segment analysis), with forecasts and estimates in "USD million" for the period 2025-2029, as well as historical data from 2019-2023 for the following segments.
- Type
- API monitoring
- Website monitoring
- Mobile applications monitoring
- Deployment
- Cloud
- On-premises
- Technology
- Real-time alerting
- Predictive analytics
- AI-based anomaly detection
- Geography
- APAC
- China
- Japan
- India
- North America
- US
- Canada
- Mexico
- Europe
- Germany
- UK
- France
- South America
- Brazil
- Argentina
- Middle East and Africa
- Saudi Arabia
- UAE
- South Africa
- Rest of World (ROW)
- APAC
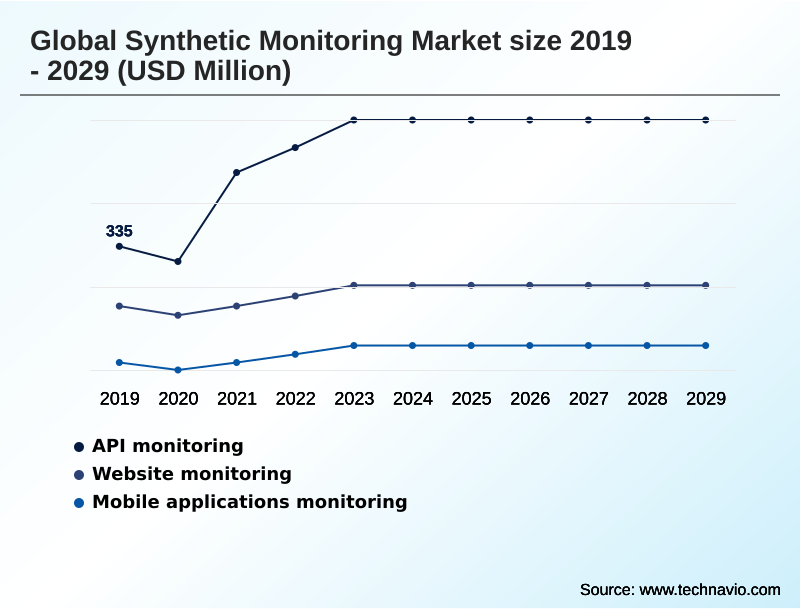
By Type Insights
The api monitoring segment is estimated to witness significant growth during the forecast period.
The segment focuses on monitoring APIs in production to gain visibility into performance, availability, and functional correctness. API uptime monitoring is crucial, especially when applications rely on third-party services for functions like payments or CRM.
The market is defined by the need for proactive issue detection before end-users are impacted. This involves browser transaction simulation and user journey scripting to validate the entire application stack.
Effective backend service availability verification ensures that business-critical processes function correctly, enabling firms to meet SLA compliance validation goals.
Organizations using these methods report a significant improvement in detecting API-related errors by over 25%, allowing for superior digital experience optimization and a clearer understanding of application performance metrics through multi-step transaction analysis and web performance baselining.
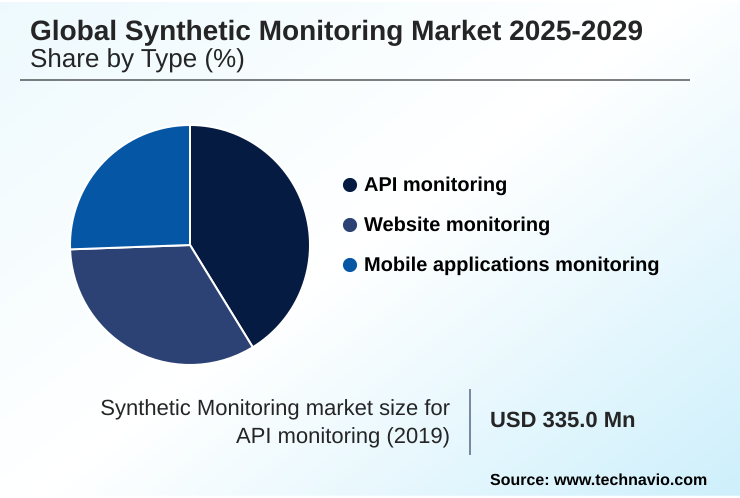
The API monitoring segment was valued at USD 473.3 million in 2023 and showed a gradual increase during the forecast period.
Regional Analysis
APAC is estimated to contribute 46.9% to the growth of the global market during the forecast period.Technavio’s analysts have elaborately explained the regional trends and drivers that shape the market during the forecast period.
See How Synthetic Monitoring Market Demand is Rising in APAC Get Free Sample
The geographic landscape is shaped by regional digital maturity and infrastructure investment. The APAC region is a high-growth area, driven by its massive mobile-first population and the proliferation of super-apps, which demand sophisticated mobile SDK integration.
North America remains a dominant market, focusing on optimizing content delivery network performance and securing complex cloud environments through rigorous firewall rule validation. In Europe, data sovereignty rules influence the adoption of private agent deployment for internal application monitoring.
Across all regions, critical business transaction monitoring is a universal priority.
Businesses in developed markets report that using geographically dispersed checkpoints for website uptime calculation improves their detection of region-specific latency by over 30%, directly impacting global user satisfaction and SaaS application performance.
This highlights a global shift towards ensuring consistent API response time and digital experiences for proactive issue detection.
Market Dynamics
Our researchers analyzed the data with 2024 as the base year, along with the key drivers, trends, and challenges. A holistic analysis of drivers will help companies refine their marketing strategies to gain a competitive advantage.
- The strategic value of the Global Synthetic Monitoring Market 2025-2029 is increasingly tied to its ability to provide actionable intelligence before issues impact business outcomes. Organizations now understand how to monitor third-party API performance to mitigate supply chain risks, as a single failing external service can halt operations.
- The debate of synthetic vs real user monitoring for e-commerce is maturing, with many adopting a hybrid approach to gain both proactive baseline data and real-world user insights. For technical teams, the focus is on troubleshooting slow website load times proactively and validating CDN performance with synthetic tests from global locations.
- Automating API functional correctness tests and integrating synthetic tests into CI/CD pipelines are becoming standard practices, reducing post-deployment defects. For instance, teams that use private agents for internal application tests report a 40% faster mean-time-to-resolution compared to those relying solely on production-error logging.
- This proactive stance extends to testing complex user authentication flows, monitoring SSL certificate validity automatically, and assessing backend service latency impact. Scripting multi-step checkout process validation and using proactive detection of performance regressions are essential for maintaining revenue streams and customer trust.
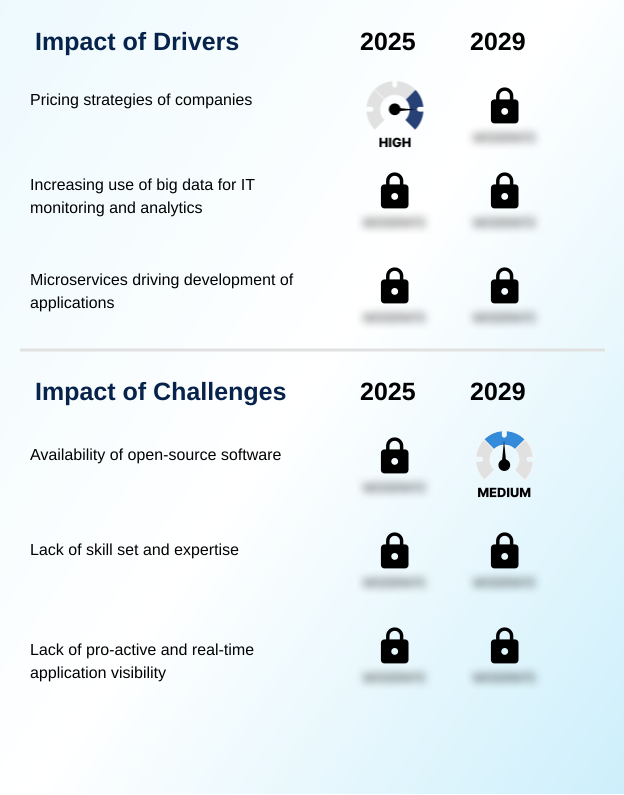
What are the key market drivers leading to the rise in the adoption of Synthetic Monitoring Industry?
- The adoption of customer-centric and value-based pricing strategies by vendors serves as a key driver for the market.
- The market's momentum is driven by the imperative for unwavering application reliability assurance. Businesses are leveraging synthetic data generation to test systems under various conditions, improving resilience by over 30% in pre-production environments.
- The demand for superior customer experience benchmarking is pushing companies to adopt continuous application availability monitoring and detailed page load speed analysis.
- For example, by monitoring third-party service dependency checks, e-commerce sites can reduce checkout errors by 15%, directly impacting revenue.
- Furthermore, the integration of scripted user interaction tests into the CI/CD pipeline integration is a major factor, supporting IT operations automation and enabling faster, more reliable software releases.
- This shift toward proactive quality control, focusing on backend service health checks, is fundamental to maintaining a competitive edge.
What are the market trends shaping the Synthetic Monitoring Industry?
- The growing adoption of cloud-based applications is a prominent market trend. This shift propels the demand for scalable and flexible monitoring-as-a-service (MaaS) tools.
- Key trends are shaping a more intelligent and automated approach to digital assurance. The growing complexity of applications necessitates comprehensive mobile app responsiveness testing and real browser testing to accurately capture user experience. Organizations are implementing multi-step workflow checks to validate critical business processes, moving beyond simple uptime pings.
- This provides end-to-end user path visibility, which has been shown to improve the identification of user journey failures by up to 40%. The focus on service level objective tracking is intensifying, with performance degradation alerts becoming more predictive.
- With DNS resolution verification and SSL certificate expiry monitoring now automated, teams can preempt common sources of outages, achieving nearly 99.99% uptime for core services. This proactive stance is enhanced by geographic performance insight and enables better root cause analysis enablement.
What challenges does the Synthetic Monitoring Industry face during its growth?
- The availability of robust open-source software and free monitoring tools poses a significant challenge to the market growth of proprietary solutions.
- Despite its growth, the market faces challenges from the accessibility of powerful open-source tools that offer robust functionality. These alternatives can perform comprehensive point of presence testing and proactive performance testing, making it difficult for commercial vendors to differentiate on core features alone. Organizations must also manage the complexity of internal application monitoring alongside public cloud monitoring.
- For example, a hybrid cloud environment can increase monitoring setup times by 50% if not managed with a unified strategy. Ensuring accurate first contentful paint metric and time to interactive measurement across diverse user environments and networks remains a technical hurdle.
- The need for effective external DNS monitoring and endpoint availability testing is well-understood, but integrating these with private network monitoring tools without creating data silos is a persistent challenge, particularly in pre-production environment testing.
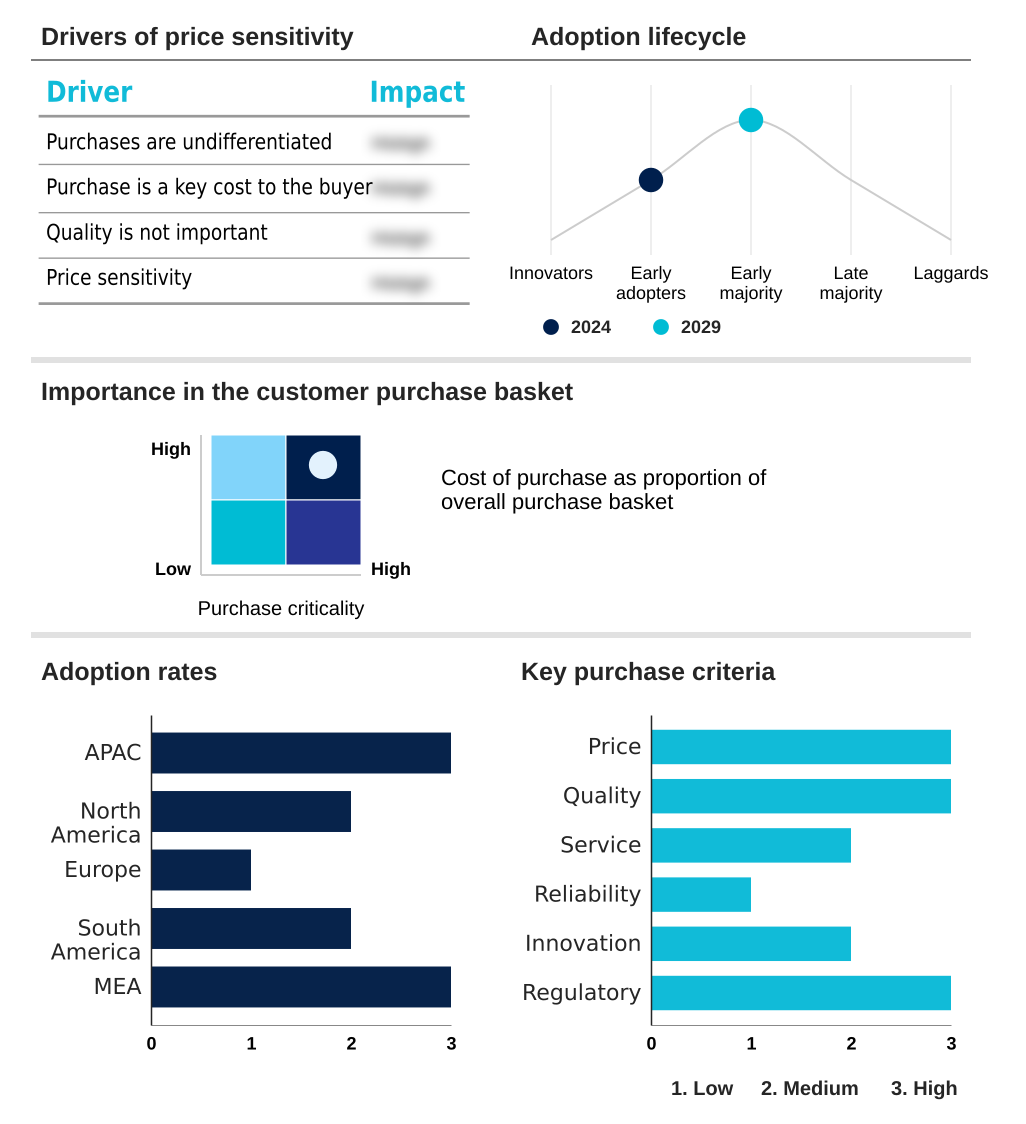
Exclusive Technavio Analysis on Customer Landscape
The synthetic monitoring market forecasting report includes the adoption lifecycle of the market, covering from the innovator’s stage to the laggard’s stage. It focuses on adoption rates in different regions based on penetration. Furthermore, the synthetic monitoring market report also includes key purchase criteria and drivers of price sensitivity to help companies evaluate and develop their market growth analysis strategies.
Customer Landscape of Synthetic Monitoring Industry
Competitive Landscape
Companies are implementing various strategies, such as strategic alliances, synthetic monitoring market forecast, partnerships, mergers and acquisitions, geographical expansion, and product/service launches, to enhance their presence in the industry.
BMC Software Inc. - Provides a unified observability platform for proactive, end-to-end monitoring of complex digital ecosystems, integrating real-time analytics for comprehensive performance insights.
The industry research and growth report includes detailed analyses of the competitive landscape of the market and information about key companies, including:
- BMC Software Inc.
- Broadcom Inc.
- Catchpoint Systems Inc.
- Cisco Systems Inc.
- Datadog Inc.
- Dell Technologies Inc.
- Dotcom Monitor Inc.
- Dynatrace Inc.
- Hewlett Packard
- IBM Corp.
- Microsoft Corp.
- New Relic Inc.
- Open Text Corp.
- Oracle Corp.
- Riverbed Technology Inc.
- SmartBear Software Inc.
- SolarWinds Corp.
- Splunk Inc.
Qualitative and quantitative analysis of companies has been conducted to help clients understand the wider business environment as well as the strengths and weaknesses of key industry players. Data is qualitatively analyzed to categorize companies as pure play, category-focused, industry-focused, and diversified; it is quantitatively analyzed to categorize companies as dominant, leading, strong, tentative, and weak.
Recent Development and News in Synthetic monitoring market
- In January 2025, Datadog Inc. launched its new AI-powered root cause analysis module, which automates the identification of performance degradation in complex microservices architectures, reducing mean time to resolution by up to 40%.
- In October 2024, Catchpoint Systems Inc. announced a strategic partnership with a leading cloud service provider to offer deeply integrated synthetic testing capabilities directly within the provider’s native management console.
- In April 2025, New Relic Inc. secured $200 million in funding to accelerate its global expansion and enhance its mobile application monitoring platform with advanced user session replay features.
- In November 2024, Cisco Systems Inc. acquired a network-layer monitoring company to combine application-level synthetic tests with underlying network performance data for end-to-end visibility.
Dive into Technavio’s robust research methodology, blending expert interviews, extensive data synthesis, and validated models for unparalleled Synthetic Monitoring Market insights. See full methodology.
| Market Scope | |
|---|---|
| Page number | 286 |
| Base year | 2024 |
| Historic period | 2019-2023 |
| Forecast period | 2025-2029 |
| Growth momentum & CAGR | Accelerate at a CAGR of 6.3% |
| Market growth 2025-2029 | USD 371.5 million |
| Market structure | Fragmented |
| YoY growth 2024-2025(%) | 5.9% |
| Key countries | China, Japan, India, South Korea, Indonesia, Australia, US, Canada, Mexico, Germany, UK, France, Italy, Spain, The Netherlands, Brazil, Argentina, Chile, Saudi Arabia, UAE, South Africa, Egypt and Nigeria |
| Competitive landscape | Leading Companies, Market Positioning of Companies, Competitive Strategies, and Industry Risks |
Research Analyst Overview
- The Synthetic Monitoring Market is evolving from a specialized IT tool to a strategic business asset, integral for ensuring digital service resilience. Its core value lies in proactive performance testing, where scripted user interaction and real browser testing simulate end-to-end business workflows. This allows organizations to move beyond simple endpoint availability testing.
- A key boardroom-level consideration is SLA compliance validation, where CIOs use data from critical business transaction monitoring to guarantee service delivery and avoid financial penalties. For instance, financial institutions leverage multi-step workflow checks to continuously validate online banking portals, ensuring functions from login to transaction confirmation meet performance standards.
- This preemptive approach, encompassing DNS resolution verification, SSL certificate expiry monitoring, and third-party service dependency checks, is crucial in complex ecosystems. Companies adopting these methods have reported a 20% reduction in critical customer-facing incidents, directly translating to improved brand reputation and operational stability.
What are the Key Data Covered in this Synthetic Monitoring Market Research and Growth Report?
-
What is the expected growth of the Synthetic Monitoring Market between 2025 and 2029?
-
USD 371.5 million, at a CAGR of 6.3%
-
-
What segmentation does the market report cover?
-
The report is segmented by Type (API monitoring, Website monitoring, Mobile applications monitoring), Deployment (Cloud, On-premises), Technology (Real-time alerting, Predictive analytics, AI-based anomaly detection) and Geography (APAC, North America, Europe, South America, Middle East and Africa)
-
-
Which regions are analyzed in the report?
-
APAC, North America, Europe, South America and Middle East and Africa
-
-
What are the key growth drivers and market challenges?
-
Pricing strategies of companies, Availability of open-source software
-
-
Who are the major players in the Synthetic Monitoring Market?
-
BMC Software Inc., Broadcom Inc., Catchpoint Systems Inc., Cisco Systems Inc., Datadog Inc., Dell Technologies Inc., Dotcom Monitor Inc., Dynatrace Inc., Hewlett Packard, IBM Corp., Microsoft Corp., New Relic Inc., Open Text Corp., Oracle Corp., Riverbed Technology Inc., SmartBear Software Inc., SolarWinds Corp. and Splunk Inc.
-
Market Research Insights
- The market is characterized by a strong emphasis on digital experience optimization, with enterprises leveraging proactive monitoring to gain a competitive edge. Adoption of multi-step transaction analysis has led to a 25% reduction in cart abandonment rates for some online retailers by identifying bottlenecks in the payment process.
- Furthermore, the integration with IT operations automation is enabling a shift towards self-healing infrastructures, where performance degradation alerts trigger automated remediation actions, improving system resilience. The focus on backend service availability verification is critical, as a failure in a single microservice can cascade through an entire application.
- Consequently, solutions offering end-to-end user path visibility and comprehensive application performance metrics are gaining prominence, with adoption rates in regulated industries growing by 15% year-over-year to ensure compliance and reliability.
We can help! Our analysts can customize this synthetic monitoring market research report to meet your requirements.
 RIA -
RIA - 
