Syrups Market Analysis, Size, and Forecast 2024-2028: North America (Canada and Mexico), Europe (France, Germany, and UK), Middle East and Africa (UAE), APAC (China, India, Indonesia, Japan, Malaysia, South Korea, and Thailand), South America (Brazil), and Rest of World (ROW)

Syrups Market Analysis, Size, and Forecast 2024-2028:
North America (Canada and Mexico), Europe (France, Germany, and UK), Middle East and Africa (UAE), APAC (China, India, Indonesia, Japan, Malaysia, South Korea, and Thailand), South America (Brazil), and Rest of World (ROW)

Published: Feb 2024 97 Pages SKU: IRTNTR77558

Market Overview at a Glance

$10.46 B
Market Opportunity
4.5%
CAGR
3.74
YoY growth 2023-2024(%)

Syrups Market Size 2024-2028

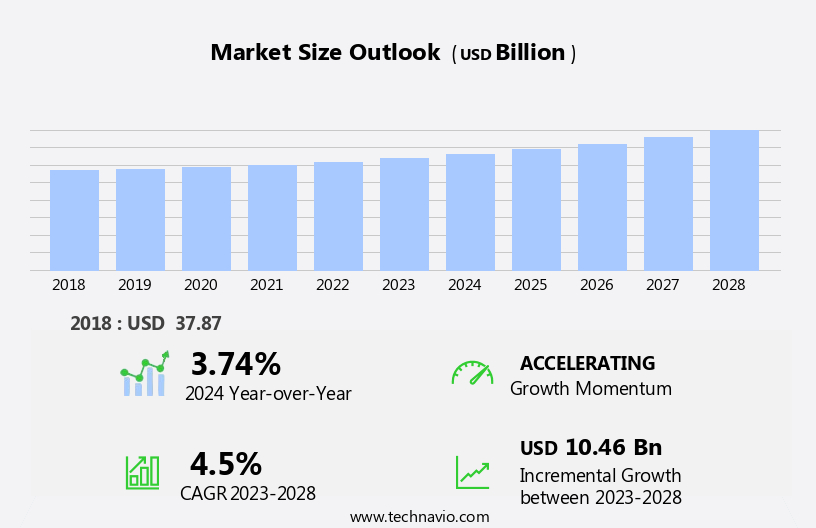
The syrups market size is forecast to increase by USD 10.46 billion, at a CAGR of 4.5% between 2023 and 2028.

  • The market is experiencing significant growth, driven by the increasing popularity of new product launches in the sector. Consumers' growing preference for plant-based diets is fueling this trend, as many syrup manufacturers are introducing natural and organic options to cater to this demand. However, the market faces challenges due to rising health concerns surrounding diabetes and obesity. As a result, companies must focus on developing healthier syrup alternatives with reduced sugar content or sugar substitutes. Additionally, there is a need for innovative marketing strategies to attract health-conscious consumers and differentiate offerings from competitors.
  • Navigating these dynamics requires strategic planning and a deep understanding of evolving consumer preferences and trends. Companies that successfully address these challenges and offer healthier, plant-based syrup options are poised to capitalize on the market's growth potential.

What will be the Size of the Syrups Market during the forecast period?

Syrups Market Size

Explore in-depth regional segment analysis with market size data - historical 2018-2022 and forecasts 2024-2028 - in the full report.  
Request Free Sample

The market continues to evolve, with dynamic market activities shaping its landscape. Refining processes are optimized to enhance carbohydrate composition analysis, ensuring the desired sweetness profile. Color stabilization methods are meticulously employed to maintain product aesthetics, while crystallization prevention techniques mitigate the risk of unwanted invert sugar crystallization (idustrial sugar) Thickening agents are selected based on rheological properties to achieve the desired syrup consistency, and water activity measurement is crucial for microbial contamination control. Quality control testing is a continuous process, ensuring aseptic syrup production and aqueous syrup solutions free from impurities. Syrup purification steps, including decolorization methods and filtration techniques, are essential for producing clear, high-quality syrups.

Syrup viscosity control and density regulation are critical factors in various applications, from food and beverage industries to pharmaceuticals. Texture modification and syrup storage conditions are also crucial aspects of syrup production, with evaporation technology playing a significant role in concentration regulation. Sweetener blend formulation and sweetener stability studies are ongoing research areas, as is the exploration of alternative sugar sources, such as sugarcane juice and corn syrup production. The market's continuous evolution is reflected in the ongoing refinement of production techniques, from sugarcane juice processing and syrup extraction to syrup filtration and flavor compound addition. Syrup production remains a dynamic and intricate process, with a focus on optimizing every step to meet the evolving demands of consumers and industries alike.

How is this Syrups Industry segmented?

The syrups industry research report provides comprehensive data (region-wise segment analysis), with forecasts and estimates in "USD billion" for the period 2024-2028, as well as historical data from 2018-2022 for the following segments.

  • Type
    • Flavor
    • Non-flavor
  • Distribution Channel
    • Offline
    • Online
  • Product Type
    • Maple Syrup
    • Corn Syrup
    • Fruit Syrup
    • Chocolate Syrup
    • Others
  • End-User
    • Household
    • Commercial
    • Industrial
  • Geography
    • North America
      • US
      • Canada
      • Mexico
    • Europe
      • France
      • Germany
      • UK
    • Middle East and Africa
      • UAE
    • APAC
      • China
      • India
      • Indonesia
      • Japan
      • Malaysia
      • South Korea
      • Thailand
    • South America
      • Brazil
    • Rest of World (ROW)

By Type Insights

The flavor segment is estimated to witness significant growth during the forecast period.

Flavored syrups, enriched with distinctive tastes, are widely used as food enhancers in various culinary applications. These syrups, available in natural, organic, sugar-free, concentrated, gluten-free, and sweetener variants, offer a unique taste to food and beverages. The market for flavored syrups is dynamic, with continuous advancements in carbohydrate composition analysis ensuring optimal sweetness and consistency. Microbial contamination control methods maintain product safety, while clarification techniques and syrup packaging materials preserve the syrup's texture and appearance. Invert sugar crystallization is a critical factor in syrup production, requiring refining process optimization and color stabilization methods. Thickening agents are selected based on rheological properties, water activity measurement, and quality control testing to achieve the desired syrup viscosity and density.

Syrup purification steps, including filtration techniques and flavor compound addition, contribute to the final product's taste profile. Glucose syrup refining, evaporation technology, decolorization methods, and sugarcane juice processing are essential components of the syrup production process. Sweetener stability studies and sugar concentration measurement ensure product consistency and longevity. Maple syrup processing follows unique purification steps, with texture modification techniques employed to maintain its distinct characteristics. Flavored syrups are versatile ingredients, used extensively in baking and desserts, beverages, and breakfast salads. Their application extends to a wide range of beverages, including tea, coffee, and cocktails. The evolving market trends prioritize natural and organic syrups, with a focus on sugar reduction and alternative sweeteners. Syrup manufacturers continually innovate to meet consumer demands, ensuring the market remains vibrant and dynamic.

Syrups Market Size

Request Free Sample

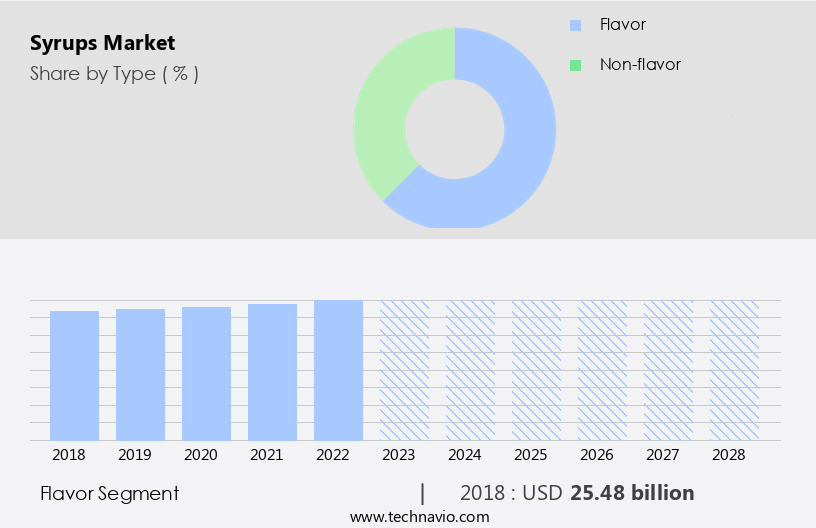
The Flavor segment was valued at USD 25.48 billion in 2018 and showed a gradual increase during the forecast period.

Regional Analysis

APAC is estimated to contribute 36% to the growth of the global market during the forecast period.Technavio's analysts have elaborately explained the regional trends and drivers that shape the market during the forecast period.

Syrups Market Share by Geography

 Request Free Sample

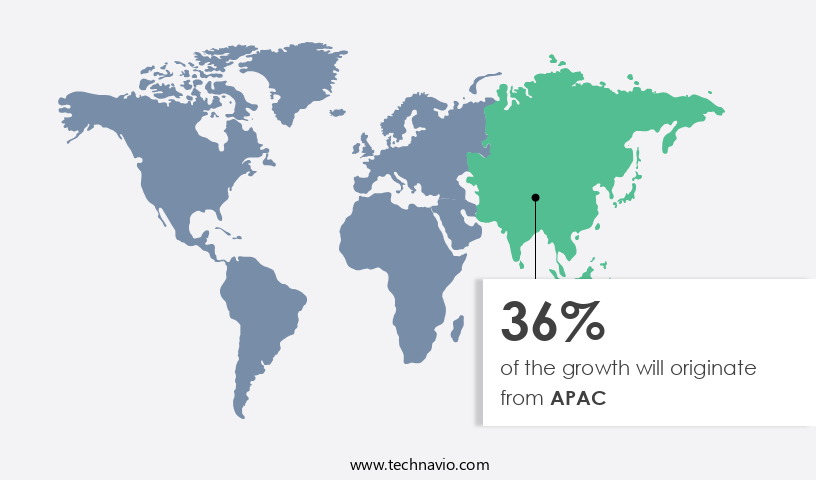
The market is witnessing significant growth due to increasing demand for convenience food and alternative sweeteners. APAC is the leading region in both production and consumption, driven by the confectionery, bakery, cereal, and dairy industries. In response to growing health consciousness, organic syrups like maple and agave are gaining popularity, with maple syrup processing becoming increasingly important. Liquid glucose, a crucial ingredient in confectionery and frozen desserts, is essential for controlling sugar crystallization. To ensure product quality, microbial contamination control, clarification techniques, and water activity measurement are crucial. Syrup packaging materials, thickening agent selection, and texture modification are also significant considerations.

Invert sugar crystallization, syrup rheological properties, and taste profile evaluation are vital in sweetener blend formulation and refining process optimization. Color stabilization methods and crystallization prevention are essential for maintaining syrup appearance and shelf life. Evaporation technology and decolorization methods are used in syrup production, while sugarcane juice processing and corn syrup production are key sources. Syrup filtration techniques and flavor compound addition are important for final product quality. Sweetener stability studies and sugar concentration measurement are also crucial aspects of the syrup market.

Market Dynamics

Our researchers analyzed the data with 2023 as the base year, along with the key drivers, trends, and challenges. A holistic analysis of drivers will help companies refine their marketing strategies to gain a competitive advantage.

The market continues to evolve, driven by advancements in technology and consumer preferences. Temperature viscosity plays a significant role in syrup production, with manufacturers constantly seeking optimal solutions to maintain consistency and efficiency. Ph stability is another crucial factor, as it impacts the shelf life and quality of various syrups, from sugarcane juice clarification methods to high fructose corn syrup health effects. In the realm of corn syrup production, ongoing efforts are focused on optimization and sustainability. For instance, researchers are exploring isomerization processes to enhance production efficiency and reduce waste. Similarly, maple syrup processors are investigating methods to minimize waste and improve processing efficiency. The sweetener blend compatibility study is a critical aspect of syrup development, as understanding how different thickening agents interact with various syrups is essential for achieving the desired texture and mouthfeel. Syrup packaging material selection criteria also require careful consideration, with an aqueous syrup solution stability study essential to ensure product longevity. Flavor compound release kinetics and color stability factors are also under scrutiny, as these elements significantly impact the sensory experience of consumers. Syrup rheological properties testing and carbohydrate composition determination are essential for maintaining quality control and ensuring product consistency. Moreover, microbial contamination detection methods and storage conditions optimization are crucial for maintaining product safety and shelf life. As the market continues to unfold, these ongoing research efforts will shape the industry's future trajectory.

What are the key market drivers leading to the rise in the adoption of Syrups Industry?

  • The introduction of new syrup products serves as the primary catalyst for market growth.  The market is experiencing significant growth due to the increasing number of new product launches by both regional and international players. These new offerings, such as Valeo Foods' Maple Crest Pancake syrup introduced in January 2024, contribute to the expansion of the market size and intensify competition among companies. Successful new product launches not only increase revenue and broaden consumer bases but also enhance market share and provide a competitive edge. To ensure product quality and safety, manufacturers focus on carbohydrate composition analysis, microbial contamination control, and taste profile evaluation. Clarification techniques, syrup packaging materials, and invert sugar crystallization are essential considerations for maintaining syrup rheological properties.
  • Sweetener blend formulation is another crucial aspect of syrup production, as it significantly impacts taste and consumer preference. Innovative strategies, such as distributive partnerships and collaborations, enable maple syrup manufacturers to reach a wider audience and increase market penetration. The market's growth is further driven by the growing demand for natural and organic food products, as consumers increasingly seek healthier alternatives to processed sugars. Overall, the market is expected to continue its growth trajectory, driven by these market dynamics and the continuous innovation in product offerings.

What are the market trends shaping the Syrups Industry?

  • The increasing popularity of plant-based diets represents a significant market trend. This dietary preference is gaining momentum among professionals and health-conscious individuals.
  • The global market for plant-based syrups, including maple, rice, malt, and agave varieties, is experiencing significant growth due to increasing consumer preferences for natural and vegan sweeteners. With approximately 889 million vegans worldwide as of March 2023, the demand for these syrups as a healthier alternative to traditional sweeteners like table sugar and artificial sweeteners is on the rise. These syrups, derived from plant sources, offer lower calorie counts and are considered a healthier option for managing chronic diseases such as diabetes, obesity, and high blood pressure. To meet the growing demand for these syrups, manufacturers focus on refining process optimization, color stabilization methods, crystallization prevention, and thickening agent selection.
  • Water activity measurement and quality control testing are crucial steps in the syrup purification process to ensure product consistency and safety. Aqueous syrup solutions require careful handling to maintain their natural properties and unique flavors. By implementing advanced production techniques and rigorous quality control measures, manufacturers can cater to the evolving consumer preferences and maintain a competitive edge in the market.

What challenges does the Syrups Industry face during its growth?

  • The increasing concerns regarding diabetes and obesity-related health issues pose a significant challenge to the industry's growth trajectory. 
  • The global syrup market is experiencing significant attention due to the increasing demand for sugar-sweetened beverages and the growing trend of using syrups as food additives. Syrup viscosity control and density regulation are crucial aspects of syrup production to ensure consistent product quality. Syrup storage conditions are another essential factor, as proper storage can prevent microbial growth and preserve texture. Texture modification is achieved through various methods, including the use of stabilizers and emulsifiers. Glucose syrup refining and evaporation technology are key techniques employed in the production process. Decolorization methods, such as carbon filtration and ion exchange, are used to remove impurities and improve syrup clarity.
  • Sugarcane juice processing is a significant source of syrup production, with advancements in technology leading to improved efficiency and product quality. The market dynamics are influenced by various factors, including consumer preferences, regulatory requirements, and technological advancements in syrup production. Producers are continually investing in research and development to innovate and meet the evolving demands of the market.

Exclusive Customer Landscape

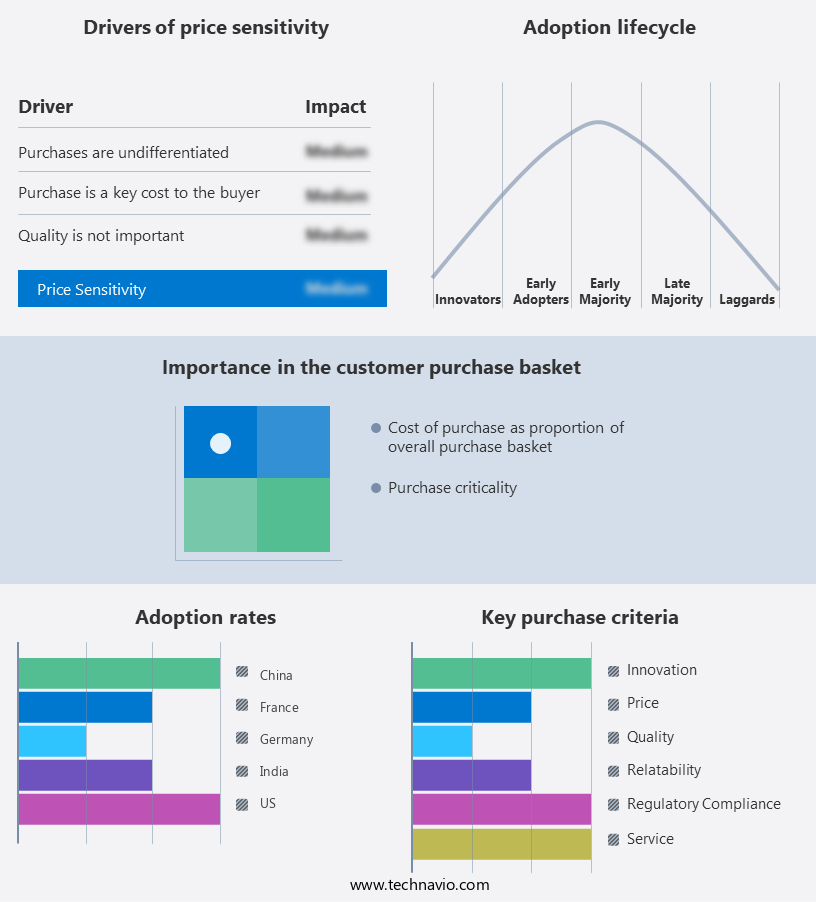
The syrups market forecasting report includes the adoption lifecycle of the market, covering from the innovator's stage to the laggard's stage. It focuses on adoption rates in different regions based on penetration. Furthermore, the syrups market report also includes key purchase criteria and drivers of price sensitivity to help companies evaluate and develop their market growth analysis strategies.

Syrups Market Share by Geography

 Customer Landscape

Key Companies & Market Insights

Companies are implementing various strategies, such as strategic alliances, syrups market forecast, partnerships, mergers and acquisitions, geographical expansion, and product/service launches, to enhance their presence in the industry.

Amoretti - This company specializes in the production and distribution of premium syrups, including Madagascar bourbon vanilla bean, caramel, and French vanilla varieties. Their offerings cater to the growing demand for high-quality, flavorful additives for various beverages. These syrups provide a rich, authentic taste, enhancing consumer experiences.

The industry research and growth report includes detailed analyses of the competitive landscape of the market and information about key companies, including:

  • Amoretti
  • Archer Daniels Midland Co.
  • Associated British Foods Plc
  • Bateel International Llc
  • Cargill Inc.
  • Conagra Brands Inc.
  • FDL Ltd.
  • Kerry Group Plc
  • Monin Inc.
  • R. Torre and Co.
  • Sensient Technologies Corp.
  • Tate and Lyle PLC
  • The Coca Cola Co.
  • The J.M Smucker Co.
  • Valeo Foods Ltd.

Qualitative and quantitative analysis of companies has been conducted to help clients understand the wider business environment as well as the strengths and weaknesses of key industry players. Data is qualitatively analyzed to categorize companies as pure play, category-focused, industry-focused, and diversified; it is quantitatively analyzed to categorize companies as dominant, leading, strong, tentative, and weak.

Recent Development and News in Syrups Market

  • In January 2024, Archer-Daniels-Midland Company (ADM) announced the launch of its new line of organic and natural sweetener syrups, including organic golden syrup and organic corn syrup, in response to growing consumer demand for healthier alternatives (ADM press release).
  • In March 2024, Tate & Lyle PLC and Sensient Technologies Corporation entered into a strategic partnership to develop and commercialize next-generation sweetener systems using stevia and monk fruit extracts, aiming to reduce sugar content in food and beverage products (Tate & Lyle press release).
  • In May 2024, Ingredion Incorporated completed the acquisition of Penford Corporation, significantly expanding its specialty ingredients portfolio, including functional native starches, maltodextrins, and corn syrups (Ingredion press release).
  • In April 2025, the European Commission approved the use of stevia as a sweetener in all types of foods and beverages, including alcoholic beverages, marking a significant regulatory milestone for The market (European Commission press release).

Research Analyst Overview

  • The market encompasses a diverse range of products, including food grade syrups derived from sugarcane and maple trees. Sugarcane refining plays a crucial role in syrup production, with product standardization and quality control procedures ensuring consistency in sweetener functionality and properties. Syrup stability is a significant concern, with storage stability, syrup viscosity, and microbial spoilage among the key challenges. Ingredient sourcing and packaging optimization are also essential for maintaining syrup quality. Flavor enhancement techniques, such as syrup dehydration and formulation adjustments, contribute to the market's growth. Sugarcane processing methods, including crystallization and thermal processing effects, influence syrup texture and sweetener properties.
  • Continuous processing and process automation are essential for efficient production and quality assessment. Corn syrup processing also plays a role in the market, with sweetener functionality and purification techniques impacting product quality. Sugar content analysis is a critical aspect of quality control, ensuring that syrups meet regulatory requirements and consumer expectations. Overall, the market is dynamic, with ongoing research and development efforts focused on improving syrup stability, enhancing flavor, and optimizing production processes.

Dive into Technavio's robust research methodology, blending expert interviews, extensive data synthesis, and validated models for unparalleled Syrups Market insights. See full methodology.

Market Scope

Report Coverage

Details

Page number

97

Base year

2023

Historic period

2018-2022

Forecast period

2024-2028

Growth momentum & CAGR

Accelerate at a CAGR of 4.5%

Market growth 2024-2028

USD 10.46 billion

Market structure

Fragmented

YoY growth 2023-2024(%)

3.74

Key countries

US, Malaysia, Indonesia, Germany, UK, South Korea, France, Canada, Brazil, Thailand, UAE, Mexico, China, Japan, and India

Competitive landscape

Leading Companies, Market Positioning of Companies, Competitive Strategies, and Industry Risks

Request Free Sample

What are the Key Data Covered in this Syrups Market Research and Growth Report?

  • CAGR of the Syrups industry during the forecast period
  • Detailed information on factors that will drive the growth and forecasting between 2024 and 2028
  • Precise estimation of the size of the market and its contribution of the industry in focus to the parent market
  • Accurate predictions about upcoming growth and trends and changes in consumer behaviour
  • Growth of the market across APAC, Europe, North America, South America, and Middle East and Africa
  • Thorough analysis of the market's competitive landscape and detailed information about companies
  • Comprehensive analysis of factors that will challenge the syrups market growth of industry companies

We can help! Our analysts can customize this syrups market research report to meet your requirements.

Get in touch

1 Executive Summary

  • 1.1 Market overview
    • Exhibit 01: Executive Summary – Chart on Market Overview
    • Exhibit 02: Executive Summary – Data Table on Market Overview
    • Exhibit 03: Executive Summary – Chart on Global Market Characteristics
    • Exhibit 04: Executive Summary – Chart on Market by Geography
    • Exhibit 05: Executive Summary – Chart on Market Segmentation by Type
    • Exhibit 06: Executive Summary – Chart on Market Segmentation by Distribution Channel
    • Exhibit 07: Executive Summary – Chart on Incremental Growth
    • Exhibit 08: Executive Summary – Data Table on Incremental Growth
    • Exhibit 09: Executive Summary – Chart on Vendor Market Positioning

2 Market Landscape

  • 2.1 Market ecosystem
    • Exhibit 10: Parent market
    • Exhibit 11: Market Characteristics

3 Market Sizing

  • 3.1 Market definition
    • Exhibit 12: Offerings of vendors included in the market definition
  • 3.2 Market segment analysis
    • Exhibit 13: Market segments
  • 3.3 Market size 2023
    • 3.4 Market outlook: Forecast for 2023-2028
      • Exhibit 14: Chart on Global - Market size and forecast 2023-2028 ($ million)
      • Exhibit 15: Data Table on Global - Market size and forecast 2023-2028 ($ million)
      • Exhibit 16: Chart on Global Market: Year-over-year growth 2023-2028 (%)
      • Exhibit 17: Data Table on Global Market: Year-over-year growth 2023-2028 (%)

    4 Historic Market Size

    • 4.1 Global syrups market 2018 - 2022
      • Exhibit 18: Historic Market Size – Data Table on global syrups market 2018 - 2022 ($ million)
    • 4.2 Type Segment Analysis 2018 - 2022
      • Exhibit 19: Historic Market Size – Type Segment 2018 - 2022 ($ million)
    • 4.3 Distribution Channel Segment Analysis 2018 - 2022
      • Exhibit 20: Historic Market Size – Distribution Channel Segment 2018 - 2022 ($ million)
    • 4.4 Geography Segment Analysis 2018 - 2022
      • Exhibit 21: Historic Market Size – Geography Segment 2018 - 2022 ($ million)
    • 4.5 Country Segment Analysis 2018 - 2022
      • Exhibit 22: Historic Market Size – Country Segment 2018 - 2022 ($ million)

    5 Five Forces Analysis

    • 5.1 Five forces summary
      • Exhibit 23: Five forces analysis - Comparison between 2023 and 2028
    • 5.2 Bargaining power of buyers
      • Exhibit 24: Chart on Bargaining power of buyers – Impact of key factors 2023 and 2028
    • 5.3 Bargaining power of suppliers
      • Exhibit 25: Bargaining power of suppliers – Impact of key factors in 2023 and 2028
    • 5.4 Threat of new entrants
      • Exhibit 26: Threat of new entrants – Impact of key factors in 2023 and 2028
    • 5.5 Threat of substitutes
      • Exhibit 27: Threat of substitutes – Impact of key factors in 2023 and 2028
    • 5.6 Threat of rivalry
      • Exhibit 28: Threat of rivalry – Impact of key factors in 2023 and 2028
    • 5.7 Market condition
      • Exhibit 29: Chart on Market condition - Five forces 2023 and 2028

    6 Market Segmentation by Type

    • 6.1 Market segments
      • Chart on Type - Market share (2023-2028) (%)
      • Data Table on Type - Market share (2023-2028) (%)
    • 6.2 Comparison by Type
      • Chart on Comparison by Type
      • Data Table on Comparison by Type
    • 6.3 Flavor - Market size and forecast (2023-2028)
      • Chart on Flavor - Market size and forecast (2023-2028) ($ million)
      • Data Table on Flavor - Market size and forecast (2023-2028) ($ million)
      • Chart on Flavor - Year-over-year growth (2023-2028) (%)
      • Data Table on Flavor - Year-over-year growth (2023-2028) (%)
    • 6.4 Non-flavor - Market size and forecast (2023-2028)
      • Chart on Non-flavor - Market size and forecast (2023-2028) ($ million)
      • Data Table on Non-flavor - Market size and forecast (2023-2028) ($ million)
      • Chart on Non-flavor - Year-over-year growth (2023-2028) (%)
      • Data Table on Non-flavor - Year-over-year growth (2023-2028) (%)
    • 6.5 Market opportunity by Type
      • Market opportunity by Type ($ million)
      • Data Table on Market opportunity by Type ($ million)

    7 Market Segmentation by Distribution Channel

    • 7.1 Market segments
      • Chart on Distribution Channel - Market share (2023-2028) (%)
      • Data Table on Distribution Channel - Market share (2023-2028) (%)
    • 7.2 Comparison by Distribution Channel
      • Chart on Comparison by Distribution Channel
      • Data Table on Comparison by Distribution Channel
    • 7.3 Offline - Market size and forecast (2023-2028)
      • Chart on Offline - Market size and forecast (2023-2028) ($ million)
      • Data Table on Offline - Market size and forecast (2023-2028) ($ million)
      • Chart on Offline - Year-over-year growth (2023-2028) (%)
      • Data Table on Offline - Year-over-year growth (2023-2028) (%)
    • 7.4 Online - Market size and forecast (2023-2028)
      • Chart on Online - Market size and forecast (2023-2028) ($ million)
      • Data Table on Online - Market size and forecast (2023-2028) ($ million)
      • Chart on Online - Year-over-year growth (2023-2028) (%)
      • Data Table on Online - Year-over-year growth (2023-2028) (%)
    • 7.5 Market opportunity by Distribution Channel
      • Market opportunity by Distribution Channel ($ million)
      • Data Table on Market opportunity by Distribution Channel ($ million)

    8 Market Segmentation by Product Type

    • 8.1 Market segments
      • Chart on Product Type - Market share (2023-2028) (%)
      • Data Table on Product Type - Market share (2023-2028) (%)
    • 8.2 Comparison by Product Type
      • Chart on Comparison by Product Type
      • Data Table on Comparison by Product Type
    • 8.3 Maple Syrup - Market size and forecast (2023-2028)
      • Chart on Maple Syrup - Market size and forecast (2023-2028) ($ million)
      • Data Table on Maple Syrup - Market size and forecast (2023-2028) ($ million)
      • Chart on Maple Syrup - Year-over-year growth (2023-2028) (%)
      • Data Table on Maple Syrup - Year-over-year growth (2023-2028) (%)
    • 8.4 Corn Syrup - Market size and forecast (2023-2028)
      • Chart on Corn Syrup - Market size and forecast (2023-2028) ($ million)
      • Data Table on Corn Syrup - Market size and forecast (2023-2028) ($ million)
      • Chart on Corn Syrup - Year-over-year growth (2023-2028) (%)
      • Data Table on Corn Syrup - Year-over-year growth (2023-2028) (%)
    • 8.5 Fruit Syrup - Market size and forecast (2023-2028)
      • Chart on Fruit Syrup - Market size and forecast (2023-2028) ($ million)
      • Data Table on Fruit Syrup - Market size and forecast (2023-2028) ($ million)
      • Chart on Fruit Syrup - Year-over-year growth (2023-2028) (%)
      • Data Table on Fruit Syrup - Year-over-year growth (2023-2028) (%)
    • 8.6 Chocolate Syrup - Market size and forecast (2023-2028)
      • Chart on Chocolate Syrup - Market size and forecast (2023-2028) ($ million)
      • Data Table on Chocolate Syrup - Market size and forecast (2023-2028) ($ million)
      • Chart on Chocolate Syrup - Year-over-year growth (2023-2028) (%)
      • Data Table on Chocolate Syrup - Year-over-year growth (2023-2028) (%)
    • 8.7 Others - Market size and forecast (2023-2028)
      • Chart on Others - Market size and forecast (2023-2028) ($ million)
      • Data Table on Others - Market size and forecast (2023-2028) ($ million)
      • Chart on Others - Year-over-year growth (2023-2028) (%)
      • Data Table on Others - Year-over-year growth (2023-2028) (%)
    • 8.8 Market opportunity by Product Type
      • Market opportunity by Product Type ($ million)
      • Data Table on Market opportunity by Product Type ($ million)

    9 Market Segmentation by End-User

    • 9.1 Market segments
      • Chart on End-User - Market share (2023-2028) (%)
      • Data Table on End-User - Market share (2023-2028) (%)
    • 9.2 Comparison by End-User
      • Chart on Comparison by End-User
      • Data Table on Comparison by End-User
    • 9.3 Household - Market size and forecast (2023-2028)
      • Chart on Household - Market size and forecast (2023-2028) ($ million)
      • Data Table on Household - Market size and forecast (2023-2028) ($ million)
      • Chart on Household - Year-over-year growth (2023-2028) (%)
      • Data Table on Household - Year-over-year growth (2023-2028) (%)
    • 9.4 Commercial - Market size and forecast (2023-2028)
      • Chart on Commercial - Market size and forecast (2023-2028) ($ million)
      • Data Table on Commercial - Market size and forecast (2023-2028) ($ million)
      • Chart on Commercial - Year-over-year growth (2023-2028) (%)
      • Data Table on Commercial - Year-over-year growth (2023-2028) (%)
    • 9.5 Industrial - Market size and forecast (2023-2028)
      • Chart on Industrial - Market size and forecast (2023-2028) ($ million)
      • Data Table on Industrial - Market size and forecast (2023-2028) ($ million)
      • Chart on Industrial - Year-over-year growth (2023-2028) (%)
      • Data Table on Industrial - Year-over-year growth (2023-2028) (%)
    • 9.6 Market opportunity by End-User
      • Market opportunity by End-User ($ million)
      • Data Table on Market opportunity by End-User ($ million)

    8 Customer Landscape

    • 8.1 Customer landscape overview
      • Exhibit 58: Analysis of price sensitivity, lifecycle, customer purchase basket, adoption rates, and purchase criteria

    9 Geographic Landscape

    • 9.1 Geographic segmentation
      • Exhibit 59: Chart on Market share by geography 2023-2028 (%)
      • Exhibit 60: Data Table on Market share by geography 2023-2028 (%)
    • 9.2 Geographic comparison
      • Exhibit 61: Chart on Geographic comparison
      • Exhibit 62: Data Table on Geographic comparison
    • 9.3 APAC - Market size and forecast 2023-2028
      • Exhibit 63: Chart on APAC - Market size and forecast 2023-2028 ($ million)
      • Exhibit 64: Data Table on APAC - Market size and forecast 2023-2028 ($ million)
      • Exhibit 65: Chart on APAC - Year-over-year growth 2023-2028 (%)
      • Exhibit 66: Data Table on APAC - Year-over-year growth 2023-2028 (%)
    • 9.4 Europe - Market size and forecast 2023-2028
      • Exhibit 67: Chart on Europe - Market size and forecast 2023-2028 ($ million)
      • Exhibit 68: Data Table on Europe - Market size and forecast 2023-2028 ($ million)
      • Exhibit 69: Chart on Europe - Year-over-year growth 2023-2028 (%)
      • Exhibit 70: Data Table on Europe - Year-over-year growth 2023-2028 (%)
    • 9.5 North America - Market size and forecast 2023-2028
      • Exhibit 71: Chart on North America - Market size and forecast 2023-2028 ($ million)
      • Exhibit 72: Data Table on North America - Market size and forecast 2023-2028 ($ million)
      • Exhibit 73: Chart on North America - Year-over-year growth 2023-2028 (%)
      • Exhibit 74: Data Table on North America - Year-over-year growth 2023-2028 (%)
    • 9.6 South America - Market size and forecast 2023-2028
      • Exhibit 75: Chart on South America - Market size and forecast 2023-2028 ($ million)
      • Exhibit 76: Data Table on South America - Market size and forecast 2023-2028 ($ million)
      • Exhibit 77: Chart on South America - Year-over-year growth 2023-2028 (%)
      • Exhibit 78: Data Table on South America - Year-over-year growth 2023-2028 (%)
    • 9.7 Middle East and Africa - Market size and forecast 2023-2028
      • Exhibit 79: Chart on Middle East and Africa - Market size and forecast 2023-2028 ($ million)
      • Exhibit 80: Data Table on Middle East and Africa - Market size and forecast 2023-2028 ($ million)
      • Exhibit 81: Chart on Middle East and Africa - Year-over-year growth 2023-2028 (%)
      • Exhibit 82: Data Table on Middle East and Africa - Year-over-year growth 2023-2028 (%)
    • 9.8 US - Market size and forecast 2023-2028
      • Exhibit 83: Chart on US - Market size and forecast 2023-2028 ($ million)
      • Exhibit 84: Data Table on US - Market size and forecast 2023-2028 ($ million)
      • Exhibit 85: Chart on US - Year-over-year growth 2023-2028 (%)
      • Exhibit 86: Data Table on US - Year-over-year growth 2023-2028 (%)
    • 9.9 China - Market size and forecast 2023-2028
      • Exhibit 87: Chart on China - Market size and forecast 2023-2028 ($ million)
      • Exhibit 88: Data Table on China - Market size and forecast 2023-2028 ($ million)
      • Exhibit 89: Chart on China - Year-over-year growth 2023-2028 (%)
      • Exhibit 90: Data Table on China - Year-over-year growth 2023-2028 (%)
    • 9.10 Germany - Market size and forecast 2023-2028
      • Exhibit 91: Chart on Germany - Market size and forecast 2023-2028 ($ million)
      • Exhibit 92: Data Table on Germany - Market size and forecast 2023-2028 ($ million)
      • Exhibit 93: Chart on Germany - Year-over-year growth 2023-2028 (%)
      • Exhibit 94: Data Table on Germany - Year-over-year growth 2023-2028 (%)
    • 9.11 France - Market size and forecast 2023-2028
      • Exhibit 95: Chart on France - Market size and forecast 2023-2028 ($ million)
      • Exhibit 96: Data Table on France - Market size and forecast 2023-2028 ($ million)
      • Exhibit 97: Chart on France - Year-over-year growth 2023-2028 (%)
      • Exhibit 98: Data Table on France - Year-over-year growth 2023-2028 (%)
    • 9.12 India - Market size and forecast 2023-2028
      • Exhibit 99: Chart on India - Market size and forecast 2023-2028 ($ million)
      • Exhibit 100: Data Table on India - Market size and forecast 2023-2028 ($ million)
      • Exhibit 101: Chart on India - Year-over-year growth 2023-2028 (%)
      • Exhibit 102: Data Table on India - Year-over-year growth 2023-2028 (%)
    • 9.13 Market opportunity by geography
      • Exhibit 103: Market opportunity by geography ($ million)
      • Exhibit 104: Data Tables on Market opportunity by geography ($ million)
    • 11.14 US - Market size and forecast (2023-2028)
      • Chart on US - Market size and forecast (2023-2028) ($ million)
      • Data Table on US - Market size and forecast (2023-2028) ($ million)
      • Chart on US - Year-over-year growth (2023-2028) (%)
      • Data Table on US - Year-over-year growth (2023-2028) (%)
    • 11.15 Malaysia - Market size and forecast (2023-2028)
      • Chart on Malaysia - Market size and forecast (2023-2028) ($ million)
      • Data Table on Malaysia - Market size and forecast (2023-2028) ($ million)
      • Chart on Malaysia - Year-over-year growth (2023-2028) (%)
      • Data Table on Malaysia - Year-over-year growth (2023-2028) (%)
    • 11.16 Indonesia - Market size and forecast (2023-2028)
      • Chart on Indonesia - Market size and forecast (2023-2028) ($ million)
      • Data Table on Indonesia - Market size and forecast (2023-2028) ($ million)
      • Chart on Indonesia - Year-over-year growth (2023-2028) (%)
      • Data Table on Indonesia - Year-over-year growth (2023-2028) (%)
    • 11.17 UK - Market size and forecast (2023-2028)
      • Chart on UK - Market size and forecast (2023-2028) ($ million)
      • Data Table on UK - Market size and forecast (2023-2028) ($ million)
      • Chart on UK - Year-over-year growth (2023-2028) (%)
      • Data Table on UK - Year-over-year growth (2023-2028) (%)
    • 11.18 South Korea - Market size and forecast (2023-2028)
      • Chart on South Korea - Market size and forecast (2023-2028) ($ million)
      • Data Table on South Korea - Market size and forecast (2023-2028) ($ million)
      • Chart on South Korea - Year-over-year growth (2023-2028) (%)
      • Data Table on South Korea - Year-over-year growth (2023-2028) (%)
    • 11.19 Canada - Market size and forecast (2023-2028)
      • Chart on Canada - Market size and forecast (2023-2028) ($ million)
      • Data Table on Canada - Market size and forecast (2023-2028) ($ million)
      • Chart on Canada - Year-over-year growth (2023-2028) (%)
      • Data Table on Canada - Year-over-year growth (2023-2028) (%)
    • 11.20 Brazil - Market size and forecast (2023-2028)
      • Chart on Brazil - Market size and forecast (2023-2028) ($ million)
      • Data Table on Brazil - Market size and forecast (2023-2028) ($ million)
      • Chart on Brazil - Year-over-year growth (2023-2028) (%)
      • Data Table on Brazil - Year-over-year growth (2023-2028) (%)
    • 11.21 Thailand - Market size and forecast (2023-2028)
      • Chart on Thailand - Market size and forecast (2023-2028) ($ million)
      • Data Table on Thailand - Market size and forecast (2023-2028) ($ million)
      • Chart on Thailand - Year-over-year growth (2023-2028) (%)
      • Data Table on Thailand - Year-over-year growth (2023-2028) (%)
    • 11.22 UAE - Market size and forecast (2023-2028)
      • Chart on UAE - Market size and forecast (2023-2028) ($ million)
      • Data Table on UAE - Market size and forecast (2023-2028) ($ million)
      • Chart on UAE - Year-over-year growth (2023-2028) (%)
      • Data Table on UAE - Year-over-year growth (2023-2028) (%)
    • 11.23 Mexico - Market size and forecast (2023-2028)
      • Chart on Mexico - Market size and forecast (2023-2028) ($ million)
      • Data Table on Mexico - Market size and forecast (2023-2028) ($ million)
      • Chart on Mexico - Year-over-year growth (2023-2028) (%)
      • Data Table on Mexico - Year-over-year growth (2023-2028) (%)
    • 11.24 Japan - Market size and forecast (2023-2028)
      • Chart on Japan - Market size and forecast (2023-2028) ($ million)
      • Data Table on Japan - Market size and forecast (2023-2028) ($ million)
      • Chart on Japan - Year-over-year growth (2023-2028) (%)
      • Data Table on Japan - Year-over-year growth (2023-2028) (%)
    • 11.25 Rest of World (ROW) - Market size and forecast (2023-2028)
      • Chart on Rest of World (ROW) - Market size and forecast (2023-2028) ($ million)
      • Data Table on Rest of World (ROW) - Market size and forecast (2023-2028) ($ million)
      • Chart on Rest of World (ROW) - Year-over-year growth (2023-2028) (%)
      • Data Table on Rest of World (ROW) - Year-over-year growth (2023-2028) (%)

    10 Drivers, Challenges, and Trends

    • 10.1 Market drivers
      • 10.2 Market challenges
        • 10.3 Impact of drivers and challenges
          • Exhibit 105: Impact of drivers and challenges in 2023 and 2028
        • 10.4 Market trends

          11 Vendor Landscape

          • 11.1 Overview
            • 11.2 Vendor landscape
              • Exhibit 106: Overview on Criticality of inputs and Factors of differentiation
            • 11.3 Landscape disruption
              • Exhibit 107: Overview on factors of disruption
            • 11.4 Industry risks
              • Exhibit 108: Impact of key risks on business

            12 Vendor Analysis

            • 12.1 Vendors covered
              • Exhibit 109: Vendors covered
            • 12.2 Market positioning of vendors
              • Exhibit 110: Matrix on vendor position and classification
            • 12.3 Amoretti
              • Exhibit 111: Amoretti - Overview
              • Exhibit 112: Amoretti - Product / Service
              • Exhibit 113: Amoretti - Key offerings
            • 12.4 Archer Daniels Midland Co.
              • Exhibit 114: Archer Daniels Midland Co. - Overview
              • Exhibit 115: Archer Daniels Midland Co. - Business segments
              • Exhibit 116: Archer Daniels Midland Co. - Key offerings
              • Exhibit 117: Archer Daniels Midland Co. - Segment focus
            • 12.5 Associated British Foods Plc
              • Exhibit 118: Associated British Foods Plc - Overview
              • Exhibit 119: Associated British Foods Plc - Business segments
              • Exhibit 120: Associated British Foods Plc - Key offerings
              • Exhibit 121: Associated British Foods Plc - Segment focus
            • 12.6 Bateel International Llc
              • Exhibit 122: Bateel International Llc - Overview
              • Exhibit 123: Bateel International Llc - Product / Service
              • Exhibit 124: Bateel International Llc - Key offerings
            • 12.7 Cargill Inc.
              • Exhibit 125: Cargill Inc. - Overview
              • Exhibit 126: Cargill Inc. - Product / Service
              • Exhibit 127: Cargill Inc. - Key news
              • Exhibit 128: Cargill Inc. - Key offerings
            • 12.8 Conagra Brands Inc.
              • Exhibit 129: Conagra Brands Inc. - Overview
              • Exhibit 130: Conagra Brands Inc. - Business segments
              • Exhibit 131: Conagra Brands Inc. - Key news
              • Exhibit 132: Conagra Brands Inc. - Key offerings
              • Exhibit 133: Conagra Brands Inc. - Segment focus
            • 12.9 FDL Ltd.
              • Exhibit 134: FDL Ltd. - Overview
              • Exhibit 135: FDL Ltd. - Product / Service
              • Exhibit 136: FDL Ltd. - Key offerings
            • 12.10 Kerry Group Plc
              • Exhibit 137: Kerry Group Plc - Overview
              • Exhibit 138: Kerry Group Plc - Business segments
              • Exhibit 139: Kerry Group Plc - Key offerings
              • Exhibit 140: Kerry Group Plc - Segment focus
            • 12.11 Monin Inc.
              • Exhibit 141: Monin Inc. - Overview
              • Exhibit 142: Monin Inc. - Product / Service
              • Exhibit 143: Monin Inc. - Key offerings
            • 12.12 R. Torre and Co.
              • Exhibit 144: R. Torre and Co. - Overview
              • Exhibit 145: R. Torre and Co. - Product / Service
              • Exhibit 146: R. Torre and Co. - Key offerings
            • 12.13 Sensient Technologies Corp.
              • Exhibit 147: Sensient Technologies Corp. - Overview
              • Exhibit 148: Sensient Technologies Corp. - Business segments
              • Exhibit 149: Sensient Technologies Corp. - Key offerings
              • Exhibit 150: Sensient Technologies Corp. - Segment focus
            • 12.14 Tate and Lyle PLC
              • Exhibit 151: Tate and Lyle PLC - Overview
              • Exhibit 152: Tate and Lyle PLC - Business segments
              • Exhibit 153: Tate and Lyle PLC - Key news
              • Exhibit 154: Tate and Lyle PLC - Key offerings
              • Exhibit 155: Tate and Lyle PLC - Segment focus
            • 12.15 The Coca Cola Co.
              • Exhibit 156: The Coca Cola Co. - Overview
              • Exhibit 157: The Coca Cola Co. - Business segments
              • Exhibit 158: The Coca Cola Co. - Key news
              • Exhibit 159: The Coca Cola Co. - Key offerings
              • Exhibit 160: The Coca Cola Co. - Segment focus
            • 12.16 The J.M Smucker Co.
              • Exhibit 161: The J.M Smucker Co. - Overview
              • Exhibit 162: The J.M Smucker Co. - Business segments
              • Exhibit 163: The J.M Smucker Co. - Key offerings
              • Exhibit 164: The J.M Smucker Co. - Segment focus
            • 12.17 Valeo Foods Ltd.
              • Exhibit 165: Valeo Foods Ltd. - Overview
              • Exhibit 166: Valeo Foods Ltd. - Product / Service
              • Exhibit 167: Valeo Foods Ltd. - Key offerings

            13 Appendix

            • 13.1 Scope of the report
              • 13.2 Inclusions and exclusions checklist
                • Exhibit 168: Inclusions checklist
                • Exhibit 169: Exclusions checklist
              • 13.3 Currency conversion rates for US$
                • Exhibit 170: Currency conversion rates for US$
              • 13.4 Research methodology
                • Exhibit 171: Research methodology
                • Exhibit 172: Validation techniques employed for market sizing
                • Exhibit 173: Information sources
              • 13.5 List of abbreviations
                • Exhibit 174: List of abbreviations

              Research Methodology

              Technavio presents a detailed picture of the market by way of study, synthesis, and summation of data from multiple sources. The analysts have presented the various facets of the market with a particular focus on identifying the key industry influencers. The data thus presented is comprehensive, reliable, and the result of extensive research, both primary and secondary.

              INFORMATION SOURCES

              Primary sources

              • Manufacturers and suppliers
              • Channel partners
              • Industry experts
              • Strategic decision makers

              Secondary sources

              • Industry journals and periodicals
              • Government data
              • Financial reports of key industry players
              • Historical data
              • Press releases

              DATA ANALYSIS

              Data Synthesis

              • Collation of data
              • Estimation of key figures
              • Analysis of derived insights

              Data Validation

              • Triangulation with data models
              • Reference against proprietary databases
              • Corroboration with industry experts

              REPORT WRITING

              Qualitative

              • Market drivers
              • Market challenges
              • Market trends
              • Five forces analysis

              Quantitative

              • Market size and forecast
              • Market segmentation
              • Geographical insights
              • Competitive landscape

              Interested in this report?

              Get your sample now to see our research methodology and insights!

              Download Now

              Frequently Asked Questions

              Syrups market growth will increase by $ 10.46 bn during 2024-2028 .

              The Syrups market is expected to grow at a CAGR of 4.5% during 2024-2028 .

              Syrups market is segmented by Type( Flavor, Non-flavor) Distribution Channel( Offline, Online)

              Amoretti, Archer Daniels Midland Co., Associated British Foods Plc, Bateel International Llc, Cargill Inc., Conagra Brands Inc., FDL Ltd., Kerry Group Plc, Monin Inc., R. Torre and Co., Sensient Technologies Corp., Tate and Lyle PLC, The Coca Cola Co., The J.M Smucker Co., Valeo Foods Ltd. are a few of the key vendors in the Syrups market.

              APAC will register the highest growth rate of 36% among the other regions. Therefore, the Syrups market in APAC is expected to garner significant business opportunities for the vendors during the forecast period.

              US, Malaysia, Indonesia, Germany, UK, South Korea, France, Canada, Brazil, Thailand, UAE, Mexico, China, Japan, India

              • New product launches in syrupIncreasing new product launches by regional and international players may support the growth of the global syrups market. The manufacturers of maple syrup are adopting innovative and distributive strategies to increase the market size of these products. Successful new product launches increase the competition among the vendors is the driving factor this market.
              • are expected to accelerate the growth of the global syrups market. A successful new product launch helps in increasing the revenue flow of a vendor and broadening its consumer base. Additionally is the driving factor this market.
              • new product launches increase the market share of players and offer them a competitive edge over other players in the market. The following are some of the recent new product launches: In January 2024 is the driving factor this market.
              • Valeo Foods is the driving factor this market.
              • an Irish food and beverage company announce the launch of Maple Crest Pancake syrup. The vendor has emphasized on quality and packaging design of the new syrup product.. In November 2023 is the driving factor this market.
              • Rowse is the driving factor this market.
              • which is a subsidiary of Valeo Foods is the driving factor this market.
              • announced the launches maple syrup brand into Sainsbury. In September 2021 is the driving factor this market.
              • Bateel is the driving factor this market.
              • a leader in the gourmet date manufacturer is the driving factor this market.
              • announced the launch of a wide range of organic date syrups. The syrup is available in four flavors is the driving factor this market.
              • including vanilla is the driving factor this market.
              • cardamom is the driving factor this market.
              • classic is the driving factor this market.
              • and passion fruit. Thus is the driving factor this market.
              • the increasing product launches is anticipated to drive the growth of the global syrups market during the forecast period. is the driving factor this market.

              The Syrups market vendors should focus on grabbing business opportunities from the Flavor segment as it accounted for the largest market share in the base year.