High-fructose Corn Syrup Market Analysis, Size, and Forecast 2026-2030: North America (US, Canada, and Mexico), Europe (Germany, UK, and France), APAC (China, Japan, and India), Middle East and Africa (Saudi Arabia, UAE, and South Africa), South America (Brazil and Argentina), and Rest of World (ROW)

High-fructose Corn Syrup Market Analysis, Size, and Forecast 2026-2030:
North America (US, Canada, and Mexico), Europe (Germany, UK, and France), APAC (China, Japan, and India), Middle East and Africa (Saudi Arabia, UAE, and South Africa), South America (Brazil and Argentina), and Rest of World (ROW)

Published: Apr 2026 290 Pages SKU: IRTNTR46384

Market Overview at a Glance

$840.1 Mn
Market Opportunity
2.4%
CAGR 2025 - 2030
44.6%
North America Growth
$4.82 B
Food and beverage segment 2024

High-fructose Corn Syrup Market Size 2026-2030

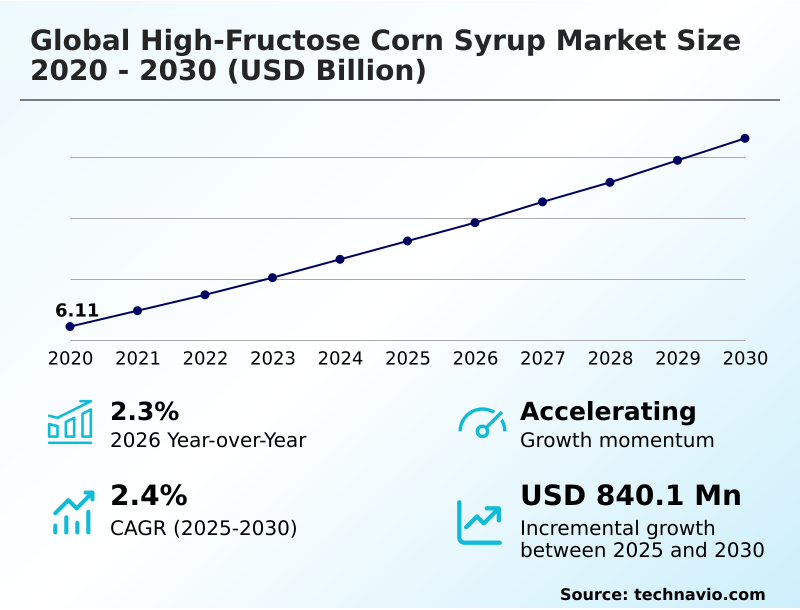
The high-fructose corn syrup market size is valued to increase by USD 840.1 million, at a CAGR of 2.4% from 2025 to 2030. Strategic requirement for cost efficiency amid sugar price volatility will drive the high-fructose corn syrup market.

Major Market Trends & Insights

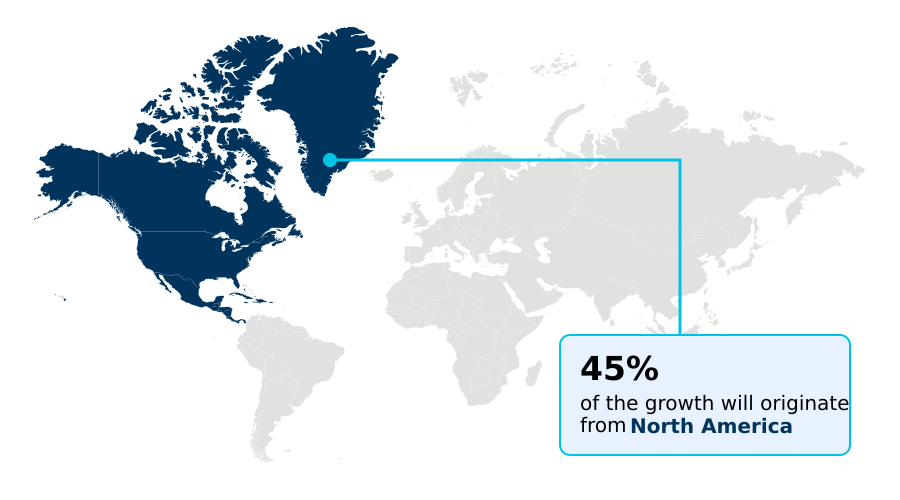
  • North America dominated the market and accounted for a 44.6% growth during the forecast period.
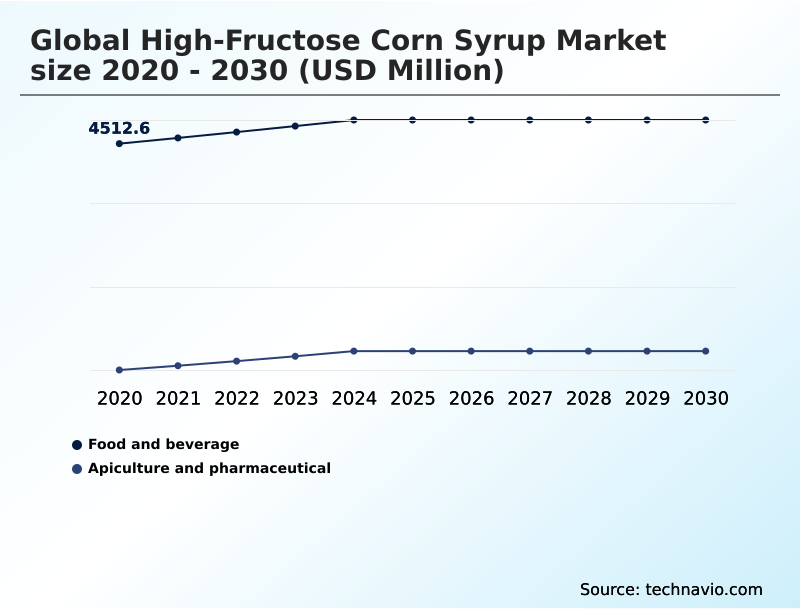
  • By Application - Food and beverage segment was valued at USD 4.82 billion in 2024
  • By Product Type - HFCS-55 segment accounted for the largest market revenue share in 2024

Market Size & Forecast

  • Market Opportunities: USD 1.54 billion
  • Market Future Opportunities: USD 840.1 million
  • CAGR from 2025 to 2030 : 2.4%

Market Summary

  • The high-fructose corn syrup market is defined by its critical role as a caloric sweetener in global food and beverage manufacturing. The core of the market revolves around the enzymatic isomerization of corn starch derivatives to produce a liquid sweetener formulation with a specific fructose-to-glucose ratio, such as HFCS-42 and HFCS-55.
  • This process delivers significant functional benefits, including humectant properties for shelf-life extension and superior stability in acidic solutions, making it indispensable for carbonated soft drinks and processed foods. A key business scenario involves beverage producers using automated blending systems to manage raw material volatility.
  • By dynamically adjusting the mix of high-fructose corn syrup and other sweeteners based on real-time commodity prices, companies can achieve a cost-optimization strategy that protects margins without altering the established sensory profile. This operational agility, combined with the sweetener's functional versatility, underscores its persistent value despite challenges from clean label alternatives and evolving consumer health perceptions.

What will be the Size of the High-fructose Corn Syrup Market during the forecast period?

Get Key Insights on Market Forecast (PDF) Request Free Sample

How is the High-fructose Corn Syrup Market Segmented?

The high-fructose corn syrup industry research report provides comprehensive data (region-wise segment analysis), with forecasts and estimates in "USD million" for the period 2026-2030, as well as historical data from 2020-2024 for the following segments.

  • Application
    • Food and beverage
    • Apiculture and pharmaceutical
  • Product type
    • HFCS-55
    • HFCS-42
    • Others
  • Distribution channel
    • Offline
    • Online
  • Geography
    • North America
      • US
      • Canada
      • Mexico
    • Europe
      • Germany
      • UK
      • France
    • APAC
      • China
      • Japan
      • India
    • Middle East and Africa
      • Saudi Arabia
      • UAE
      • South Africa
    • South America
      • Brazil
      • Argentina
    • Rest of World (ROW)

By Application Insights

The food and beverage segment is estimated to witness significant growth during the forecast period.

The food and beverage segment is foundational, driven by the industrial requirement for a high-solubility sweetener. The sector's reliance on high-fructose corn syrup is pronounced in ready-to-drink formulation, where its properties as a beverage stabilizer are critical.

This liquid carbohydrate source is also integral to confectionery production and as a processed bakery ingredient, valued for its humectant effects in baked goods.

Manufacturers leverage its functional texturizer capabilities and cost-optimization strategy, with data indicating that optimizing sweetener blending systems can reduce raw material expenditure by over 12% compared to using single-source sweeteners alone.

This industrial sweetener economics makes it a staple in high-volume food processing, especially as a condiment formulation agent and dairy product stabilizer.

Request Free Sample

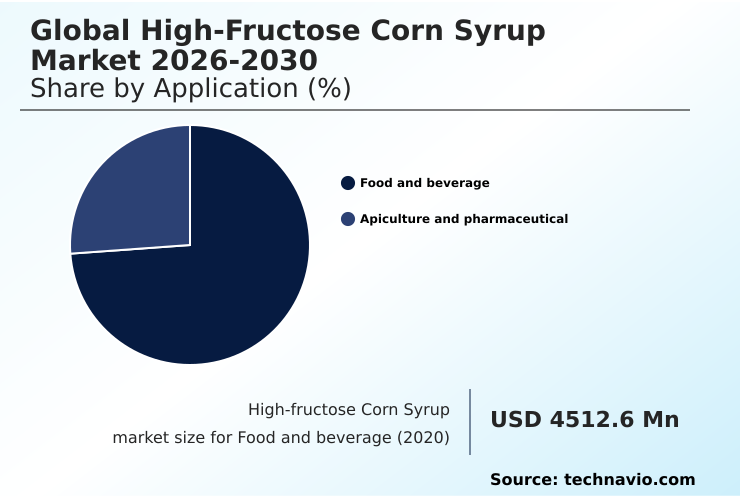
The Food and beverage segment was valued at USD 4.82 billion in 2024 and showed a gradual increase during the forecast period.

Request Free Sample

Regional Analysis

North America is estimated to contribute 44.6% to the growth of the global market during the forecast period.Technavio’s analysts have elaborately explained the regional trends and drivers that shape the market during the forecast period.

See How High-fructose Corn Syrup Market Demand is Rising in North America Request Free Sample

The geographic landscape is shifting, with mature markets focusing on efficiency and emerging regions driving volume. In North America, the focus is on optimizing isoglucose production and developing advanced liquid handling systems to manage costs.

Europe is navigating stringent regulations, promoting biocatalytic optimization in its processing plants. The APAC region is a major growth driver, where the ingredient is a key component in everything from a non-alcoholic beverage sweetener to a savory snack ingredient.

In these regions, the use of a liquid carbohydrate source is essential for scaling up production of shelf-stable food additives.

The industry's ability to provide a volatility-resistant sweetener has been crucial, with firms reporting that integrated supply chains have reduced logistics-related disruptions by up to 25% compared to non-integrated models.

This resilience is vital as the product expands into roles like a processed meat binder and soup base thickener.

Market Dynamics

Our researchers analyzed the data with 2025 as the base year, along with the key drivers, trends, and challenges. A holistic analysis of drivers will help companies refine their marketing strategies to gain a competitive advantage.

  • A critical analysis of the market reveals nuanced decision-making based on specific applications. The high-fructose corn syrup vs sucrose cost debate remains central to procurement, with industrial users frequently choosing corn sweeteners due to the cost efficiency of liquid sweeteners.
  • The use of hfcs-55 in carbonated soft drinks is standard due to the functional benefits of hfcs in beverages, particularly the stability of hfcs in acidic solutions. Conversely, hfcs-42 for bakery moisture retention is selected for its superior humectant effects in baked goods and for maillard reaction enhancement with hfcs.
  • The impact of hfcs on food texture is a key consideration for formulators. In pharmaceuticals, the selection of pharmaceutical grade hfcs as an excipient is driven by purity requirements. Beyond food, high-fructose corn syrup in apiculture serves as a reliable honeybee feed supplement.
  • The industry grapples with challenges such as replacing hfcs with clean label alternatives and navigating regulatory challenges for hfcs labeling. These factors, combined with the hfcs supply chain and corn prices, highlight the complexity of the market.
  • Firms that master the enzymatic isomerization of corn starch through efficient processing of corn wet-milling showcase a distinct competitive advantage, which is more than twice as effective in cost reduction than simple raw material substitution.

What are the key market drivers leading to the rise in the adoption of High-fructose Corn Syrup Industry?

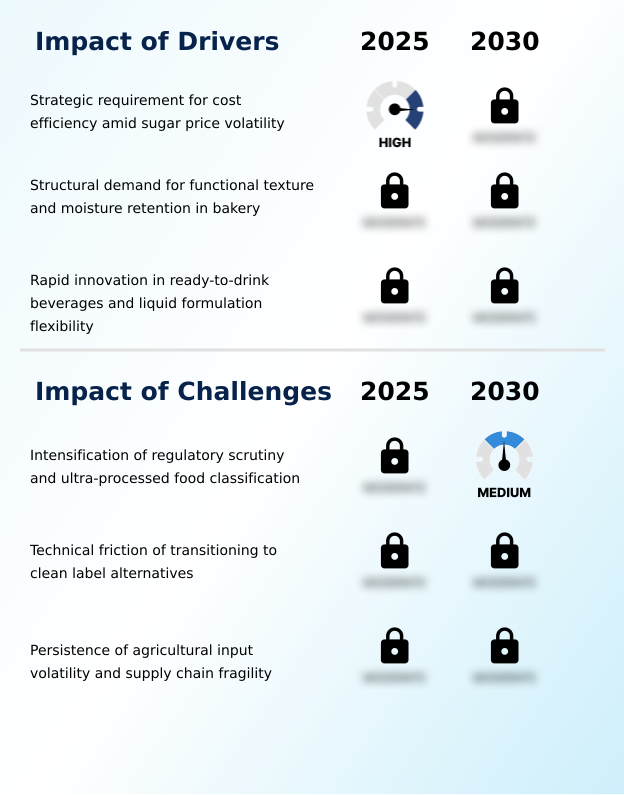
  • A primary driver shaping the market is the strategic requirement for cost efficiency in the face of ongoing sugar price volatility.

  • Market growth is primarily driven by economic and functional advantages in large-scale food manufacturing. The sweetener cost advantage over sucrose remains a powerful incentive, especially given persistent raw material volatility, making high-fructose corn syrup a cornerstone of cost-optimization strategy.
  • Functionally, its role as a moisture retention agent and its humectant properties are indispensable in the processed bakery ingredient sector.
  • For beverage applications, its high solubility and stability as an acid-stable sweetener make it ideal for automated blending systems used in carbonated soft drink formulation.
  • The transition to liquid sweetener formulation has streamlined production lines, with adoption rates in new beverage plants exceeding 80%. This combination of economic drivers and superior functional performance in high-volume food processing ensures its continued relevance.

What are the market trends shaping the High-fructose Corn Syrup Industry?

  • The market is observing a significant trend toward the expansion of precision fermentation. This is complemented by the adoption of enzyme-enhanced processing to improve manufacturing efficiency.

  • Key market trends revolve around enhancing production efficiency and expanding application scope. The adoption of precision fermentation efficiency is enabling the creation of highly specialized enzyme cocktails for enzymatic conversion technology, improving yields from the saccharification process. This move toward biocatalytic optimization reduces the energy and chemical inputs required in traditional isoglucose production.
  • This trend allows for more precise control over the final liquid carbohydrate source, with some advanced facilities achieving a 5% greater consistency in fructose-to-glucose ratio. Concurrently, there is growing demand for the ingredient as a non-food humectant use and a shelf-stable food additive, pushing the boundaries beyond its traditional role as a caloric sweetener.
  • The ongoing refinement of these technologies is critical for maintaining a competitive edge.

What challenges does the High-fructose Corn Syrup Industry face during its growth?

  • A key challenge for the industry stems from the intensification of regulatory scrutiny, particularly regarding the classification of products as ultra-processed foods.

  • The market confronts significant challenges from regulatory pressures and evolving consumer preferences. Intensifying regulatory scrutiny and the negative connotations of ultra-processed food classification are impacting consumer health perception, creating demand for clean label alternatives.
  • The technical difficulty of functional ingredient replacement poses a substantial hurdle, as few alternatives can match the sensory characteristic impact of high-fructose corn syrup at a comparable price. This is compounded by agricultural input costs and supply chain fragility, which can erode the ingredient's price advantage.
  • Manufacturers report that reformulating a single product line to remove corn syrup can increase R&D costs by up to 20%. Navigating these challenges requires a strategic focus on demonstrating functional necessity and managing supply chain risks effectively.

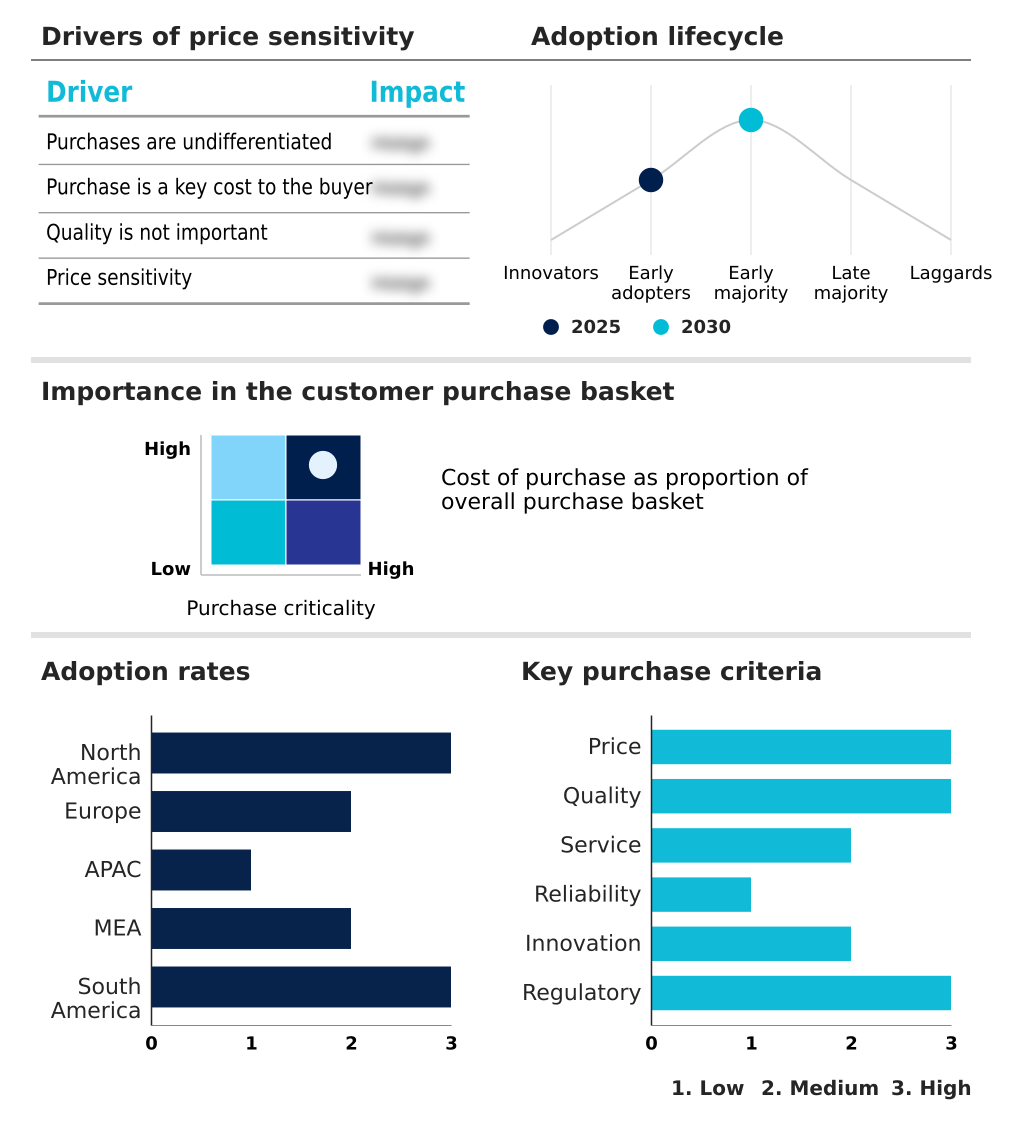
Exclusive Technavio Analysis on Customer Landscape

The high-fructose corn syrup market forecasting report includes the adoption lifecycle of the market, covering from the innovator’s stage to the laggard’s stage. It focuses on adoption rates in different regions based on penetration. Furthermore, the high-fructose corn syrup market report also includes key purchase criteria and drivers of price sensitivity to help companies evaluate and develop their market growth analysis strategies.

Customer Landscape of High-fructose Corn Syrup Industry

Competitive Landscape

Companies are implementing various strategies, such as strategic alliances, high-fructose corn syrup market forecast, partnerships, mergers and acquisitions, geographical expansion, and product/service launches, to enhance their presence in the industry.

AGRANA Beteiligungs AG - Offers glucose-fructose syrups with customized fructose ratios, engineered for large-scale industrial food and beverage applications.

The industry research and growth report includes detailed analyses of the competitive landscape of the market and information about key companies, including:

  • AGRANA Beteiligungs AG
  • Archer Daniels Midland Co.
  • Cargill Inc.
  • Dacheng Corn Group Co. Ltd
  • Daesang Corp.
  • FoodChem International Corp.
  • Ingredion Inc.
  • Luzhou Bio-Chem Technology
  • Prinova Group LLC
  • Qinhuangdao Lihua Starch Co.
  • Roquette Freres SA
  • Samyang Corp.
  • Sedamyl
  • Shandong Dongxiao Biotechnology
  • Sweetener Supply Corp.
  • Tate and Lyle Plc
  • Tereos SCA

Qualitative and quantitative analysis of companies has been conducted to help clients understand the wider business environment as well as the strengths and weaknesses of key industry players. Data is qualitatively analyzed to categorize companies as pure play, category-focused, industry-focused, and diversified; it is quantitatively analyzed to categorize companies as dominant, leading, strong, tentative, and weak.

Recent Development and News in High-fructose corn syrup market

  • In October 2024, Cargill Inc. announced a strategic investment to upgrade its corn wet-milling facilities, focusing on enhancing enzyme-enhanced processing to improve the efficiency and yield of its liquid sweetener formulation, aiming for a 10% reduction in energy consumption.
  • In December 2024, Ingredion Inc. launched a new portfolio of specialty HFCS blends, designed as a functional texturizer and moisture retention agent for clean label bakery alternatives, addressing the technical friction of replacing traditional ingredients.
  • In March 2025, Archer Daniels Midland Co. entered a partnership with a leading beverage manufacturer to implement advanced sweetener blending systems, enabling dynamic switching between HFCS-55 and other sweeteners to mitigate raw material volatility.
  • In May 2025, Tate and Lyle Plc received new regulatory approval for its pharmaceutical grade excipient line of high-fructose corn syrup, expanding its use as a liquid medication vehicle in pediatric formulations due to its effective taste-masking properties.

Dive into Technavio’s robust research methodology, blending expert interviews, extensive data synthesis, and validated models for unparalleled High-fructose Corn Syrup Market insights. See full methodology.

Market Scope
Page number 290
Base year 2025
Historic period 2020-2024
Forecast period 2026-2030
Growth momentum & CAGR Accelerate at a CAGR of 2.4%
Market growth 2026-2030 USD 840.1 million
Market structure Fragmented
YoY growth 2025-2026(%) 2.3%
Key countries US, Canada, Mexico, Germany, UK, France, Italy, Spain, The Netherlands, China, Japan, India, South Korea, Australia, Indonesia, Saudi Arabia, UAE, South Africa, Israel, Turkey, Brazil, Argentina and Chile
Competitive landscape Leading Companies, Market Positioning of Companies, Competitive Strategies, and Industry Risks

Request Free Sample

Research Analyst Overview

  • The high-fructose corn syrup market is underpinned by advanced industrial biotechnology, where processes like enzymatic isomerization and biocatalytic optimization are pivotal. The industry relies on glucose isomerase within corn wet-milling facilities to execute a saccharification process that creates a corn starch derivative with a specific fructose-to-glucose ratio.
  • This liquid sweetener formulation, whether HFCS-42 or HFCS-55, serves as a foundational caloric sweetener. Its utility extends beyond sweetness; its humectant properties and function as a moisture retention agent are critical for shelf-life extension. In baking, it aids Maillard reaction browning, while its non-crystallizing syrup nature makes it an ideal beverage stabilizer and functional texturizer.
  • The use of automated blending systems and liquid handling systems allows for a cost-optimization strategy, making it a volatility-resistant sweetener. For boardroom decisions, the choice to invest in enzyme-enhanced processing technology directly impacts operational expenditure, with some operators reporting a 15% reduction in processing costs.
  • This high brix syrup is also crucial in cold-fill beverage systems and ready-to-drink formulation, acting as an acid-stable sweetener. Its role as a microbial growth inhibitor through osmotic pressure control has also led to its use as a pharmaceutical grade excipient.

What are the Key Data Covered in this High-fructose Corn Syrup Market Research and Growth Report?

  • What is the expected growth of the High-fructose Corn Syrup Market between 2026 and 2030?

    • USD 840.1 million, at a CAGR of 2.4%

  • What segmentation does the market report cover?

    • The report is segmented by Application (Food and beverage, and Apiculture and pharmaceutical), Product Type (HFCS-55, HFCS-42, and Others), Distribution Channel (Offline, and Online) and Geography (North America, Europe, APAC, Middle East and Africa, South America)

  • Which regions are analyzed in the report?

    • North America, Europe, APAC, Middle East and Africa and South America

  • What are the key growth drivers and market challenges?

    • Strategic requirement for cost efficiency amid sugar price volatility, Intensification of regulatory scrutiny and ultra-processed food classification

  • Who are the major players in the High-fructose Corn Syrup Market?

    • AGRANA Beteiligungs AG, Archer Daniels Midland Co., Cargill Inc., Dacheng Corn Group Co. Ltd, Daesang Corp., FoodChem International Corp., Ingredion Inc., Luzhou Bio-Chem Technology, Prinova Group LLC, Qinhuangdao Lihua Starch Co., Roquette Freres SA, Samyang Corp., Sedamyl, Shandong Dongxiao Biotechnology, Sweetener Supply Corp., Tate and Lyle Plc and Tereos SCA

Market Research Insights

  • Market dynamics are shaped by a complex interplay of economic and technical factors. The persistent sweetener cost advantage is a primary consideration, though it is frequently tested by raw material volatility and agricultural input costs.
  • A major pressure point is the consumer-driven push for clean label alternatives, which creates friction for manufacturers concerned about sensory characteristic impact and functional ingredient replacement costs. The industry also navigates intense regulatory scrutiny and the ultra-processed food classification debate, which influences consumer health perception. Simultaneously, opportunities are emerging in non-food humectant use and apiculture feed supplements.
  • The efficiency of enzymatic conversion technology remains a competitive differentiator, especially for high-volume food processing in applications ranging from non-alcoholic beverage sweeteners and processed bakery ingredients to condiment formulation. The stability of the ingredient in products like fruit preparation sweeteners and as a savory snack ingredient continues to reinforce its position against supply chain fragility.

We can help! Our analysts can customize this high-fructose corn syrup market research report to meet your requirements.

Get in touch

1. Executive Summary

1.1 Market overview

Executive Summary - Chart on Market Overview
Executive Summary - Data Table on Market Overview
Executive Summary - Chart on Global Market Characteristics
Executive Summary - Chart on Market by Geography
Executive Summary - Chart on Market Segmentation by Application
Executive Summary - Chart on Market Segmentation by Product Type
Executive Summary - Chart on Market Segmentation by Distribution Channel
Executive Summary - Chart on Incremental Growth
Executive Summary - Data Table on Incremental Growth
Executive Summary - Chart on Company Market Positioning

2. Technavio Analysis

2.1 Analysis of price sensitivity, lifecycle, customer purchase basket, adoption rates, and purchase criteria

2.2 Criticality of inputs and Factors of differentiation

Chart on Overview on criticality of inputs and factors of differentiation

2.3 Factors of disruption

Chart on Overview on factors of disruption

2.4 Impact of drivers and challenges

Chart on Impact of drivers and challenges in 2025 and 2030

3. Market Landscape

3.1 Market ecosystem

Chart on Parent Market
Data Table on - Parent Market

3.2 Market characteristics

Chart on Market characteristics analysis

3.3 Value chain analysis

Chart on Value chain analysis

4. Market Sizing

4.1 Market definition

Data Table on Offerings of companies included in the market definition

4.2 Market segment analysis

Market segments

4.3 Market size 2025

4.4 Market outlook: Forecast for 2025-2030

Chart on Global - Market size and forecast 2025-2030 ($ million)
Data Table on Global - Market size and forecast 2025-2030 ($ million)
Chart on Global Market: Year-over-year growth 2025-2030 (%)
Data Table on Global Market: Year-over-year growth 2025-2030 (%)

5. Historic Market Size

5.1 Global High-Fructose Corn Syrup Market 2020 - 2024

Historic Market Size - Data Table on Global High-Fructose Corn Syrup Market 2020 - 2024 ($ million)

5.2 Application segment analysis 2020 - 2024

Historic Market Size - Application Segment 2020 - 2024 ($ million)

5.3 Product Type segment analysis 2020 - 2024

Historic Market Size - Product Type Segment 2020 - 2024 ($ million)

5.4 Distribution Channel segment analysis 2020 - 2024

Historic Market Size - Distribution Channel Segment 2020 - 2024 ($ million)

5.5 Geography segment analysis 2020 - 2024

Historic Market Size - Geography Segment 2020 - 2024 ($ million)

5.6 Country segment analysis 2020 - 2024

Historic Market Size - Country Segment 2020 - 2024 ($ million)

6. Qualitative Analysis

6.1 Impact of AI in global high-fructose corn syrup market

6.2 Impact of geopolitical conflict for global high-fructose corn syrup market

7. Five Forces Analysis

7.1 Five forces summary

Five forces analysis - Comparison between 2025 and 2030

7.2 Bargaining power of buyers

Bargaining power of buyers - Impact of key factors 2025 and 2030

7.3 Bargaining power of suppliers

Bargaining power of suppliers - Impact of key factors in 2025 and 2030

7.4 Threat of new entrants

Threat of new entrants - Impact of key factors in 2025 and 2030

7.5 Threat of substitutes

Threat of substitutes - Impact of key factors in 2025 and 2030

7.6 Threat of rivalry

Threat of rivalry - Impact of key factors in 2025 and 2030

7.7 Market condition

Chart on Market condition - Five forces 2025 and 2030

8. Market Segmentation by Application

8.1 Market segments

Chart on Application - Market share 2025-2030 (%)
Data Table on Application - Market share 2025-2030 (%)

8.2 Comparison by Application

Chart on Comparison by Application
Data Table on Comparison by Application

8.3 Food and beverage - Market size and forecast 2025-2030

Chart on Food and beverage - Market size and forecast 2025-2030 ($ million)
Data Table on Food and beverage - Market size and forecast 2025-2030 ($ million)
Chart on Food and beverage - Year-over-year growth 2025-2030 (%)
Data Table on Food and beverage - Year-over-year growth 2025-2030 (%)

8.4 Apiculture and pharmaceutical - Market size and forecast 2025-2030

Chart on Apiculture and pharmaceutical - Market size and forecast 2025-2030 ($ million)
Data Table on Apiculture and pharmaceutical - Market size and forecast 2025-2030 ($ million)
Chart on Apiculture and pharmaceutical - Year-over-year growth 2025-2030 (%)
Data Table on Apiculture and pharmaceutical - Year-over-year growth 2025-2030 (%)

8.5 Market opportunity by Application

Market opportunity by Application ($ million)
Data Table on Market opportunity by Application ($ million)

9. Market Segmentation by Product Type

9.1 Market segments

Chart on Product Type - Market share 2025-2030 (%)
Data Table on Product Type - Market share 2025-2030 (%)

9.2 Comparison by Product Type

Chart on Comparison by Product Type
Data Table on Comparison by Product Type

9.3 HFCS-55 - Market size and forecast 2025-2030

Chart on HFCS-55 - Market size and forecast 2025-2030 ($ million)
Data Table on HFCS-55 - Market size and forecast 2025-2030 ($ million)
Chart on HFCS-55 - Year-over-year growth 2025-2030 (%)
Data Table on HFCS-55 - Year-over-year growth 2025-2030 (%)

9.4 HFCS-42 - Market size and forecast 2025-2030

Chart on HFCS-42 - Market size and forecast 2025-2030 ($ million)
Data Table on HFCS-42 - Market size and forecast 2025-2030 ($ million)
Chart on HFCS-42 - Year-over-year growth 2025-2030 (%)
Data Table on HFCS-42 - Year-over-year growth 2025-2030 (%)

9.5 Others - Market size and forecast 2025-2030

Chart on Others - Market size and forecast 2025-2030 ($ million)
Data Table on Others - Market size and forecast 2025-2030 ($ million)
Chart on Others - Year-over-year growth 2025-2030 (%)
Data Table on Others - Year-over-year growth 2025-2030 (%)

9.6 Market opportunity by Product Type

Market opportunity by Product Type ($ million)
Data Table on Market opportunity by Product Type ($ million)

10. Market Segmentation by Distribution Channel

10.1 Market segments

Chart on Distribution Channel - Market share 2025-2030 (%)
Data Table on Distribution Channel - Market share 2025-2030 (%)

10.2 Comparison by Distribution Channel

Chart on Comparison by Distribution Channel
Data Table on Comparison by Distribution Channel

10.3 Offline - Market size and forecast 2025-2030

Chart on Offline - Market size and forecast 2025-2030 ($ million)
Data Table on Offline - Market size and forecast 2025-2030 ($ million)
Chart on Offline - Year-over-year growth 2025-2030 (%)
Data Table on Offline - Year-over-year growth 2025-2030 (%)

10.4 Online - Market size and forecast 2025-2030

Chart on Online - Market size and forecast 2025-2030 ($ million)
Data Table on Online - Market size and forecast 2025-2030 ($ million)
Chart on Online - Year-over-year growth 2025-2030 (%)
Data Table on Online - Year-over-year growth 2025-2030 (%)

10.5 Market opportunity by Distribution Channel

Market opportunity by Distribution Channel ($ million)
Data Table on Market opportunity by Distribution Channel ($ million)

11. Customer Landscape

11.1 Customer landscape overview

Analysis of price sensitivity, lifecycle, customer purchase basket, adoption rates, and purchase criteria

12. Geographic Landscape

12.1 Geographic segmentation

Chart on Market share by geography 2025-2030 (%)
Data Table on Market share by geography 2025-2030 (%)

12.2 Geographic comparison

Chart on Geographic comparison
Data Table on Geographic comparison

12.3 North America - Market size and forecast 2025-2030

Chart on North America - Market size and forecast 2025-2030 ($ million)
Data Table on North America - Market size and forecast 2025-2030 ($ million)
Chart on North America - Year-over-year growth 2025-2030 (%)
Data Table on North America - Year-over-year growth 2025-2030 (%)
Chart on Regional Comparison - North America
Data Table on Regional Comparison - North America

12.3.1 US - Market size and forecast 2025-2030

Chart on US - Market size and forecast 2025-2030 ($ million)
Data Table on US - Market size and forecast 2025-2030 ($ million)
Chart on US - Year-over-year growth 2025-2030 (%)
Data Table on US - Year-over-year growth 2025-2030 (%)

12.3.2 Canada - Market size and forecast 2025-2030

Chart on Canada - Market size and forecast 2025-2030 ($ million)
Data Table on Canada - Market size and forecast 2025-2030 ($ million)
Chart on Canada - Year-over-year growth 2025-2030 (%)
Data Table on Canada - Year-over-year growth 2025-2030 (%)

12.3.3 Mexico - Market size and forecast 2025-2030

Chart on Mexico - Market size and forecast 2025-2030 ($ million)
Data Table on Mexico - Market size and forecast 2025-2030 ($ million)
Chart on Mexico - Year-over-year growth 2025-2030 (%)
Data Table on Mexico - Year-over-year growth 2025-2030 (%)

12.4 Europe - Market size and forecast 2025-2030

Chart on Europe - Market size and forecast 2025-2030 ($ million)
Data Table on Europe - Market size and forecast 2025-2030 ($ million)
Chart on Europe - Year-over-year growth 2025-2030 (%)
Data Table on Europe - Year-over-year growth 2025-2030 (%)
Chart on Regional Comparison - Europe
Data Table on Regional Comparison - Europe

12.4.1 Germany - Market size and forecast 2025-2030

Chart on Germany - Market size and forecast 2025-2030 ($ million)
Data Table on Germany - Market size and forecast 2025-2030 ($ million)
Chart on Germany - Year-over-year growth 2025-2030 (%)
Data Table on Germany - Year-over-year growth 2025-2030 (%)

12.4.2 UK - Market size and forecast 2025-2030

Chart on UK - Market size and forecast 2025-2030 ($ million)
Data Table on UK - Market size and forecast 2025-2030 ($ million)
Chart on UK - Year-over-year growth 2025-2030 (%)
Data Table on UK - Year-over-year growth 2025-2030 (%)

12.4.3 France - Market size and forecast 2025-2030

Chart on France - Market size and forecast 2025-2030 ($ million)
Data Table on France - Market size and forecast 2025-2030 ($ million)
Chart on France - Year-over-year growth 2025-2030 (%)
Data Table on France - Year-over-year growth 2025-2030 (%)

12.4.4 Italy - Market size and forecast 2025-2030

Chart on Italy - Market size and forecast 2025-2030 ($ million)
Data Table on Italy - Market size and forecast 2025-2030 ($ million)
Chart on Italy - Year-over-year growth 2025-2030 (%)
Data Table on Italy - Year-over-year growth 2025-2030 (%)

12.4.5 Spain - Market size and forecast 2025-2030

Chart on Spain - Market size and forecast 2025-2030 ($ million)
Data Table on Spain - Market size and forecast 2025-2030 ($ million)
Chart on Spain - Year-over-year growth 2025-2030 (%)
Data Table on Spain - Year-over-year growth 2025-2030 (%)

12.4.6 The Netherlands - Market size and forecast 2025-2030

Chart on The Netherlands - Market size and forecast 2025-2030 ($ million)
Data Table on The Netherlands - Market size and forecast 2025-2030 ($ million)
Chart on The Netherlands - Year-over-year growth 2025-2030 (%)
Data Table on The Netherlands - Year-over-year growth 2025-2030 (%)

12.5 APAC - Market size and forecast 2025-2030

Chart on APAC - Market size and forecast 2025-2030 ($ million)
Data Table on APAC - Market size and forecast 2025-2030 ($ million)
Chart on APAC - Year-over-year growth 2025-2030 (%)
Data Table on APAC - Year-over-year growth 2025-2030 (%)
Chart on Regional Comparison - APAC
Data Table on Regional Comparison - APAC

12.5.1 China - Market size and forecast 2025-2030

Chart on China - Market size and forecast 2025-2030 ($ million)
Data Table on China - Market size and forecast 2025-2030 ($ million)
Chart on China - Year-over-year growth 2025-2030 (%)
Data Table on China - Year-over-year growth 2025-2030 (%)

12.5.2 Japan - Market size and forecast 2025-2030

Chart on Japan - Market size and forecast 2025-2030 ($ million)
Data Table on Japan - Market size and forecast 2025-2030 ($ million)
Chart on Japan - Year-over-year growth 2025-2030 (%)
Data Table on Japan - Year-over-year growth 2025-2030 (%)

12.5.3 India - Market size and forecast 2025-2030

Chart on India - Market size and forecast 2025-2030 ($ million)
Data Table on India - Market size and forecast 2025-2030 ($ million)
Chart on India - Year-over-year growth 2025-2030 (%)
Data Table on India - Year-over-year growth 2025-2030 (%)

12.5.4 South Korea - Market size and forecast 2025-2030

Chart on South Korea - Market size and forecast 2025-2030 ($ million)
Data Table on South Korea - Market size and forecast 2025-2030 ($ million)
Chart on South Korea - Year-over-year growth 2025-2030 (%)
Data Table on South Korea - Year-over-year growth 2025-2030 (%)

12.5.5 Australia - Market size and forecast 2025-2030

Chart on Australia - Market size and forecast 2025-2030 ($ million)
Data Table on Australia - Market size and forecast 2025-2030 ($ million)
Chart on Australia - Year-over-year growth 2025-2030 (%)
Data Table on Australia - Year-over-year growth 2025-2030 (%)

12.5.6 Indonesia - Market size and forecast 2025-2030

Chart on Indonesia - Market size and forecast 2025-2030 ($ million)
Data Table on Indonesia - Market size and forecast 2025-2030 ($ million)
Chart on Indonesia - Year-over-year growth 2025-2030 (%)
Data Table on Indonesia - Year-over-year growth 2025-2030 (%)

12.6 Middle East and Africa - Market size and forecast 2025-2030

Chart on Middle East and Africa - Market size and forecast 2025-2030 ($ million)
Data Table on Middle East and Africa - Market size and forecast 2025-2030 ($ million)
Chart on Middle East and Africa - Year-over-year growth 2025-2030 (%)
Data Table on Middle East and Africa - Year-over-year growth 2025-2030 (%)
Chart on Regional Comparison - Middle East and Africa
Data Table on Regional Comparison - Middle East and Africa

12.6.1 Saudi Arabia - Market size and forecast 2025-2030

Chart on Saudi Arabia - Market size and forecast 2025-2030 ($ million)
Data Table on Saudi Arabia - Market size and forecast 2025-2030 ($ million)
Chart on Saudi Arabia - Year-over-year growth 2025-2030 (%)
Data Table on Saudi Arabia - Year-over-year growth 2025-2030 (%)

12.6.2 UAE - Market size and forecast 2025-2030

Chart on UAE - Market size and forecast 2025-2030 ($ million)
Data Table on UAE - Market size and forecast 2025-2030 ($ million)
Chart on UAE - Year-over-year growth 2025-2030 (%)
Data Table on UAE - Year-over-year growth 2025-2030 (%)

12.6.3 South Africa - Market size and forecast 2025-2030

Chart on South Africa - Market size and forecast 2025-2030 ($ million)
Data Table on South Africa - Market size and forecast 2025-2030 ($ million)
Chart on South Africa - Year-over-year growth 2025-2030 (%)
Data Table on South Africa - Year-over-year growth 2025-2030 (%)

12.6.4 Israel - Market size and forecast 2025-2030

Chart on Israel - Market size and forecast 2025-2030 ($ million)
Data Table on Israel - Market size and forecast 2025-2030 ($ million)
Chart on Israel - Year-over-year growth 2025-2030 (%)
Data Table on Israel - Year-over-year growth 2025-2030 (%)

12.6.5 Turkey - Market size and forecast 2025-2030

Chart on Turkey - Market size and forecast 2025-2030 ($ million)
Data Table on Turkey - Market size and forecast 2025-2030 ($ million)
Chart on Turkey - Year-over-year growth 2025-2030 (%)
Data Table on Turkey - Year-over-year growth 2025-2030 (%)

12.7 South America - Market size and forecast 2025-2030

Chart on South America - Market size and forecast 2025-2030 ($ million)
Data Table on South America - Market size and forecast 2025-2030 ($ million)
Chart on South America - Year-over-year growth 2025-2030 (%)
Data Table on South America - Year-over-year growth 2025-2030 (%)
Chart on Regional Comparison - South America
Data Table on Regional Comparison - South America

12.7.1 Brazil - Market size and forecast 2025-2030

Chart on Brazil - Market size and forecast 2025-2030 ($ million)
Data Table on Brazil - Market size and forecast 2025-2030 ($ million)
Chart on Brazil - Year-over-year growth 2025-2030 (%)
Data Table on Brazil - Year-over-year growth 2025-2030 (%)

12.7.2 Argentina - Market size and forecast 2025-2030

Chart on Argentina - Market size and forecast 2025-2030 ($ million)
Data Table on Argentina - Market size and forecast 2025-2030 ($ million)
Chart on Argentina - Year-over-year growth 2025-2030 (%)
Data Table on Argentina - Year-over-year growth 2025-2030 (%)

12.7.3 Chile - Market size and forecast 2025-2030

Chart on Chile - Market size and forecast 2025-2030 ($ million)
Data Table on Chile - Market size and forecast 2025-2030 ($ million)
Chart on Chile - Year-over-year growth 2025-2030 (%)
Data Table on Chile - Year-over-year growth 2025-2030 (%)

12.8 Market opportunity by geography

Market opportunity by geography ($ million)
Data Tables on Market opportunity by geography ($ million)

13. Drivers, Challenges, and Opportunity

13.1 Market drivers

Strategic requirement for cost efficiency amid sugar price volatility
Structural demand for functional texture and moisture retention in bakery
Rapid innovation in ready-to-drink beverages and liquid formulation flexibility

13.2 Market challenges

Intensification of regulatory scrutiny and ultra-processed food classification
Technical friction of transitioning to clean label alternatives
Persistence of agricultural input volatility and supply chain fragility

13.3 Impact of drivers and challenges

Impact of drivers and challenges in 2025 and 2030

13.4 Market opportunities

Expansion of precision fermentation and enzyme-enhanced processing efficiency
Inclusion of cost-optimization and volatility-resistant sweetener
Increase of pharmaceutical-grade excipients and non-food humectant

14. Competitive Landscape

14.1 Overview

14.2

Overview on criticality of inputs and factors of differentiation

14.3 Landscape disruption

Overview on factors of disruption

14.4 Industry risks

Impact of key risks on business

15. Competitive Analysis

15.1 Companies profiled

Companies covered

15.2 Company ranking index

15.3 Market positioning of companies

Matrix on companies position and classification

15.4 AGRANA Beteiligungs AG

AGRANA Beteiligungs AG - Overview
AGRANA Beteiligungs AG - Business segments
AGRANA Beteiligungs AG - Key offerings
AGRANA Beteiligungs AG - Segment focus
SWOT

15.5 Archer Daniels Midland Co.

Archer Daniels Midland Co. - Overview
Archer Daniels Midland Co. - Business segments
Archer Daniels Midland Co. - Key news
Archer Daniels Midland Co. - Key offerings
Archer Daniels Midland Co. - Segment focus
SWOT

15.6 Cargill Inc.

Cargill Inc. - Overview
Cargill Inc. - Product / Service
Cargill Inc. - Key news
Cargill Inc. - Key offerings
SWOT

15.7 Dacheng Corn Group Co. Ltd

Dacheng Corn Group Co. Ltd - Overview
Dacheng Corn Group Co. Ltd - Business segments
Dacheng Corn Group Co. Ltd - Key offerings
Dacheng Corn Group Co. Ltd - Segment focus
SWOT

15.8 Daesang Corp.

Daesang Corp. - Overview
Daesang Corp. - Business segments
Daesang Corp. - Key offerings
Daesang Corp. - Segment focus
SWOT

15.9 FoodChem International Corp.

FoodChem International Corp. - Overview
FoodChem International Corp. - Product / Service
FoodChem International Corp. - Key offerings
SWOT

15.10 Ingredion Inc.

Ingredion Inc. - Overview
Ingredion Inc. - Business segments
Ingredion Inc. - Key offerings
Ingredion Inc. - Segment focus
SWOT

15.11 Luzhou Bio-Chem Technology

Luzhou Bio-Chem Technology - Overview
Luzhou Bio-Chem Technology - Product / Service
Luzhou Bio-Chem Technology - Key offerings
SWOT

15.12 Prinova Group LLC

Prinova Group LLC - Overview
Prinova Group LLC - Product / Service
Prinova Group LLC - Key offerings
SWOT

15.13 Roquette Freres SA

Roquette Freres SA - Overview
Roquette Freres SA - Product / Service
Roquette Freres SA - Key offerings
SWOT

15.14 Samyang Corp.

Samyang Corp. - Overview
Samyang Corp. - Product / Service
Samyang Corp. - Key offerings
SWOT

15.15 Sedamyl

Sedamyl - Overview
Sedamyl - Product / Service
Sedamyl - Key offerings
SWOT

15.16 Sweetener Supply Corp.

Sweetener Supply Corp. - Overview
Sweetener Supply Corp. - Product / Service
Sweetener Supply Corp. - Key offerings
SWOT

15.17 Tate and Lyle Plc

Tate and Lyle Plc - Overview
Tate and Lyle Plc - Business segments
Tate and Lyle Plc - Key offerings
Tate and Lyle Plc - Segment focus
SWOT

15.18 Tereos SCA

Tereos SCA - Overview
Tereos SCA - Product / Service
Tereos SCA - Key offerings
SWOT

16. Appendix

16.1 Scope of the report

Market definition
Objectives
Notes and caveats

16.2 Inclusions and exclusions checklist

Inclusions checklist
Exclusions checklist

16.3 Currency conversion rates for US$

16.4 Research methodology

16.5 Data procurement

Information sources

16.6 Data validation

16.7 Validation techniques employed for market sizing

16.8 Data synthesis

16.9 360 degree market analysis

16.10 List of abbreviations

Research Methodology

Technavio presents a detailed picture of the market by way of study, synthesis, and summation of data from multiple sources. The analysts have presented the various facets of the market with a particular focus on identifying the key industry influencers. The data thus presented is comprehensive, reliable, and the result of extensive research, both primary and secondary.

INFORMATION SOURCES

Primary sources

  • Manufacturers and suppliers
  • Channel partners
  • Industry experts
  • Strategic decision makers

Secondary sources

  • Industry journals and periodicals
  • Government data
  • Financial reports of key industry players
  • Historical data
  • Press releases

DATA ANALYSIS

Data Synthesis

  • Collation of data
  • Estimation of key figures
  • Analysis of derived insights

Data Validation

  • Triangulation with data models
  • Reference against proprietary databases
  • Corroboration with industry experts

REPORT WRITING

Qualitative

  • Market drivers
  • Market challenges
  • Market trends
  • Five forces analysis

Quantitative

  • Market size and forecast
  • Market segmentation
  • Geographical insights
  • Competitive landscape

Interested in this report?

Get your sample now to see our research methodology and insights!

Download Now

Frequently Asked Questions

High-fructose Corn Syrup market growth will increase by USD 840.1 million during 2026-2030.

The High-fructose Corn Syrup market is expected to grow at a CAGR of 2.4% during 2026-2030.

High-fructose Corn Syrup market is segmented by Application (Food and beverage, Apiculture and pharmaceutical) Product type (HFCS-55, HFCS-42, Others) Distribution channel (Offline, Online)

AGRANA Beteiligungs AG, Archer Daniels Midland Co., Cargill Inc., Dacheng Corn Group Co. Ltd, Daesang Corp., FoodChem International Corp., Ingredion Inc., Luzhou Bio-Chem Technology, Prinova Group LLC, Qinhuangdao Lihua Starch Co., Roquette Freres SA, Samyang Corp., Sedamyl, Shandong Dongxiao Biotechnology, Sweetener Supply Corp., Tate and Lyle Plc, Tereos SCA are a few of the key vendors in the High-fructose Corn Syrup market.

North America will register the highest growth rate of 44.6% among the other regions. Therefore, the High-fructose Corn Syrup market in North America is expected to garner significant business opportunities for the vendors during the forecast period.

US, Canada, Mexico, Germany, UK, France, Italy, Spain, The Netherlands, China, Japan, India, South Korea, Australia, Indonesia, Saudi Arabia, UAE, South Africa, Israel, Turkey, Brazil, Argentina, Chile

  • Strategic requirement for cost efficiency amid sugar price volatility is the driving factor this market.

The High-fructose Corn Syrup market vendors should focus on grabbing business opportunities from the Application segment as it accounted for the largest market share in the base year.
RIA - Research AI Assistant
Ask RIA