Tail Lift Market Analysis Europe, North America, APAC, Middle East and Africa, South America - Germany, US, China, Japan, UK - Size and Forecast 2024-2028

Tail Lift Market Analysis Europe, North America, APAC, Middle East and Africa, South America - Germany, US, China, Japan, UK - Size and Forecast 2024-2028

Published: Jul 2024 141 Pages SKU: IRTNTR73262

Market Overview at a Glance

$1.28 B
Market Opportunity
14.76%
CAGR
12.55
YoY growth 2023-2024(%)

Tail Lift Market Size 2024-2028

The tail lift market size is forecast to increase by USD 1.28 billion at a CAGR of 14.76% between 2023 and 2028.

  • The market is experiencing significant growth due to the expansion of the retail industry, which relies heavily on the efficient transportation and handling of goods. Another key trend driving market growth is the increasing availability of safety devices for tail lifts, which address concerns related to worker safety and regulatory compliance. However, the high cost of operating tail lifts remains a challenge for market growth, as businesses seek cost-effective solutions to meet their logistics needs. Overall, the market is poised for continued expansion, driven by the evolving needs of industries such as retail, construction, and manufacturing.

What will be the Size of the Tail Lift Market During the Forecast Period?

Tail Lift Market Size

 Request Free Sample

  • The market caters to the demand for efficient and safe loading and unloading solutions for various goods, particularly in delivery and transportation operations. Automated tail lift systems have gained significant traction due to their ability to enhance business productivity and reduce workplace injuries and accidents. By minimizing manual labor and the need for employees to manually handle heavy cargo at ground level, these systems contribute to a safer working environment and lower insurance costs. Furthermore, tail lifts offer long-term savings through reduced labor costs and fuel efficiency. They are suitable for various cargo types, including medical gas cylinders and heavy materials, and can accommodate different lifting capacities and platform sizes.
  • Tail lifts for delivery trucks and other vehicles enable efficient handling of goods, ensuring minimal damage during the loading and unloading process. Innovative design and advanced technology continue to shape the market, with a focus on improving safety, reducing operational costs, and increasing overall efficiency. Factors to consider when selecting a tail lift include lifting capacity, platform size, and compatibility with specific vehicle types. By investing in a tail lift, businesses can streamline their operations, improve workplace safety, and ultimately, enhance their bottom line.

How is this Tail Lift Industry segmented and which is the largest segment?

The tail lift industry research report provides comprehensive data (region-wise segment analysis), with forecasts and estimates in "USD million" for the period 2024-2028, as well as historical data from 2018-2022 for the following segments.

  • Product
    • Cantilever lifts
    • Slider tail lifts
    • Tuck away lifts
    • Column lifts
  • Geography
    • Europe
      • Germany
      • UK
    • North America
      • US
    • APAC
      • China
      • Japan
    • Middle East and Africa
    • South America

By Product Insights

  • The cantilever lifts segment is estimated to witness significant growth during the forecast period.

Cantilever lifts are essential tools for handling heavy loads in various industries, including construction, waste management, and transportation. These lifts, which can be installed on distribution vans, trailers, and trucks, offer numerous benefits such as increased business productivity, improved workplace safety, and reduced labor costs. They come in various sizes and lifting capacities, ranging from 500 kg to over 4,000 kg.

Cantilever lifts are equipped with tilting platforms that can function as doors, making loading and unloading more efficient. They offer long-term savings through reduced fuel consumption and decreased damage to goods. Additionally, they provide a safer working environment by minimizing workplace injuries and accidents. However, factors to consider when selecting a cantilever lift include lifting capacity, platform size, compatibility with the vehicle, durability, and maintenance requirements. Automated systems are available for cantilever lifts, enhancing the efficiency and accuracy of deliveries. Innovative designs and advanced technology contribute to improved fuel efficiency, reducing fuel costs. The system of hydraulics, which includes a pump, cylinders, and fluid reservoir, generates mechanical force to lift the load.

Tail Lift Market Size

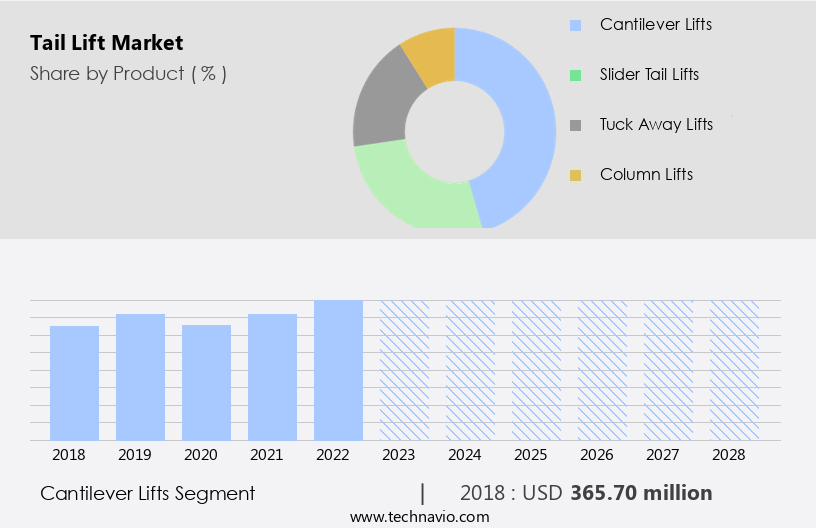
Get a glance at the  Tail Lift Industry report of share of various segments Request Free Sample

The cantilever lifts segment was valued at USD 365.70 billion in 2018 and showed a gradual increase during the forecast period.

Regional Analysis

  • Europe is estimated to contribute 52% to the growth of the global market during the forecast period.

Technavio's analysts have elaborately explained the regional trends and drivers that shape the market during the forecast period.

Tail Lift Market Share by Geography

For more insights on the market share of various regions, Request Free Sample

The European market holds a significant share of the global tail lift industry, driven by the expansion of the retail sector and the presence of numerous companies. Major contributors to the European market revenue include Germany, France, the UK, Italy, and Spain. The increasing sales of commercial vehicles (CVs) in Europe are fueling market growth. Europe is projected to experience the highest demand for tail lifts from 2022 to 2026, with the Americas and APAC following closely. Tail lifts play a crucial role in optimizing loading and unloading processes, ensuring workplace safety, and reducing labor costs. They facilitate efficient cargo handling, minimize damage to goods, and contribute to long-term savings through fuel efficiency.

Industries such as construction, waste management, and transportation operations benefit significantly from tail lift technology. Key factors to consider when selecting a tail lift include lifting capacity, platform size, compatibility, durability, and maintenance requirements. Innovative designs and advanced technology enhance operational efficiency and workplace safety while reducing insurance costs and workplace injuries. Case studies and success stories demonstrate the tangible benefits of tail lift solutions in various industries, including medical gas cylinder delivery and heavy material handling at ground level. Tail lifts installed on delivery trucks and other vehicles streamline operations, reduce fuel costs, and contribute to overall business productivity.

Market Dynamics

Our researchers analyzed the data with 2023 as the base year, along with the key drivers, trends, and challenges. A holistic analysis of drivers will help companies refine their marketing strategies to gain a competitive advantage.

What are the key market drivers leading to the rise in the adoption of Tail Lift Industry?

The growth of the retail industry is the key driver of the market.

  • The market is experiencing significant growth due to the increasing demand for automated systems in loading and unloading goods from delivery vehicles. In various industries, including construction and waste management, the implementation of tail lifts has led to increased business productivity, safety, and workplace injury reduction. Tail lifts enable the efficient handling of cargo, reducing labor costs and fuel consumption. They also offer long-term savings through damage prevention to goods and vehicles. Factors to consider when selecting a tail lift include lifting capacity, platform size, compatibility with different types of vehicles, durability, and maintenance requirements. Innovative designs and advanced technology have led to the development of tail lifts with increased fuel efficiency and compatibility with various industries' specific needs.
  • For instance, in medical gas cylinder transportation, tail lifts have been instrumental in ensuring safe and efficient loading and unloading. Case studies and success stories show the tangible benefits of tail lifts in transportation operations. For example, a delivery truck company reported a 30% increase in productivity and a 25% reduction in fuel costs after implementing tail lifts. The system of hydraulics, pumps, cylinders, and fluid reservoirs work together to generate mechanical force, making the process of loading and unloading more efficient and less physically demanding for employees.

What are the market trends shaping the Tail Lift Industry?

The availability of safety devices for tail lifts is the upcoming market trend.

  • Tail lifts play a crucial role in the loading and unloading process of various industries, including construction, waste management, and transportation operations. These automated systems enable efficient deliveries and enhance business productivity by reducing labor costs and fuel efficiency. However, the safety of employees during the operation of tail lifts is a significant concern. To mitigate workplace injuries and accidents, innovative designs and advanced technology are being integrated into tail lifts.
  • Additionally, a foot protector, a photoelectric retro-reflective sensor, is integrated to detect the operator's feet when the tail lift is moving up, ceasing operations if necessary. Long-term savings can be achieved through damage reduction to goods, lower insurance costs, and reduced labor costs. Factors to consider when purchasing a tail lift include lifting capacity, platform size, compatibility, durability, and maintenance requirements. Success stories and case studies highlight the tangible benefits of tail lifts in various industries, such as medical gas cylinder deliveries and heavy material handling at ground level. The system of hydraulics, including pumps, cylinders, and fluid reservoirs, provides mechanical force to lift cargo onto delivery trucks.
  • Overall, tail lifts offer significant benefits to businesses while ensuring a safe working environment.

What challenges does the Tail Lift Industry face during its growth?

The high cost of operating tail lifts is a key challenge affecting the industry growth.

  • Tail lifts are essential components in various industries for loading and unloading goods from delivery trucks at ground level. The market for tail lifts caters to the needs of construction, waste management, and other sectors where cargo handling is a daily requirement. The automated system of tail lifts enhances business productivity by reducing labor costs and fuel efficiency. However, the initial investment and maintenance requirements are significant. The cost of a tail lift depends on factors such as lifting capacity, platform size, and compatibility with different types of vehicles. For instance, a tail lift for handling heavy materials like medical gas cylinders or construction debris may be more expensive than one for a delivery truck.
  • The system's durability and maintenance requirements also impact long-term savings. Safety is a crucial consideration in the market. Workplace injuries and accidents due to manual loading and unloading can result in medical expenses, insurance costs, and damage to goods. Advanced technology and innovative design in tail lifts ensure a safer working environment for employees. Case studies and success stories highlight the tangible benefits of tail lifts in real-world scenarios. For example, a construction company reported a 30% reduction in labor costs after implementing tail lifts in their operations. A waste management company reported a 25% reduction in fuel costs due to increased efficiency in cargo handling.

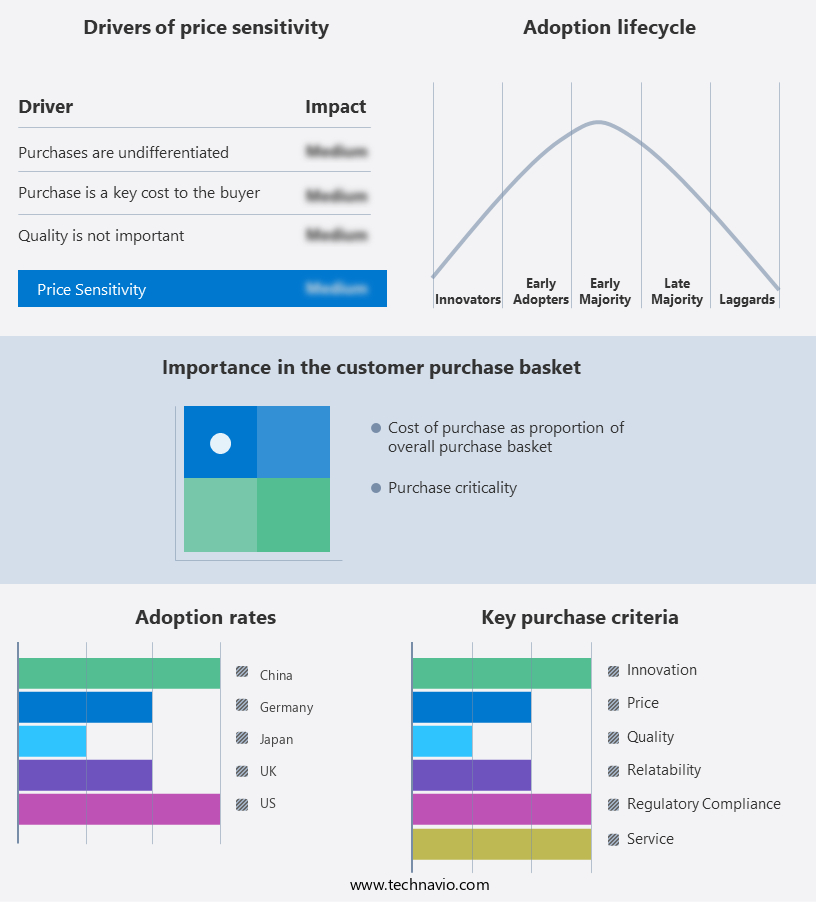
Exclusive Customer Landscape

The market forecasting report includes the adoption lifecycle of the market, covering from the innovator's stage to the laggard's stage. It focuses on adoption rates in different regions based on penetration. Furthermore, the tail lift market report also includes key purchase criteria and drivers of price sensitivity to help companies evaluate and develop their market growth analysis strategies.

Tail Lift Market Share by Geography

 Customer Landscape

Key Companies & Market Insights

Companies are implementing various strategies, such as strategic alliances, market forecast, partnerships, mergers and acquisitions, geographical expansion, and product/service launches, to enhance their presence in the industry.

The industry research and growth report includes detailed analyses of the competitive landscape of the market and information about key companies, including:

  • Anteo S P A
  • behrens loading systems B V
  • Cargotec Corp.
  • Dautel GMBH
  • Dhollandia N V
  • Gerd Bar GmbH
  • Maxon lift Corp
  • PALFINGER AG
  • Penny Hydraulics Ltd
  • Sorensen Hydraulik GMBH
  • Tailifts South Africa Pty Ltd
  • Tuffman Group
  • Woodbine Manufacturing Co.

Qualitative and quantitative analysis of companies has been conducted to help clients understand the wider business environment as well as the strengths and weaknesses of key industry players. Data is qualitatively analyzed to categorize companies as pure play, category-focused, industry-focused, and diversified; it is quantitatively analyzed to categorize companies as dominant, leading, strong, tentative, and weak.

Research Analyst Overview

The market encompasses automated systems designed to facilitate the loading and unloading of goods from delivery vehicles. These systems play a crucial role in enhancing business productivity and ensuring a safe working environment. By streamlining the process of loading and unloading, tail lifts help reduce workplace injuries and accidents, leading to lower insurance costs. Construction sites and waste management companies are among the various industries that heavily rely on tail lifts. The use of these systems enables the efficient handling of heavy materials, such as construction equipment and waste containers, at ground level. This not only saves labor costs but also increases fuel efficiency by minimizing the need for manual labor and multiple trips.

Moreover, the adoption of tail lifts has been driven by the need to minimize damage to goods during transportation. The innovative design and advanced technology used in these systems ensures a smooth and secure transfer of cargo from the vehicle to the ground. The mechanical force required for lifting is generated through a system of hydraulics, which includes a pump, cylinders, and a fluid reservoir. When considering the implementation of a tail lift system, several factors must be taken into account. Lifting capacity, platform size, and fleet management are essential considerations, as they will determine the system's ability to handle the weight and dimensions of the goods being transported.

Furthermore, compatibility with the delivery truck and durability are also crucial factors, as the system must be able to withstand the rigors of daily use. Maintenance requirements are another essential factor to consider. Regular maintenance is necessary to ensure the system operates efficiently and safely. Case studies and success stories from companies that have implemented tail lift systems demonstrate the tangible benefits, including increased productivity, reduced labor costs, and improved workplace safety. Real-world scenarios illustrate the importance of tail lifts in various industries. For instance, in the medical gas cylinder industry, tail lifts enable the safe and efficient handling of heavy cylinders, ensuring timely deliveries and reducing the risk of accidents.

Market Scope

Report Coverage

Details

Page number

141

Base year

2023

Historic period

2018-2022

Forecast period

2024-2028

Growth momentum & CAGR

Accelerate at a CAGR of 14.76%

Market Growth 2024-2028

USD 1.28 billion

Market structure

Concentrated

YoY growth 2023-2024(%)

12.55

Key countries

Germany, US, China, Japan, and UK

Competitive landscape

Leading Companies, Market Positioning of Companies, Competitive Strategies, and Industry Risks

Request Free Sample

What are the Key Data Covered in this Tail Lift Market Research and Growth Report?

  • CAGR of the Tail Lift industry during the forecast period
  • Detailed information on factors that will drive the market growth and forecasting between 2024 and 2028
  • Precise estimation of the size of the market and its contribution of the industry in focus to the parent market
  • Accurate predictions about upcoming growth and trends and changes in consumer behaviour
  • Growth of the market across Europe, North America, APAC, Middle East and Africa, and South America
  • Thorough analysis of the market's competitive landscape and detailed information about companies
  • Comprehensive analysis of factors that will challenge the tail lift market growth of industry companies

We can help! Our analysts can customize this tail lift market research report to meet your requirements.

Get in touch

1 Executive Summary

  • 1.1 Market overview
    • Executive Summary - Chart on Market Overview
    • Executive Summary - Data Table on Market Overview
    • Executive Summary - Chart on Global Market Characteristics
    • Executive Summary - Chart on Market by Geography
    • Executive Summary - Chart on Market Segmentation by Product
    • Executive Summary - Chart on Incremental Growth
    • Executive Summary - Data Table on Incremental Growth
    • Executive Summary - Chart on Company Market Positioning

2 Market Landscape

  • 2.1 Market ecosystem
    • Parent Market
    • Data Table on - Parent Market
  • 2.2 Market characteristics
    • Market characteristics analysis
  • 2.3 Value chain analysis
    • Value Chain Analysis

3 Market Sizing

  • 3.1 Market definition
    • Offerings of companies included in the market definition
  • 3.2 Market segment analysis
    • Market segments
  • 3.3 Market size 2023
    • 3.4 Market outlook: Forecast for 2023-2028
      • Chart on Global - Market size and forecast 2023-2028 ($ million)
      • Data Table on Global - Market size and forecast 2023-2028 ($ million)
      • Chart on Global Market: Year-over-year growth 2023-2028 (%)
      • Data Table on Global Market: Year-over-year growth 2023-2028 (%)

    4 Historic Market Size

    • 4.1 Global Tail Lift Market 2018 - 2022
      • Historic Market Size - Data Table on Global Tail Lift Market 2018 - 2022 ($ million)
    • 4.2 Product segment analysis 2018 - 2022
      • Historic Market Size - Product Segment 2018 - 2022 ($ million)
    • 4.3 Geography segment analysis 2018 - 2022
      • Historic Market Size - Geography Segment 2018 - 2022 ($ million)
    • 4.4 Country segment analysis 2018 - 2022
      • Historic Market Size - Country Segment 2018 - 2022 ($ million)

    5 Five Forces Analysis

    • 5.1 Five forces summary
      • Five forces analysis - Comparison between 2023 and 2028
    • 5.2 Bargaining power of buyers
      • Bargaining power of buyers - Impact of key factors 2023 and 2028
    • 5.3 Bargaining power of suppliers
      • Bargaining power of suppliers - Impact of key factors in 2023 and 2028
    • 5.4 Threat of new entrants
      • Threat of new entrants - Impact of key factors in 2023 and 2028
    • 5.5 Threat of substitutes
      • Threat of substitutes - Impact of key factors in 2023 and 2028
    • 5.6 Threat of rivalry
      • Threat of rivalry - Impact of key factors in 2023 and 2028
    • 5.7 Market condition
      • Chart on Market condition - Five forces 2023 and 2028

    6 Market Segmentation by Product

    • 6.1 Market segments
      • Chart on Product - Market share 2023-2028 (%)
      • Data Table on Product - Market share 2023-2028 (%)
    • 6.2 Comparison by Product
      • Chart on Comparison by Product
      • Data Table on Comparison by Product
    • 6.3 Cantilever lifts - Market size and forecast 2023-2028
      • Chart on Cantilever lifts - Market size and forecast 2023-2028 ($ million)
      • Data Table on Cantilever lifts - Market size and forecast 2023-2028 ($ million)
      • Chart on Cantilever lifts - Year-over-year growth 2023-2028 (%)
      • Data Table on Cantilever lifts - Year-over-year growth 2023-2028 (%)
    • 6.4 Slider tail lifts - Market size and forecast 2023-2028
      • Chart on Slider tail lifts - Market size and forecast 2023-2028 ($ million)
      • Data Table on Slider tail lifts - Market size and forecast 2023-2028 ($ million)
      • Chart on Slider tail lifts - Year-over-year growth 2023-2028 (%)
      • Data Table on Slider tail lifts - Year-over-year growth 2023-2028 (%)
    • 6.5 Tuck away lifts - Market size and forecast 2023-2028
      • Chart on Tuck away lifts - Market size and forecast 2023-2028 ($ million)
      • Data Table on Tuck away lifts - Market size and forecast 2023-2028 ($ million)
      • Chart on Tuck away lifts - Year-over-year growth 2023-2028 (%)
      • Data Table on Tuck away lifts - Year-over-year growth 2023-2028 (%)
    • 6.6 Column lifts - Market size and forecast 2023-2028
      • Chart on Column lifts - Market size and forecast 2023-2028 ($ million)
      • Data Table on Column lifts - Market size and forecast 2023-2028 ($ million)
      • Chart on Column lifts - Year-over-year growth 2023-2028 (%)
      • Data Table on Column lifts - Year-over-year growth 2023-2028 (%)
    • 6.7 Market opportunity by Product
      • Market opportunity by Product ($ million)
      • Data Table on Market opportunity by Product ($ million)

    7 Customer Landscape

    • 7.1 Customer landscape overview
      • Analysis of price sensitivity, lifecycle, customer purchase basket, adoption rates, and purchase criteria

    8 Geographic Landscape

    • 8.1 Geographic segmentation
      • Chart on Market share by geography 2023-2028 (%)
      • Data Table on Market share by geography 2023-2028 (%)
    • 8.2 Geographic comparison
      • Chart on Geographic comparison
      • Data Table on Geographic comparison
    • 8.3 Europe - Market size and forecast 2023-2028
      • Chart on Europe - Market size and forecast 2023-2028 ($ million)
      • Data Table on Europe - Market size and forecast 2023-2028 ($ million)
      • Chart on Europe - Year-over-year growth 2023-2028 (%)
      • Data Table on Europe - Year-over-year growth 2023-2028 (%)
    • 8.4 North America - Market size and forecast 2023-2028
      • Chart on North America - Market size and forecast 2023-2028 ($ million)
      • Data Table on North America - Market size and forecast 2023-2028 ($ million)
      • Chart on North America - Year-over-year growth 2023-2028 (%)
      • Data Table on North America - Year-over-year growth 2023-2028 (%)
    • 8.5 APAC - Market size and forecast 2023-2028
      • Chart on APAC - Market size and forecast 2023-2028 ($ million)
      • Data Table on APAC - Market size and forecast 2023-2028 ($ million)
      • Chart on APAC - Year-over-year growth 2023-2028 (%)
      • Data Table on APAC - Year-over-year growth 2023-2028 (%)
    • 8.6 Middle East and Africa - Market size and forecast 2023-2028
      • Chart on Middle East and Africa - Market size and forecast 2023-2028 ($ million)
      • Data Table on Middle East and Africa - Market size and forecast 2023-2028 ($ million)
      • Chart on Middle East and Africa - Year-over-year growth 2023-2028 (%)
      • Data Table on Middle East and Africa - Year-over-year growth 2023-2028 (%)
    • 8.7 South America - Market size and forecast 2023-2028
      • Chart on South America - Market size and forecast 2023-2028 ($ million)
      • Data Table on South America - Market size and forecast 2023-2028 ($ million)
      • Chart on South America - Year-over-year growth 2023-2028 (%)
      • Data Table on South America - Year-over-year growth 2023-2028 (%)
    • 8.8 Germany - Market size and forecast 2023-2028
      • Chart on Germany - Market size and forecast 2023-2028 ($ million)
      • Data Table on Germany - Market size and forecast 2023-2028 ($ million)
      • Chart on Germany - Year-over-year growth 2023-2028 (%)
      • Data Table on Germany - Year-over-year growth 2023-2028 (%)
    • 8.9 US - Market size and forecast 2023-2028
      • Chart on US - Market size and forecast 2023-2028 ($ million)
      • Data Table on US - Market size and forecast 2023-2028 ($ million)
      • Chart on US - Year-over-year growth 2023-2028 (%)
      • Data Table on US - Year-over-year growth 2023-2028 (%)
    • 8.10 China - Market size and forecast 2023-2028
      • Chart on China - Market size and forecast 2023-2028 ($ million)
      • Data Table on China - Market size and forecast 2023-2028 ($ million)
      • Chart on China - Year-over-year growth 2023-2028 (%)
      • Data Table on China - Year-over-year growth 2023-2028 (%)
    • 8.11 Japan - Market size and forecast 2023-2028
      • Chart on Japan - Market size and forecast 2023-2028 ($ million)
      • Data Table on Japan - Market size and forecast 2023-2028 ($ million)
      • Chart on Japan - Year-over-year growth 2023-2028 (%)
      • Data Table on Japan - Year-over-year growth 2023-2028 (%)
    • 8.12 UK - Market size and forecast 2023-2028
      • Chart on UK - Market size and forecast 2023-2028 ($ million)
      • Data Table on UK - Market size and forecast 2023-2028 ($ million)
      • Chart on UK - Year-over-year growth 2023-2028 (%)
      • Data Table on UK - Year-over-year growth 2023-2028 (%)
    • 8.13 Market opportunity by geography
      • Market opportunity by geography ($ million)
      • Data Tables on Market opportunity by geography ($ million)

    9 Drivers, Challenges, and Opportunity/Restraints

    • 9.1 Market drivers
      • 9.2 Market challenges
        • 9.3 Impact of drivers and challenges
          • Impact of drivers and challenges in 2023 and 2028
        • 9.4 Market opportunities/restraints

          10 Competitive Landscape

          • 10.1 Overview
            • 10.2 Competitive Landscape
              • Overview on criticality of inputs and factors of differentiation
            • 10.3 Landscape disruption
              • Overview on factors of disruption
            • 10.4 Industry risks
              • Impact of key risks on business

            11 Competitive Analysis

            • 11.1 Companies profiled
              • Companies covered
            • 11.2 Market positioning of companies
              • Matrix on companies position and classification
            • 11.3 Anteo S P A
              • Anteo S P A - Overview
              • Anteo S P A - Product / Service
              • Anteo S P A - Key offerings
            • 11.4 behrens loading systems B V
              • behrens loading systems B V - Overview
              • behrens loading systems B V - Product / Service
              • behrens loading systems B V - Key offerings
            • 11.5 Cargotec Corp.
              • Cargotec Corp. - Overview
              • Cargotec Corp. - Business segments
              • Cargotec Corp. - Key news
              • Cargotec Corp. - Key offerings
              • Cargotec Corp. - Segment focus
            • 11.6 Dautel GMBH
              • Dautel GMBH - Overview
              • Dautel GMBH - Product / Service
              • Dautel GMBH - Key offerings
            • 11.7 Dhollandia N V
              • Dhollandia N V - Overview
              • Dhollandia N V - Product / Service
              • Dhollandia N V - Key offerings
            • 11.8 Gerd Bar GmbH
              • Gerd Bar GmbH - Overview
              • Gerd Bar GmbH - Product / Service
              • Gerd Bar GmbH - Key offerings
            • 11.9 Maxon lift Corp
              • Maxon lift Corp - Overview
              • Maxon lift Corp - Product / Service
              • Maxon lift Corp - Key offerings
            • 11.10 PALFINGER AG
              • PALFINGER AG - Overview
              • PALFINGER AG - Business segments
              • PALFINGER AG - Key offerings
              • PALFINGER AG - Segment focus
            • 11.11 Penny Hydraulics Ltd
              • Penny Hydraulics Ltd - Overview
              • Penny Hydraulics Ltd - Product / Service
              • Penny Hydraulics Ltd - Key offerings
            • 11.12 Sorensen Hydraulik GMBH
              • Sorensen Hydraulik GMBH - Overview
              • Sorensen Hydraulik GMBH - Product / Service
              • Sorensen Hydraulik GMBH - Key offerings

            12 Appendix

            • 12.1 Scope of the report
              • 12.2 Inclusions and exclusions checklist
                • Inclusions checklist
                • Exclusions checklist
              • 12.3 Currency conversion rates for US$
                • Currency conversion rates for US$
              • 12.4 Research methodology
                • Research methodology
              • 12.5 Data procurement
                • Information sources
              • 12.6 Data validation
                • Data validation
              • 12.7 Validation techniques employed for market sizing
                • Validation techniques employed for market sizing
              • 12.8 Data synthesis
                • Data synthesis
              • 12.9 360 degree market analysis
                • 360 degree market analysis
              • 12.10 List of abbreviations
                • List of abbreviations

              Research Methodology

              Technavio presents a detailed picture of the market by way of study, synthesis, and summation of data from multiple sources. The analysts have presented the various facets of the market with a particular focus on identifying the key industry influencers. The data thus presented is comprehensive, reliable, and the result of extensive research, both primary and secondary.

              INFORMATION SOURCES

              Primary sources

              • Manufacturers and suppliers
              • Channel partners
              • Industry experts
              • Strategic decision makers

              Secondary sources

              • Industry journals and periodicals
              • Government data
              • Financial reports of key industry players
              • Historical data
              • Press releases

              DATA ANALYSIS

              Data Synthesis

              • Collation of data
              • Estimation of key figures
              • Analysis of derived insights

              Data Validation

              • Triangulation with data models
              • Reference against proprietary databases
              • Corroboration with industry experts

              REPORT WRITING

              Qualitative

              • Market drivers
              • Market challenges
              • Market trends
              • Five forces analysis

              Quantitative

              • Market size and forecast
              • Market segmentation
              • Geographical insights
              • Competitive landscape

              Interested in this report?

              Get your sample now to see our research methodology and insights!

              Download Now

              Frequently Asked Questions

              Tail Lift market growth will increase by $ 1279.7 mn during 2024-2028.

              The Tail Lift market is expected to grow at a CAGR of 14.76% during 2024-2028.

              Tail Lift market is segmented by Product( Cantilever lifts, Slider tail lifts, Tuck away lifts, Column lifts, others)

              Anteo S P A, behrens loading systems B V, Cargotec Corp., Dautel GMBH, Dhollandia N V, Gerd Bar GmbH, Maxon lift Corp, PALFINGER AG, Penny Hydraulics Ltd, Sorensen Hydraulik GMBH, Tailifts South Africa Pty Ltd, Tuffman Group, Woodbine Manufacturing Co. are a few of the key vendors in the Tail Lift market.

              Europe will register the highest growth rate of 52% among the other regions. Therefore, the Tail Lift market in Europe is expected to garner significant business opportunities for the vendors during the forecast period.

              Germany, US, China, Japan, UK

              • Growth of retail industryRapid urbanization is the driving factor this market.
              • rising household incomes is the driving factor this market.
              • and the increasing demand for fast-moving consumer goods (FMCG) drive the growth of the retail industry. For instance is the driving factor this market.
              • In 2021 is the driving factor this market.
              • the total retail sales of consumer goods in China reached 44 is the driving factor this market.
              • 082.3 billion yuan is the driving factor this market.
              • up by 12.5 percent over the previous year with the average two-year growth of 3.9 percent. Investments in the retail industry are also increasing. For instance is the driving factor this market.
              • in 2021 is the driving factor this market.
              • the Indian retail market is estimated to be US$ 600 billion and one of the top-five retail markets in the world by economic value. India is one of the fastest-growing retail markets in the world is the driving factor this market.
              • with 1.2 billion people. The retail industry in the country is estimated to grow due to the addition of new mall space. Thus is the driving factor this market.
              • the growth of the retail industry will increase logistical activities is the driving factor this market.
              • which will increase the demand for tail lifts. is the driving factor this market.

              The Tail Lift market vendors should focus on grabbing business opportunities from the Cantilever lifts segment as it accounted for the largest market share in the base year.
              RIA - Research AI Assistant
              Ask RIA