
Coatings Raw Materials Market Size 2025-2029
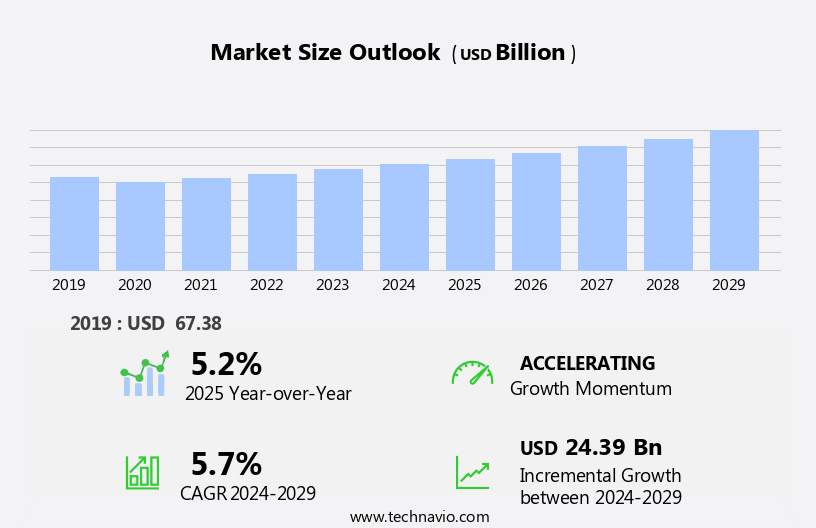
The coatings raw materials market size is forecast to increase by USD 24.39 billion at a CAGR of 5.7% between 2024 and 2029.
- The market is driven by the increasing demand for alkyd resins in paints and coatings, particularly in the construction and automotive industries. Alkyd resins are a key component in these applications due to their desirable properties such as high gloss, good adhesion, and excellent chemical resistance. Furthermore, the automotive industry's growth is a significant factor, as new vehicles require extensive coating applications for both exterior and interior surfaces. However, the market faces challenges due to the volatility of crude oil prices, which significantly impact the cost of raw materials such as linseed oil and rosin.
- These materials are essential feedstocks for alkyd resins, making price fluctuations a significant concern for manufacturers. As a result, companies must navigate this challenge by exploring alternative raw materials, improving production efficiencies, and implementing pricing strategies to mitigate the impact of price volatility on their bottom line. In summary, the market is experiencing robust growth due to the increasing demand in key industries, but manufacturers must address the challenges posed by fluctuating crude oil prices to remain competitive and profitable.
What will be the Size of the Coatings Raw Materials Market during the forecast period?
- The market continues to evolve, driven by the ongoing demand for superior performance and sustainability in various sectors. The integration of eco-friendly solutions, such as water-based formulations and VOC-free alternatives, is a significant trend in response to environmental regulations. In infrastructure development and energy production, high-performance resins are essential for corrosion resistance and durability under harsh conditions. Electric vehicles and eco-friendly products are propelling the market forward, with a focus on elasticity and specialty coatings for batteries and solar panels. The aerospace industry requires coatings with exceptional weather resistance and adhesion for quality construction materials. Resource extraction industries, such as oil & gas and mining, rely on protective coatings for equipment and pipelines.
- In the general industry, coatings play a crucial role in enhancing product durability and efficiency. Sustainability initiatives are also gaining traction in sectors like architectural coatings and flooring. UV-curable and acrylic coatings are popular choices for their high-performance properties, while solvent-based coatings continue to be used in specific applications. Powder coatings offer eco-friendly advantages, while additives improve the properties of various coatings. The market is further influenced by regulatory standards, with a focus on reducing waste and improving product durability. The transportation sector, including shipbuilding and semiconductors, benefits from coatings that meet ecological regulations. Furniture, closures, and sidings are among the numerous applications for coatings, reflecting their versatility and importance in diverse industries.
- The ongoing evolution of materials science and application techniques ensures that the market remains a dynamic and innovative sector.
How is this Coatings Raw Materials Industry segmented?
The coatings raw materials industry research report provides comprehensive data (region-wise segment analysis), with forecasts and estimates in "USD billion" for the period 2025-2029, as well as historical data from 2019-2023 for the following segments.
- Type
- Resins
- Pigments and fillers
- Solvents
- Additives
- Distribution Channel
- Offline
- Online
- Application
- Architectural Coatings
- Industrial Coatings
- Automotive Coatings
- Protective Coatings
- Specialty Coatings
- Powder Coatings
- Waterborne Coatings
- UV-Curable Coatings
- Geography
- North America
- US
- Canada
- Europe
- France
- Germany
- Italy
- UK
- Middle East and Africa
- Egypt
- KSA
- Oman
- UAE
- APAC
- China
- India
- Japan
- South America
- Argentina
- Brazil
- Rest of World (ROW)
- North America
By Type Insights
The resins segment is estimated to witness significant growth during the forecast period.
In the dynamic world of coatings raw materials, acrylic and alkyd resins dominate the landscape. Acrylic resins, derived from synthetic sources, are the most widely used binders in paints and coatings applications due to their superior performance and versatility. They are integral to decorative paints and have gained popularity for their eco-friendly attributes, as they emit fewer volatile organic compounds (VOCs) compared to traditional solvent-based alternatives. Alkyd resins, derived from natural and synthetic sources, have been the second-most common type of resin in coatings formulations. However, their usage has been on the decline, particularly in regions like North America and the EU, due to stringent environmental regulations limiting volatile organic compound emissions.
Materials science continues to evolve, with innovations in powder coatings, water-based formulations, and UV-curable resins gaining traction. Powder coatings offer eco-friendly advantages, as they generate minimal waste and require no solvents. Water-based coatings, on the other hand, provide a more sustainable alternative to solvent-based coatings, contributing to the growing trend of sustainability initiatives in various industries, including general industry, electronics, and transportation. Ultraviolet (UV)-curable resins are gaining popularity due to their quick curing properties, making them suitable for high-performance applications in aerospace, automotive, and industrial coatings. High-performance resins, such as polyurethane and acrylic, are increasingly being used in protective coatings for infrastructure development, energy production, and resource extraction, ensuring product durability and weather resistance under harsh conditions.
Eco-friendly alternatives, such as bio-based resins and additives, are being adopted to meet the demands of regulatory standards and consumer preferences for sustainable, low-emission products. Specialty resins, including elastomeric and thermosetting resins, cater to specific application techniques and industries, such as flooring, closures, and furniture. In the realm of infrastructure development, materials science plays a crucial role in creating eco-friendly, high-performance solutions for construction materials, including cupboards, sidings, and architectural applications. These materials must meet stringent regulatory standards for durability, weather resistance, and adhesion, ensuring long-term sustainability and performance. In the energy sector, high-performance resins are essential for protecting critical infrastructure, such as wind turbines, solar panels, and oil & gas equipment, from harsh environmental conditions.
The mining industry also relies on resilient coatings to protect equipment from corrosion and weathering. The market is a diverse and dynamic landscape, driven by advancements in materials science, regulatory requirements, and consumer preferences for eco-friendly, high-performance solutions. From electric vehicles and aerospace to infrastructure development and resource extraction, the applications for coatings raw materials are vast and ever-evolving.
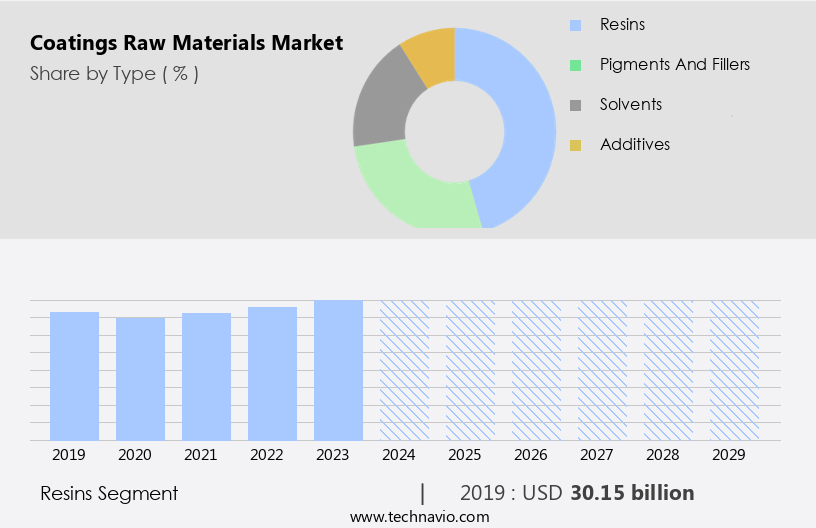
The Resins segment was valued at USD 30.15 billion in 2019 and showed a gradual increase during the forecast period.
Regional Analysis
APAC is estimated to contribute 52% to the growth of the global market during the forecast period.Technavio's analysts have elaborately explained the regional trends and drivers that shape the market during the forecast period.

The market is experiencing significant growth due to the surge in infrastructure development, particularly in countries like China and India. In China, the construction industry's expansion, driven by projects such as the Three Gorges Dam, South-to-North Water transfer project, and Beijing Airport expansion, will fuel the demand for high-performance resins, elasticity additives, and corrosion-resistant powders. Similarly, in India, the construction of Navi Mumbai International Airport, Chenab River Railway Bridge, and the Delhi-Mumbai Industrial Corridor will necessitate the use of eco-friendly, water-based formulations, and durable coatings for architectural applications. The automotive industry's evolution, with the rise of electric vehicles, is another critical factor driving market growth.
Materials science advancements in UV-curable acrylics and solvent-based coatings are essential for manufacturing high-performance batteries and improving electric cars' energy efficiency. Moreover, the increasing focus on sustainability and regulatory compliance in industries like aerospace, electronics, and oil & gas is leading to the adoption of eco-friendly alternatives to traditional solvent-based coatings. Efficiency and durability are crucial factors in the market, especially in industries like general industry, mining, and shipbuilding. Coatings with superior weather resistance and adhesion properties are essential for protecting infrastructure and equipment from harsh conditions. In addition, the increasing emphasis on product durability and eco-friendly initiatives is driving the demand for high-performance resins and formulations in various industries.
In the flooring sector, water-based coatings and powder technologies are gaining popularity due to their low VOC content and ease of application. These coatings offer excellent performance, making them suitable for use in various applications, including closures, cupboards, and furniture. The regulatory landscape is also evolving, with stricter environmental regulations and ecological standards driving the demand for eco-friendly coatings. In conclusion, the market is witnessing significant growth due to the surge in infrastructure development, the automotive industry's evolution, and the increasing focus on sustainability and regulatory compliance across various industries. The market's dynamics are shaped by factors such as the demand for high-performance coatings, the adoption of eco-friendly alternatives, and the need for coatings with superior durability and weather resistance.
Market Dynamics
Our researchers analyzed the data with 2024 as the base year, along with the key drivers, trends, and challenges. A holistic analysis of drivers will help companies refine their marketing strategies to gain a competitive advantage.
What are the key market drivers leading to the rise in the adoption of Coatings Raw Materials Industry?
- The alkyd resins market is primarily driven by the surging demand for these resins in the production of paints and coatings.
- Alkyd resins, derived from polyester-based materials, are a significant class of raw materials in the coatings industry. Modified with oil or fatty acids, they can be further enhanced using chemicals such as polybasic acids, polyhydric alcohols, oils, fatty acids, and modifying agents. The resulting alkyds exhibit unique properties, making them indispensable in the production of protective coatings. Alkyd resins contribute to the enhanced weathering properties of coatings, extending their durability and resistance to various environmental conditions. Their versatility allows them to be used in a wide range of applications, including decorative coatings, electronics, oil & gas, shipbuilding, semiconductors, sidings, furniture, and transportation.
- As sustainability initiatives gain momentum, there is a growing demand for eco-friendly alternatives to traditional alkyd resins. Innovations in technology have led to the development of bio-based alkyds derived from renewable resources, offering reduced carbon footprints and improved environmental performance. These advancements are expected to drive the growth of the alkyd resins market in the coming years.
What are the market trends shaping the Coatings Raw Materials Industry?
- The automotive industry is experiencing significant growth, making it a prominent market trend. This expanding sector presents numerous opportunities for professionals and businesses.
- The market is experiencing steady growth, driven by increasing demand from various industries, particularly the automotive sector. Superior performance properties, such as corrosion resistance and excellent gloss retention, make resins a preferred choice for automotive paints and coatings. The automotive industry's expansion, fueled by urbanization and rising per capita income, primarily in Asia Pacific, is boosting the market. Additionally, the shift towards electric vehicles and infrastructure development in energy production sectors is also contributing to the market's growth.
- Materials science advancements have led to the development of eco-friendly, water-based formulations, powder coatings, and application techniques, making coatings more sustainable and desirable. These trends are expected to continue shaping the market dynamics.
What challenges does the Coatings Raw Materials Industry face during its growth?
- The volatility of crude oil prices poses a significant challenge to the growth of the industry.
- Coatings raw materials are essential components derived from crude oil for various protective applications in industries. Volatility in global oil prices can significantly impact the pricing of oil-derived coatings raw materials, such as those based on acrylic, solvent-based, and UV-curable technologies. This price instability can affect the manufacturing costs of coatings and impact their usage across sectors, including aerospace, electric cars, and general industry. Adapting to sustainability and eco-friendliness is a growing trend in the market. High-performance, specialty coatings with enhanced elasticity and efficiency are increasingly preferred.
- The market is influenced by factors like raw material availability, regulatory compliance, and technological advancements. Despite challenges from fluctuating oil prices, the industry continues to innovate, offering solutions that cater to the evolving needs of customers.
Exclusive Customer Landscape
The coatings raw materials market forecasting report includes the adoption lifecycle of the market, covering from the innovator's stage to the laggard's stage. It focuses on adoption rates in different regions based on penetration. Furthermore, the coatings raw materials market report also includes key purchase criteria and drivers of price sensitivity to help companies evaluate and develop their market growth analysis strategies.

Customer Landscape
Key Companies & Market Insights
Companies are implementing various strategies, such as strategic alliances, coatings raw materials market forecast, partnerships, mergers and acquisitions, geographical expansion, and product/service launches, to enhance their presence in the industry.
Akzo Nobel- The company specializes in providing a range of coatings raw materials for various color systems under recognized brand names, including FLEXGLAZE, PROGLAZE neutral dry glaze, and C-MIX intermix system.
The industry research and growth report includes detailed analyses of the competitive landscape of the market and information about key companies, including:
- AkzoNobel
- Arkema
- Ashland
- BASF SE
- Clariant
- Covestro
- DIC Corporation
- Dow
- DSM
- Eastman Chemical Company
- Evonik Industries
- H.B. Fuller
- Henkel
- Huntsman Corporation
- LANXESS
- Momentive Performance Materials
- PPG Industries
- Solvay
- Synthomer
- Wacker Chemie
Qualitative and quantitative analysis of companies has been conducted to help clients understand the wider business environment as well as the strengths and weaknesses of key industry players. Data is qualitatively analyzed to categorize companies as pure play, category-focused, industry-focused, and diversified; it is quantitatively analyzed to categorize companies as dominant, leading, strong, tentative, and weak.
Recent Development and News in Coatings Raw Materials Market
- In January 2024, BASF SE, a leading global chemical producer, announced the launch of its new line of waterborne coatings raw materials, called "BASF Aquasol," designed to reduce the carbon footprint of coatings production (BASF press release, 2024). This innovative product line aligns with the growing demand for eco-friendly solutions in the coatings industry.
- In March 2025, PPG Industries, Inc. And Axalta Coating Systems entered into a strategic collaboration to jointly develop and commercialize advanced coating technologies (PPG Industries press release, 2025). This partnership aims to enhance their combined market position and accelerate innovation in the coatings raw materials sector.
- In August 2024, Evonik Industries AG completed the acquisition of the specialty additives business of Elementis plc for â¬3.1 billion (Reuters, 2024). This acquisition significantly expanded Evonik's portfolio in coatings raw materials and strengthened its market presence.
- In October 2025, the European Union's REACH regulation introduced new restrictions on the use of certain coatings raw materials, such as certain phthalates and bisphenol A (European Chemicals Agency, 2025). This regulatory development is driving the coatings industry to invest in alternative raw materials and innovative technologies to meet the new requirements.
Research Analyst Overview
The market encompasses a diverse range of products, including alkyd resins, acrylics, and powder services, used in various industries for corrosion prevention, design, and surface protection. Wood coatings, such as those for furniture and cupboards, often employ waterborne and sustainable solutions for durability and eco-friendliness. Industrial paint, including high-performance and self-healing formulations, safeguards metal structures in sectors like aviation, semiconductor manufacturing, and oil & gas. Abrasion-resistant and UV-resistant coatings are essential for vehicle refinish and nautical applications. Innovation trends in the market include the development of water-based and high-performance materials for industrial, aerospace, and general industry use.
Performance testing is crucial in ensuring the longevity and protective capabilities of these coatings in diverse applications, from flooring and capping and closures to emission reduction in various industries.
Dive into Technavio's robust research methodology, blending expert interviews, extensive data synthesis, and validated models for unparalleled Coatings Raw Materials Market insights. See full methodology.
|
Market Scope |
|
|
Report Coverage |
Details |
|
Page number |
209 |
|
Base year |
2024 |
|
Historic period |
2019-2023 |
|
Forecast period |
2025-2029 |
|
Growth momentum & CAGR |
Accelerate at a CAGR of 5.7% |
|
Market growth 2025-2029 |
USD 24.39 billion |
|
Market structure |
Fragmented |
|
YoY growth 2024-2025(%) |
5.2 |
|
Key countries |
US, China, Japan, India, South Korea, UK, Canada, Germany, Brazil, and Australia |
|
Competitive landscape |
Leading Companies, Market Positioning of Companies, Competitive Strategies, and Industry Risks |
What are the Key Data Covered in this Coatings Raw Materials Market Research and Growth Report?
- CAGR of the Coatings Raw Materials industry during the forecast period
- Detailed information on factors that will drive the growth and forecasting between 2025 and 2029
- Precise estimation of the size of the market and its contribution of the industry in focus to the parent market
- Accurate predictions about upcoming growth and trends and changes in consumer behaviour
- Growth of the market across APAC, Europe, North America, South America, and Middle East and Africa
- Thorough analysis of the market's competitive landscape and detailed information about companies
- Comprehensive analysis of factors that will challenge the coatings raw materials market growth of industry companies
We can help! Our analysts can customize this coatings raw materials market research report to meet your requirements.
 RIA -
RIA - 
