Thermoformed Packaging Market Analysis, Size, and Forecast 2026-2030: APAC (China, Japan, and South Korea), North America (US, Canada, and Mexico), Europe (Germany, UK, and France), South America (Brazil and Argentina), Middle East and Africa (South Africa, UAE, and Saudi Arabia), and Rest of World (ROW)

Thermoformed Packaging Market Analysis, Size, and Forecast 2026-2030:
APAC (China, Japan, and South Korea), North America (US, Canada, and Mexico), Europe (Germany, UK, and France), South America (Brazil and Argentina), Middle East and Africa (South Africa, UAE, and Saudi Arabia), and Rest of World (ROW)

Published: Dec 2025 305 Pages SKU: IRTNTR80141

Market Overview at a Glance

$15.16 B
Market Opportunity
4.9%
CAGR 2025 - 2030
45.6%
APAC Growth
$14.70 B
Blister packaging segment 2024

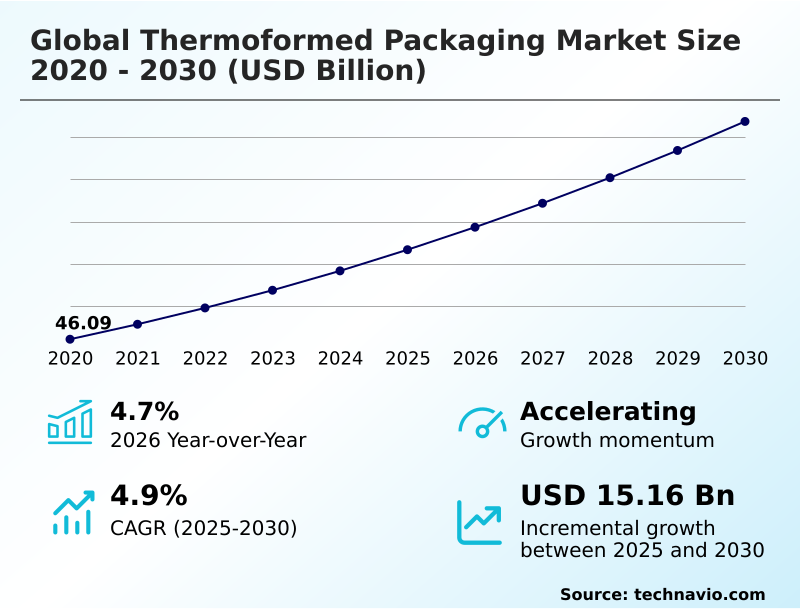
Thermoformed Packaging Market Size 2026-2030

The thermoformed packaging market size is valued to increase by USD 15.16 billion, at a CAGR of 4.9% from 2025 to 2030. Increasing demand for convenient and sustainable food packaging will drive the thermoformed packaging market.

Major Market Trends & Insights

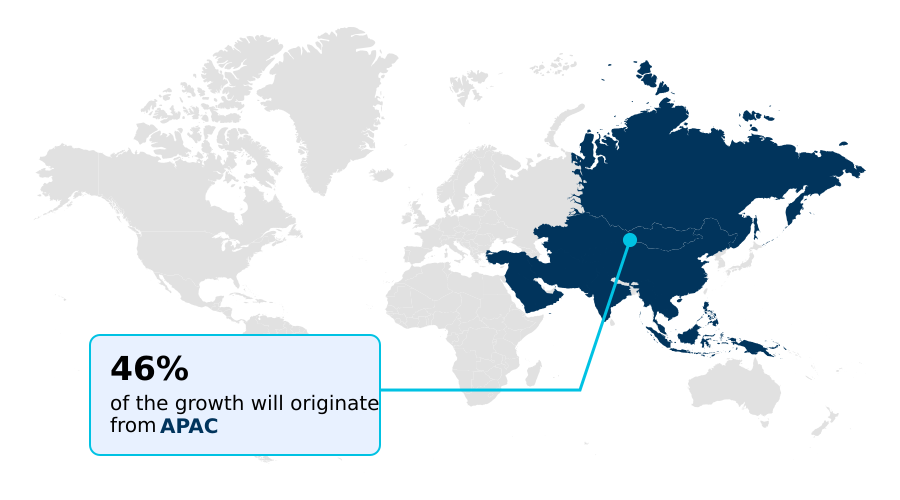
  • APAC dominated the market and accounted for a 45.6% growth during the forecast period.
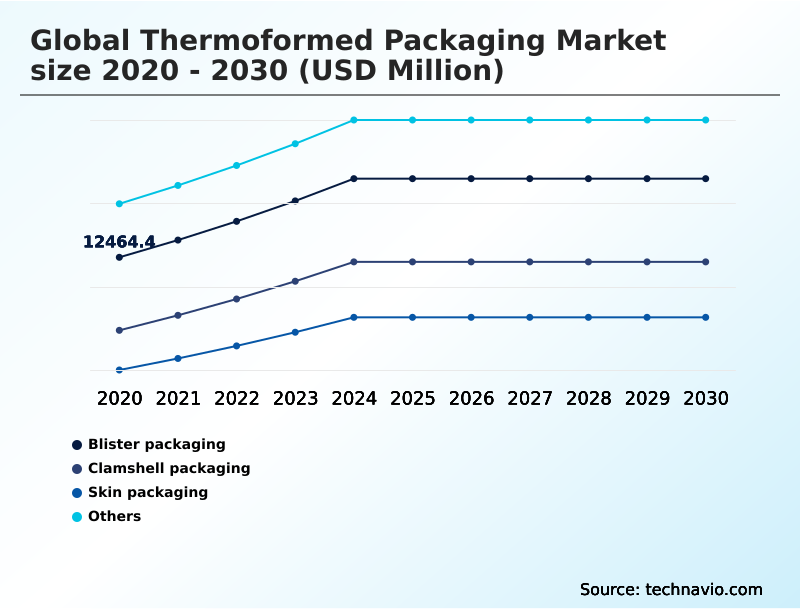
  • By Product Type - Blister packaging segment was valued at USD 14.70 billion in 2024
  • By End-user - Food and beverages segment accounted for the largest market revenue share in 2024

Market Size & Forecast

  • Market Opportunities: USD 25.74 billion
  • Market Future Opportunities: USD 15.16 billion
  • CAGR from 2025 to 2030 : 4.9%

Market Summary

  • The thermoformed packaging market is characterized by a dynamic interplay between technological innovation and sustainability imperatives. Growth is underpinned by persistent demand from the food, beverage, and pharmaceutical sectors for lightweight, protective, and cost-effective solutions. Key trends include the widespread adoption of mono-material designs and recycled content to meet circular economy goals.
  • However, the industry navigates significant challenges, including volatile raw material pricing and intense competition from alternative formats like molded fiber. For instance, a food processing company aiming to improve supply chain efficiency might adopt thermoformed trays designed for automated filling and sealing lines, which can increase throughput by over 20%.
  • This scenario highlights the balance between operational gains and the strategic necessity of aligning with evolving environmental regulations, such as extended producer responsibility schemes. Success hinges on manufacturers' ability to innovate materials and processes that deliver both performance and sustainability.

What will be the Size of the Thermoformed Packaging Market during the forecast period?

Get Key Insights on Market Forecast (PDF) Request Free Sample

How is the Thermoformed Packaging Market Segmented?

The thermoformed packaging industry research report provides comprehensive data (region-wise segment analysis), with forecasts and estimates in "USD million" for the period 2026-2030, as well as historical data from 2020-2024 for the following segments.

  • Product type
    • Blister packaging
    • Clamshell packaging
    • Skin packaging
    • Others
  • End-user
    • Food and beverages
    • Pharmaceuticals
    • Personal care and cosmetics
    • Others
  • Material
    • Plastic
    • Paper
  • Geography
    • APAC
      • China
      • Japan
      • South Korea
    • North America
      • US
      • Canada
      • Mexico
    • Europe
      • Germany
      • UK
      • France
    • South America
      • Brazil
      • Argentina
    • Middle East and Africa
      • South Africa
      • UAE
      • Saudi Arabia
    • Rest of World (ROW)

By Product Type Insights

The blister packaging segment is estimated to witness significant growth during the forecast period.

Blister packaging, a dominant segment, is evolving due to stringent pharmaceutical blister packaging regulations and demand for superior consumer goods packaging aesthetics.

Innovations are moving beyond traditional materials toward polyethylene terephthalate glycol (PETG) and high-density polyethylene (HDPE) as cold form foil (CFF) alternatives.

Achieving precise regulatory compliance validation is critical, driving advancements in heat-seal coating and tamper-evident design features for medical device sterile packaging. Ensuring food contact material safety through robust material traceability solutions is also a focus.

Enhanced die-cutting precision now allows for more complex designs, with some automated processes improving throughput by over 15%, meeting both functional and branding requirements for unit-dose blister packs.

Request Free Sample

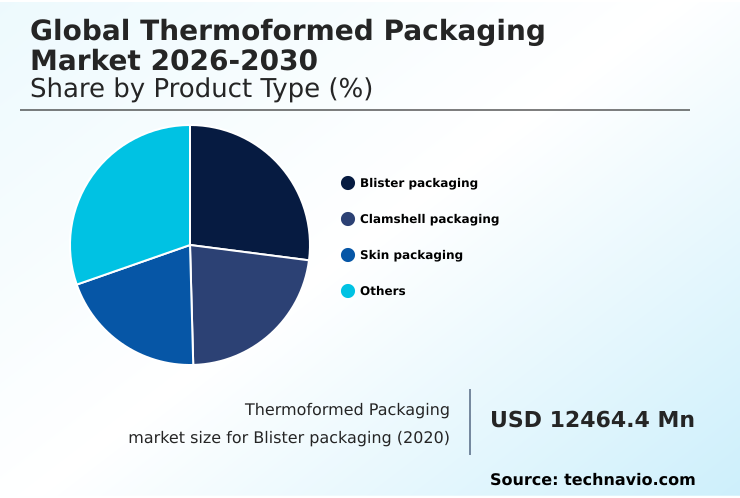
The Blister packaging segment was valued at USD 14.70 billion in 2024 and showed a gradual increase during the forecast period.

Request Free Sample

Regional Analysis

APAC is estimated to contribute 45.6% to the growth of the global market during the forecast period.Technavio’s analysts have elaborately explained the regional trends and drivers that shape the market during the forecast period.

See How Thermoformed Packaging Market Demand is Rising in APAC Request Free Sample

The global landscape is led by APAC, which accounts for over 45% of the incremental growth, driven by rapid urbanization and rising disposable incomes.

In this region, deploying automated quality control systems has been shown to reduce defect rates by up to 25%. North America and Europe are mature markets focused on sustainability innovations like vacuum skin packaging (VSP) for shelf-life extension.

Investment in pressure forming technology enables the production of sterile medical trays with higher precision. As companies adopt plug-assist forming and in-mold labeling (IML), they achieve better material distribution and branding.

In sectors requiring electrostatic discharge (ESD) protection for electronics, specialized food-grade recycled polymers are gaining traction, supported by digital watermark integration for sorting.

These regional dynamics highlight a universal push toward advanced manufacturing and custom thermoformed inserts to meet specific end-user demands.

Market Dynamics

Our researchers analyzed the data with 2025 as the base year, along with the key drivers, trends, and challenges. A holistic analysis of drivers will help companies refine their marketing strategies to gain a competitive advantage.

  • Strategic decisions in the thermoformed packaging market increasingly involve a cost-benefit analysis of rPET in packaging, weighing material costs against sustainability gains. For companies producing convenience foods, thermoformed packaging for ready-to-eat meals is a critical focus, with a strong push toward thermoformable paperboard for food containers as a plastic-alternative.
  • The industry is actively comparing thermoforming vs injection molding for high-volume applications, where thermoforming process optimization for speed can offer a distinct advantage, in some cases improving cycle times by over 10%. In pharmaceuticals, developing sustainable alternatives to PVC blister packs is paramount, alongside clarifying regulations for medical device thermoformed trays.
  • For consumer goods, key initiatives include improving the recyclability of thermoformed clamshells and designing thermoformed packaging for cosmetic gift sets that enhance brand value. Across sectors, advanced materials for thin-wall thermoforming are being explored to reduce plastic in thermoformed food trays. The impact of PPWR on thermoformed packaging is forcing a transition to the benefits of mono-material thermoformed packs.
  • Meanwhile, challenges in recycling multi-layer thermoforms persist, pushing innovation in active packaging features in thermoforming and smart packaging integration with RFID. For industrial uses, thermoformed packaging for electronic components must meet specific protective standards, while recycled content verification for food packaging remains a critical compliance checkpoint.

What are the key market drivers leading to the rise in the adoption of Thermoformed Packaging Industry?

  • Increasing global demand for convenient, portable, and sustainable packaging, especially within the food and beverage sector, serves as a primary driver for the market.

  • The demand for extended shelf life and enhanced food safety is a primary market driver, fueling innovation in high-barrier thermoforming films and modified atmosphere packaging (MAP).
  • The integration of oxygen scavenger integration within packaging substrates can extend the freshness of perishable goods by up to 50%, a critical factor for cold chain packaging integrity.
  • Concurrently, the push for sustainable sourcing of polymers is accelerating the adoption of thermoformable paperboard, especially for food service disposable containers. Aseptic packaging integration is enabling new applications in shelf-stable products.
  • The performance of these advanced materials is closely monitored through metrics like polymer melt flow index and packaging performance testing, ensuring they meet the rigorous demands of e-commerce ready packaging while using features like anti-fog additives for better retail presentation.

What are the market trends shaping the Thermoformed Packaging Industry?

  • The proliferation of mono-material structures and solutions with high recycled content defines a key market trend. This industry-wide shift is driven by regulatory mandates and brand owner demand for a circular economy.

  • The market is decisively shifting toward circularity, driven by the adoption of mono-material PET structures and high-percentage post-consumer recycled PET (rPET). This trend is a direct response to regulatory pressures, promoting a mechanical recycling process that is over 30% more efficient for single-polymer streams.
  • Innovations in thin-wall thermoforming contribute to lightweighting for cost reduction, while advanced form-fill-seal (FFS) systems improve production speeds. The development of retortable thermoformed trays and biaxially oriented polypropylene (BOPP) lids that align with closed-loop recycling systems is critical.
  • These advancements enable a more sustainable ecosystem, where advanced sorting technology can effectively process materials, and compostable bioplastic packaging offers an alternative end-of-life pathway, supporting a true circular economy packaging design.

What challenges does the Thermoformed Packaging Industry face during its growth?

  • Escalating regulatory scrutiny combined with stringent sustainability mandates that vary by region presents a key challenge affecting industry-wide growth and material innovation.

  • Navigating raw material volatility and stringent packaging waste reduction mandates presents a significant challenge. The reliance on materials like crystal clear polystyrene (PS) and polypropylene (PP) containers exposes manufacturers to price fluctuations, complicating supply chain packaging optimization.
  • The technical difficulty of separating multi-layer coextrusion formats hinders end-of-life recyclability, as barrier layer materials often contaminate recycling streams, leading to polymer chain degradation. Compliance with extended producer responsibility (EPR) schemes requires significant investment in tooling design and optimization for mono-material solutions.
  • Furthermore, ensuring consistent chemical resistance properties and accurate barrier property measurement across batches adds complexity, demanding robust quality control throughout the sheet extrusion process to meet performance standards.

Exclusive Technavio Analysis on Customer Landscape

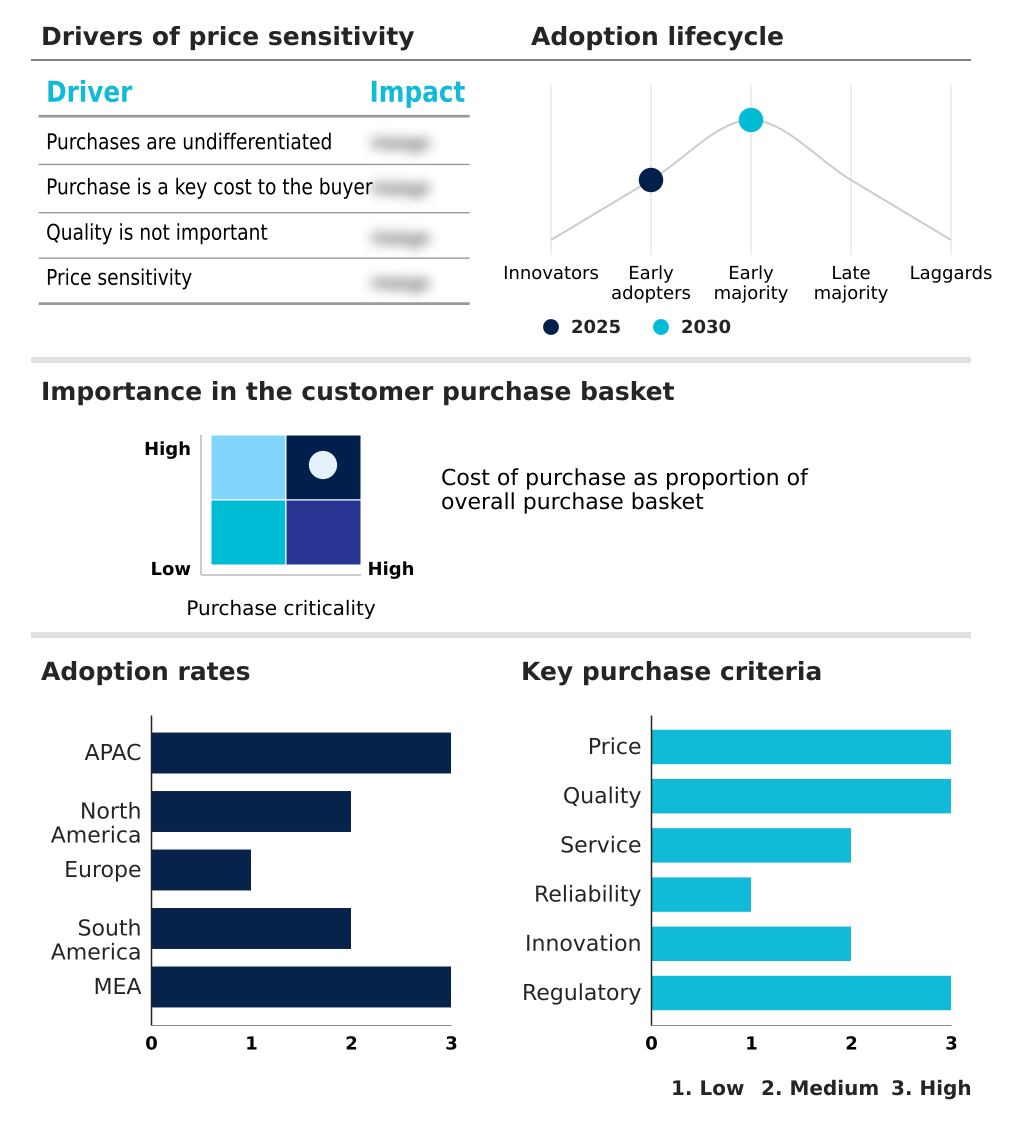
The thermoformed packaging market forecasting report includes the adoption lifecycle of the market, covering from the innovator’s stage to the laggard’s stage. It focuses on adoption rates in different regions based on penetration. Furthermore, the thermoformed packaging market report also includes key purchase criteria and drivers of price sensitivity to help companies evaluate and develop their market growth analysis strategies.

Customer Landscape of Thermoformed Packaging Industry

Competitive Landscape

Companies are implementing various strategies, such as strategic alliances, thermoformed packaging market forecast, partnerships, mergers and acquisitions, geographical expansion, and product/service launches, to enhance their presence in the industry.

Amcor Plc - Analyst research highlights a key offering in thermoformed packaging, focusing on recyclable trays engineered for food and beverage applications to meet performance and sustainability demands.

The industry research and growth report includes detailed analyses of the competitive landscape of the market and information about key companies, including:

  • Amcor Plc
  • BBC Packaging SL
  • Berry Global Inc.
  • CTCI Production
  • Dart Container Corp.
  • DM THERMOFORMER
  • Dordan Manufacturing Co.
  • EasyPak LLC
  • ENVAPLASTER SA
  • Huhtamaki Oyj
  • ITC Packaging
  • Lacerta Group LLC
  • NEFAB GROUP
  • Placon Corp.
  • Prent Corp.
  • Sealed Air Corp.
  • Silgan Holdings Inc.
  • Sinclair and Rush Inc.
  • Sonoco Products Co.
  • USK Balaji Plast Pvt. Ltd.

Qualitative and quantitative analysis of companies has been conducted to help clients understand the wider business environment as well as the strengths and weaknesses of key industry players. Data is qualitatively analyzed to categorize companies as pure play, category-focused, industry-focused, and diversified; it is quantitatively analyzed to categorize companies as dominant, leading, strong, tentative, and weak.

Recent Development and News in Thermoformed packaging market

  • In September 2024, Placon Corp. launched its EcoStar 50S packaging material, made from post-consumer recycled plastic and engineered to meet evolving recycled-content regulations across the United States.
  • In January 2025, the EU published its comprehensive Packaging and Packaging Waste Regulation (PPWR), establishing harmonized rules for circularity, including mandatory minimum recycled content targets for plastic packaging.
  • In February 2025, ULMA Packaging launched its Width Flex technology, an automated system for thermoforming machines that adjusts film width in real-time to reduce plastic film waste by a significant margin.
  • In September 2024, Toppan was involved in a collaborative project in Japan focused on commercializing a tray-to-tray recycling system to create a closed loop for thermoformed PET food trays.

Dive into Technavio’s robust research methodology, blending expert interviews, extensive data synthesis, and validated models for unparalleled Thermoformed Packaging Market insights. See full methodology.

Market Scope
Page number 305
Base year 2025
Historic period 2020-2024
Forecast period 2026-2030
Growth momentum & CAGR Accelerate at a CAGR of 4.9%
Market growth 2026-2030 USD 15157.1 million
Market structure Fragmented
YoY growth 2025-2026(%) 4.7%
Key countries China, Japan, South Korea, India, Australia, Indonesia, US, Canada, Mexico, Germany, UK, France, Italy, Spain, The Netherlands, Brazil, Argentina, Chile, South Africa, UAE, Saudi Arabia, Egypt and Nigeria
Competitive landscape Leading Companies, Market Positioning of Companies, Competitive Strategies, and Industry Risks

Request Free Sample

Research Analyst Overview

  • The thermoformed packaging market is undergoing a significant transformation driven by material science and process innovation. Demand is robust for solutions that balance performance with circularity, such as high-barrier thermoforming films designed for shelf-life extension and retortable thermoformed trays for convenience foods.
  • A key boardroom consideration is the strategic shift toward post-consumer recycled PET (rPET) and other food-grade recycled polymers to comply with evolving regulations. The adoption of mono-material PET structures is critical for recyclability, moving away from complex multi-layer coextrusion.
  • Technologies like form-fill-seal (FFS) systems and thin-wall thermoforming are being optimized for efficiency, with some manufacturers achieving a 15% reduction in material usage through lightweighting. Concurrently, the mechanical recycling process is being refined to handle a wider range of inputs, including polypropylene (PP) containers and materials with anti-fog additives.
  • This convergence of technology and sustainability is redefining the competitive landscape for manufacturers.

What are the Key Data Covered in this Thermoformed Packaging Market Research and Growth Report?

  • What is the expected growth of the Thermoformed Packaging Market between 2026 and 2030?

    • USD 15.16 billion, at a CAGR of 4.9%

  • What segmentation does the market report cover?

    • The report is segmented by Product Type (Blister packaging, Clamshell packaging, Skin packaging, and Others), End-user (Food and beverages, Pharmaceuticals, Personal care and cosmetics, and Others), Material (Plastic, and Paper) and Geography (APAC, North America, Europe, South America, Middle East and Africa)

  • Which regions are analyzed in the report?

    • APAC, North America, Europe, South America and Middle East and Africa

  • What are the key growth drivers and market challenges?

    • Increasing demand for convenient and sustainable food packaging, Escalating regulatory scrutiny and sustainability mandates

  • Who are the major players in the Thermoformed Packaging Market?

    • Amcor Plc, BBC Packaging SL, Berry Global Inc., CTCI Production, Dart Container Corp., DM THERMOFORMER, Dordan Manufacturing Co., EasyPak LLC, ENVAPLASTER SA, Huhtamaki Oyj, ITC Packaging, Lacerta Group LLC, NEFAB GROUP, Placon Corp., Prent Corp., Sealed Air Corp., Silgan Holdings Inc., Sinclair and Rush Inc., Sonoco Products Co. and USK Balaji Plast Pvt. Ltd.

Market Research Insights

  • Market dynamics are increasingly shaped by sustainability and operational efficiency. The adoption of circular economy packaging design is not just a trend but a competitive necessity, with some solutions reducing plastic content by up to 80% compared to legacy formats. This shift is driven by packaging waste reduction mandates and a focus on end-of-life recyclability.
  • Companies are leveraging automated quality control systems and robotic stacking and packing to enhance productivity, with some achieving a 15% reduction in line-changeover times. Furthermore, supply chain packaging optimization is critical, as e-commerce ready packaging formats must balance protection with lightweighting for cost reduction.
  • These factors create a landscape where technological investment is directly tied to achieving both environmental compliance and measurable financial returns.

We can help! Our analysts can customize this thermoformed packaging market research report to meet your requirements.

Get in touch

1. Executive Summary

1.1 Market overview

Executive Summary - Chart on Market Overview
Executive Summary - Data Table on Market Overview
Executive Summary - Chart on Global Market Characteristics
Executive Summary - Chart on Market by Geography
Executive Summary - Chart on Market Segmentation by Product Type
Executive Summary - Chart on Market Segmentation by End-user
Executive Summary - Chart on Market Segmentation by Material
Executive Summary - Chart on Incremental Growth
Executive Summary - Data Table on Incremental Growth
Executive Summary - Chart on Company Market Positioning

2. Technavio Analysis

2.1 Analysis of price sensitivity, lifecycle, customer purchase basket, adoption rates, and purchase criteria

2.2 Criticality of inputs and Factors of differentiation

Chart on Overview on criticality of inputs and factors of differentiation

2.3 Factors of disruption

Chart on Overview on factors of disruption

2.4 Impact of drivers and challenges

Chart on Impact of drivers and challenges in 2025 and 2030

3. Market Landscape

3.1 Market ecosystem

Chart on Parent Market
Data Table on - Parent Market

3.2 Market characteristics

Chart on Market characteristics analysis

3.3 Value chain analysis

Chart on Value chain analysis

4. Market Sizing

4.1 Market definition

Data Table on Offerings of companies included in the market definition

4.2 Market segment analysis

Market segments

4.3 Market size 2025

4.4 Market outlook: Forecast for 2025-2030

Chart on Global - Market size and forecast 2025-2030 ($ million)
Data Table on Global - Market size and forecast 2025-2030 ($ million)
Chart on Global Market: Year-over-year growth 2025-2030 (%)
Data Table on Global Market: Year-over-year growth 2025-2030 (%)

5. Historic Market Size

5.1 Global Thermoformed Packaging Market 2020 - 2024

Historic Market Size - Data Table on Global Thermoformed Packaging Market 2020 - 2024 ($ million)

5.2 Product Type segment analysis 2020 - 2024

Historic Market Size - Product Type Segment 2020 - 2024 ($ million)

5.3 End-user segment analysis 2020 - 2024

Historic Market Size - End-user Segment 2020 - 2024 ($ million)

5.4 Material segment analysis 2020 - 2024

Historic Market Size - Material Segment 2020 - 2024 ($ million)

5.5 Geography segment analysis 2020 - 2024

Historic Market Size - Geography Segment 2020 - 2024 ($ million)

5.6 Country segment analysis 2020 - 2024

Historic Market Size - Country Segment 2020 - 2024 ($ million)

6. Qualitative Analysis

6.1 Impact of AI on the Global Thermoformed Packaging Market

7. Five Forces Analysis

7.1 Five forces summary

Five forces analysis - Comparison between 2025 and 2030

7.2 Bargaining power of buyers

Bargaining power of buyers - Impact of key factors 2025 and 2030

7.3 Bargaining power of suppliers

Bargaining power of suppliers - Impact of key factors in 2025 and 2030

7.4 Threat of new entrants

Threat of new entrants - Impact of key factors in 2025 and 2030

7.5 Threat of substitutes

Threat of substitutes - Impact of key factors in 2025 and 2030

7.6 Threat of rivalry

Threat of rivalry - Impact of key factors in 2025 and 2030

7.7 Market condition

Chart on Market condition - Five forces 2025 and 2030

8. Market Segmentation by Product Type

8.1 Market segments

Chart on Product Type - Market share 2025-2030 (%)
Data Table on Product Type - Market share 2025-2030 (%)

8.2 Comparison by Product Type

Chart on Comparison by Product Type
Data Table on Comparison by Product Type

8.3 Blister packaging - Market size and forecast 2025-2030

Chart on Blister packaging - Market size and forecast 2025-2030 ($ million)
Data Table on Blister packaging - Market size and forecast 2025-2030 ($ million)
Chart on Blister packaging - Year-over-year growth 2025-2030 (%)
Data Table on Blister packaging - Year-over-year growth 2025-2030 (%)

8.4 Clamshell packaging - Market size and forecast 2025-2030

Chart on Clamshell packaging - Market size and forecast 2025-2030 ($ million)
Data Table on Clamshell packaging - Market size and forecast 2025-2030 ($ million)
Chart on Clamshell packaging - Year-over-year growth 2025-2030 (%)
Data Table on Clamshell packaging - Year-over-year growth 2025-2030 (%)

8.5 Skin packaging - Market size and forecast 2025-2030

Chart on Skin packaging - Market size and forecast 2025-2030 ($ million)
Data Table on Skin packaging - Market size and forecast 2025-2030 ($ million)
Chart on Skin packaging - Year-over-year growth 2025-2030 (%)
Data Table on Skin packaging - Year-over-year growth 2025-2030 (%)

8.6 Others - Market size and forecast 2025-2030

Chart on Others - Market size and forecast 2025-2030 ($ million)
Data Table on Others - Market size and forecast 2025-2030 ($ million)
Chart on Others - Year-over-year growth 2025-2030 (%)
Data Table on Others - Year-over-year growth 2025-2030 (%)

8.7 Market opportunity by Product Type

Market opportunity by Product Type ($ million)
Data Table on Market opportunity by Product Type ($ million)

9. Market Segmentation by End-user

9.1 Market segments

Chart on End-user - Market share 2025-2030 (%)
Data Table on End-user - Market share 2025-2030 (%)

9.2 Comparison by End-user

Chart on Comparison by End-user
Data Table on Comparison by End-user

9.3 Food and beverages - Market size and forecast 2025-2030

Chart on Food and beverages - Market size and forecast 2025-2030 ($ million)
Data Table on Food and beverages - Market size and forecast 2025-2030 ($ million)
Chart on Food and beverages - Year-over-year growth 2025-2030 (%)
Data Table on Food and beverages - Year-over-year growth 2025-2030 (%)

9.4 Pharmaceuticals - Market size and forecast 2025-2030

Chart on Pharmaceuticals - Market size and forecast 2025-2030 ($ million)
Data Table on Pharmaceuticals - Market size and forecast 2025-2030 ($ million)
Chart on Pharmaceuticals - Year-over-year growth 2025-2030 (%)
Data Table on Pharmaceuticals - Year-over-year growth 2025-2030 (%)

9.5 Personal care and cosmetics - Market size and forecast 2025-2030

Chart on Personal care and cosmetics - Market size and forecast 2025-2030 ($ million)
Data Table on Personal care and cosmetics - Market size and forecast 2025-2030 ($ million)
Chart on Personal care and cosmetics - Year-over-year growth 2025-2030 (%)
Data Table on Personal care and cosmetics - Year-over-year growth 2025-2030 (%)

9.6 Others - Market size and forecast 2025-2030

Chart on Others - Market size and forecast 2025-2030 ($ million)
Data Table on Others - Market size and forecast 2025-2030 ($ million)
Chart on Others - Year-over-year growth 2025-2030 (%)
Data Table on Others - Year-over-year growth 2025-2030 (%)

9.7 Market opportunity by End-user

Market opportunity by End-user ($ million)
Data Table on Market opportunity by End-user ($ million)

10. Market Segmentation by Material

10.1 Market segments

Chart on Material - Market share 2025-2030 (%)
Data Table on Material - Market share 2025-2030 (%)

10.2 Comparison by Material

Chart on Comparison by Material
Data Table on Comparison by Material

10.3 Plastic - Market size and forecast 2025-2030

Chart on Plastic - Market size and forecast 2025-2030 ($ million)
Data Table on Plastic - Market size and forecast 2025-2030 ($ million)
Chart on Plastic - Year-over-year growth 2025-2030 (%)
Data Table on Plastic - Year-over-year growth 2025-2030 (%)

10.4 Paper - Market size and forecast 2025-2030

Chart on Paper - Market size and forecast 2025-2030 ($ million)
Data Table on Paper - Market size and forecast 2025-2030 ($ million)
Chart on Paper - Year-over-year growth 2025-2030 (%)
Data Table on Paper - Year-over-year growth 2025-2030 (%)

10.5 Market opportunity by Material

Market opportunity by Material ($ million)
Data Table on Market opportunity by Material ($ million)

11. Customer Landscape

11.1 Customer landscape overview

Analysis of price sensitivity, lifecycle, customer purchase basket, adoption rates, and purchase criteria

12. Geographic Landscape

12.1 Geographic segmentation

Chart on Market share by geography 2025-2030 (%)
Data Table on Market share by geography 2025-2030 (%)

12.2 Geographic comparison

Chart on Geographic comparison
Data Table on Geographic comparison

12.3 APAC - Market size and forecast 2025-2030

Chart on APAC - Market size and forecast 2025-2030 ($ million)
Data Table on APAC - Market size and forecast 2025-2030 ($ million)
Chart on APAC - Year-over-year growth 2025-2030 (%)
Data Table on APAC - Year-over-year growth 2025-2030 (%)
Chart on Regional Comparison - APAC
Data Table on Regional Comparison - APAC

12.3.1 China - Market size and forecast 2025-2030

Chart on China - Market size and forecast 2025-2030 ($ million)
Data Table on China - Market size and forecast 2025-2030 ($ million)
Chart on China - Year-over-year growth 2025-2030 (%)
Data Table on China - Year-over-year growth 2025-2030 (%)

12.3.2 Japan - Market size and forecast 2025-2030

Chart on Japan - Market size and forecast 2025-2030 ($ million)
Data Table on Japan - Market size and forecast 2025-2030 ($ million)
Chart on Japan - Year-over-year growth 2025-2030 (%)
Data Table on Japan - Year-over-year growth 2025-2030 (%)

12.3.3 South Korea - Market size and forecast 2025-2030

Chart on South Korea - Market size and forecast 2025-2030 ($ million)
Data Table on South Korea - Market size and forecast 2025-2030 ($ million)
Chart on South Korea - Year-over-year growth 2025-2030 (%)
Data Table on South Korea - Year-over-year growth 2025-2030 (%)

12.3.4 India - Market size and forecast 2025-2030

Chart on India - Market size and forecast 2025-2030 ($ million)
Data Table on India - Market size and forecast 2025-2030 ($ million)
Chart on India - Year-over-year growth 2025-2030 (%)
Data Table on India - Year-over-year growth 2025-2030 (%)

12.3.5 Australia - Market size and forecast 2025-2030

Chart on Australia - Market size and forecast 2025-2030 ($ million)
Data Table on Australia - Market size and forecast 2025-2030 ($ million)
Chart on Australia - Year-over-year growth 2025-2030 (%)
Data Table on Australia - Year-over-year growth 2025-2030 (%)

12.3.6 Indonesia - Market size and forecast 2025-2030

Chart on Indonesia - Market size and forecast 2025-2030 ($ million)
Data Table on Indonesia - Market size and forecast 2025-2030 ($ million)
Chart on Indonesia - Year-over-year growth 2025-2030 (%)
Data Table on Indonesia - Year-over-year growth 2025-2030 (%)

12.4 North America - Market size and forecast 2025-2030

Chart on North America - Market size and forecast 2025-2030 ($ million)
Data Table on North America - Market size and forecast 2025-2030 ($ million)
Chart on North America - Year-over-year growth 2025-2030 (%)
Data Table on North America - Year-over-year growth 2025-2030 (%)
Chart on Regional Comparison - North America
Data Table on Regional Comparison - North America

12.4.1 US - Market size and forecast 2025-2030

Chart on US - Market size and forecast 2025-2030 ($ million)
Data Table on US - Market size and forecast 2025-2030 ($ million)
Chart on US - Year-over-year growth 2025-2030 (%)
Data Table on US - Year-over-year growth 2025-2030 (%)

12.4.2 Canada - Market size and forecast 2025-2030

Chart on Canada - Market size and forecast 2025-2030 ($ million)
Data Table on Canada - Market size and forecast 2025-2030 ($ million)
Chart on Canada - Year-over-year growth 2025-2030 (%)
Data Table on Canada - Year-over-year growth 2025-2030 (%)

12.4.3 Mexico - Market size and forecast 2025-2030

Chart on Mexico - Market size and forecast 2025-2030 ($ million)
Data Table on Mexico - Market size and forecast 2025-2030 ($ million)
Chart on Mexico - Year-over-year growth 2025-2030 (%)
Data Table on Mexico - Year-over-year growth 2025-2030 (%)

12.5 Europe - Market size and forecast 2025-2030

Chart on Europe - Market size and forecast 2025-2030 ($ million)
Data Table on Europe - Market size and forecast 2025-2030 ($ million)
Chart on Europe - Year-over-year growth 2025-2030 (%)
Data Table on Europe - Year-over-year growth 2025-2030 (%)
Chart on Regional Comparison - Europe
Data Table on Regional Comparison - Europe

12.5.1 Germany - Market size and forecast 2025-2030

Chart on Germany - Market size and forecast 2025-2030 ($ million)
Data Table on Germany - Market size and forecast 2025-2030 ($ million)
Chart on Germany - Year-over-year growth 2025-2030 (%)
Data Table on Germany - Year-over-year growth 2025-2030 (%)

12.5.2 UK - Market size and forecast 2025-2030

Chart on UK - Market size and forecast 2025-2030 ($ million)
Data Table on UK - Market size and forecast 2025-2030 ($ million)
Chart on UK - Year-over-year growth 2025-2030 (%)
Data Table on UK - Year-over-year growth 2025-2030 (%)

12.5.3 France - Market size and forecast 2025-2030

Chart on France - Market size and forecast 2025-2030 ($ million)
Data Table on France - Market size and forecast 2025-2030 ($ million)
Chart on France - Year-over-year growth 2025-2030 (%)
Data Table on France - Year-over-year growth 2025-2030 (%)

12.5.4 Italy - Market size and forecast 2025-2030

Chart on Italy - Market size and forecast 2025-2030 ($ million)
Data Table on Italy - Market size and forecast 2025-2030 ($ million)
Chart on Italy - Year-over-year growth 2025-2030 (%)
Data Table on Italy - Year-over-year growth 2025-2030 (%)

12.5.5 Spain - Market size and forecast 2025-2030

Chart on Spain - Market size and forecast 2025-2030 ($ million)
Data Table on Spain - Market size and forecast 2025-2030 ($ million)
Chart on Spain - Year-over-year growth 2025-2030 (%)
Data Table on Spain - Year-over-year growth 2025-2030 (%)

12.5.6 The Netherlands - Market size and forecast 2025-2030

Chart on The Netherlands - Market size and forecast 2025-2030 ($ million)
Data Table on The Netherlands - Market size and forecast 2025-2030 ($ million)
Chart on The Netherlands - Year-over-year growth 2025-2030 (%)
Data Table on The Netherlands - Year-over-year growth 2025-2030 (%)

12.6 South America - Market size and forecast 2025-2030

Chart on South America - Market size and forecast 2025-2030 ($ million)
Data Table on South America - Market size and forecast 2025-2030 ($ million)
Chart on South America - Year-over-year growth 2025-2030 (%)
Data Table on South America - Year-over-year growth 2025-2030 (%)
Chart on Regional Comparison - South America
Data Table on Regional Comparison - South America

12.6.1 Brazil - Market size and forecast 2025-2030

Chart on Brazil - Market size and forecast 2025-2030 ($ million)
Data Table on Brazil - Market size and forecast 2025-2030 ($ million)
Chart on Brazil - Year-over-year growth 2025-2030 (%)
Data Table on Brazil - Year-over-year growth 2025-2030 (%)

12.6.2 Argentina - Market size and forecast 2025-2030

Chart on Argentina - Market size and forecast 2025-2030 ($ million)
Data Table on Argentina - Market size and forecast 2025-2030 ($ million)
Chart on Argentina - Year-over-year growth 2025-2030 (%)
Data Table on Argentina - Year-over-year growth 2025-2030 (%)

12.6.3 Chile - Market size and forecast 2025-2030

Chart on Chile - Market size and forecast 2025-2030 ($ million)
Data Table on Chile - Market size and forecast 2025-2030 ($ million)
Chart on Chile - Year-over-year growth 2025-2030 (%)
Data Table on Chile - Year-over-year growth 2025-2030 (%)

12.7 Middle East and Africa - Market size and forecast 2025-2030

Chart on Middle East and Africa - Market size and forecast 2025-2030 ($ million)
Data Table on Middle East and Africa - Market size and forecast 2025-2030 ($ million)
Chart on Middle East and Africa - Year-over-year growth 2025-2030 (%)
Data Table on Middle East and Africa - Year-over-year growth 2025-2030 (%)
Chart on Regional Comparison - Middle East and Africa
Data Table on Regional Comparison - Middle East and Africa

12.7.1 South Africa - Market size and forecast 2025-2030

Chart on South Africa - Market size and forecast 2025-2030 ($ million)
Data Table on South Africa - Market size and forecast 2025-2030 ($ million)
Chart on South Africa - Year-over-year growth 2025-2030 (%)
Data Table on South Africa - Year-over-year growth 2025-2030 (%)

12.7.2 UAE - Market size and forecast 2025-2030

Chart on UAE - Market size and forecast 2025-2030 ($ million)
Data Table on UAE - Market size and forecast 2025-2030 ($ million)
Chart on UAE - Year-over-year growth 2025-2030 (%)
Data Table on UAE - Year-over-year growth 2025-2030 (%)

12.7.3 Saudi Arabia - Market size and forecast 2025-2030

Chart on Saudi Arabia - Market size and forecast 2025-2030 ($ million)
Data Table on Saudi Arabia - Market size and forecast 2025-2030 ($ million)
Chart on Saudi Arabia - Year-over-year growth 2025-2030 (%)
Data Table on Saudi Arabia - Year-over-year growth 2025-2030 (%)

12.7.4 Egypt - Market size and forecast 2025-2030

Chart on Egypt - Market size and forecast 2025-2030 ($ million)
Data Table on Egypt - Market size and forecast 2025-2030 ($ million)
Chart on Egypt - Year-over-year growth 2025-2030 (%)
Data Table on Egypt - Year-over-year growth 2025-2030 (%)

12.7.5 Nigeria - Market size and forecast 2025-2030

Chart on Nigeria - Market size and forecast 2025-2030 ($ million)
Data Table on Nigeria - Market size and forecast 2025-2030 ($ million)
Chart on Nigeria - Year-over-year growth 2025-2030 (%)
Data Table on Nigeria - Year-over-year growth 2025-2030 (%)

12.8 Market opportunity by geography

Market opportunity by geography ($ million)
Data Tables on Market opportunity by geography ($ million)

13. Drivers, Challenges, and Opportunity

13.1 Market drivers

Increasing demand for convenient and sustainable food packaging
Growing demand from pharmaceutical and medical device sectors
Rising pace of technological advancements and material innovation

13.2 Market challenges

Escalating regulatory scrutiny and sustainability mandates
Volatility in raw material pricing and supply chain disruptions
Intensifying competition from alternative packaging formats

13.3 Impact of drivers and challenges

Impact of drivers and challenges in 2025 and 2030

13.4 Market opportunities

Proliferation of mono-material and recycled-content solutions
Integration of smart technologies and automation in manufacturing
Innovations in high-barrier and active packaging solutions

14. Competitive Landscape

14.1 Overview

14.2

Overview on criticality of inputs and factors of differentiation

14.3 Landscape disruption

Overview on factors of disruption

14.4 Industry risks

Impact of key risks on business

15. Competitive Analysis

15.1 Companies profiled

Companies covered

15.2 Company ranking index

15.3 Market positioning of companies

Matrix on companies position and classification

15.4 Amcor Plc

Amcor Plc - Overview
Amcor Plc - Business segments
Amcor Plc - Key news
Amcor Plc - Key offerings
Amcor Plc - Segment focus
SWOT

15.5 BBC Packaging SL

BBC Packaging SL - Overview
BBC Packaging SL - Product / Service
BBC Packaging SL - Key offerings
SWOT

15.6 Berry Global Inc.

Berry Global Inc. - Overview
Berry Global Inc. - Business segments
Berry Global Inc. - Key news
Berry Global Inc. - Key offerings
Berry Global Inc. - Segment focus
SWOT

15.7 CTCI Production

CTCI Production - Overview
CTCI Production - Product / Service
CTCI Production - Key offerings
SWOT

15.8 Dart Container Corp.

Dart Container Corp. - Overview
Dart Container Corp. - Product / Service
Dart Container Corp. - Key offerings
SWOT

15.9 DM THERMOFORMER

DM THERMOFORMER - Overview
DM THERMOFORMER - Product / Service
DM THERMOFORMER - Key offerings
SWOT

15.10 Dordan Manufacturing Co.

Dordan Manufacturing Co. - Overview
Dordan Manufacturing Co. - Product / Service
Dordan Manufacturing Co. - Key offerings
SWOT

15.11 EasyPak LLC

EasyPak LLC - Overview
EasyPak LLC - Product / Service
EasyPak LLC - Key offerings
SWOT

15.12 Huhtamaki Oyj

Huhtamaki Oyj - Overview
Huhtamaki Oyj - Business segments
Huhtamaki Oyj - Key news
Huhtamaki Oyj - Key offerings
Huhtamaki Oyj - Segment focus
SWOT

15.13 ITC Packaging

ITC Packaging - Overview
ITC Packaging - Product / Service
ITC Packaging - Key offerings
SWOT

15.14 Lacerta Group LLC

Lacerta Group LLC - Overview
Lacerta Group LLC - Product / Service
Lacerta Group LLC - Key offerings
SWOT

15.15 Placon Corp.

Placon Corp. - Overview
Placon Corp. - Product / Service
Placon Corp. - Key offerings
SWOT

15.16 Prent Corp.

Prent Corp. - Overview
Prent Corp. - Product / Service
Prent Corp. - Key offerings
SWOT

15.17 Sealed Air Corp.

Sealed Air Corp. - Overview
Sealed Air Corp. - Business segments
Sealed Air Corp. - Key news
Sealed Air Corp. - Key offerings
Sealed Air Corp. - Segment focus
SWOT

15.18 Sonoco Products Co.

Sonoco Products Co. - Overview
Sonoco Products Co. - Business segments
Sonoco Products Co. - Key news
Sonoco Products Co. - Key offerings
Sonoco Products Co. - Segment focus
SWOT

16. Appendix

16.1 Scope of the report

Market definition
Objectives
Notes and caveats

16.2 Inclusions and exclusions checklist

Inclusions checklist
Exclusions checklist

16.3 Currency conversion rates for US$

16.4 Research methodology

16.5 Data procurement

Information sources

16.6 Data validation

16.7 Validation techniques employed for market sizing

16.8 Data synthesis

16.9 360 degree market analysis

16.10 List of abbreviations

Research Methodology

Technavio presents a detailed picture of the market by way of study, synthesis, and summation of data from multiple sources. The analysts have presented the various facets of the market with a particular focus on identifying the key industry influencers. The data thus presented is comprehensive, reliable, and the result of extensive research, both primary and secondary.

INFORMATION SOURCES

Primary sources

  • Manufacturers and suppliers
  • Channel partners
  • Industry experts
  • Strategic decision makers

Secondary sources

  • Industry journals and periodicals
  • Government data
  • Financial reports of key industry players
  • Historical data
  • Press releases

DATA ANALYSIS

Data Synthesis

  • Collation of data
  • Estimation of key figures
  • Analysis of derived insights

Data Validation

  • Triangulation with data models
  • Reference against proprietary databases
  • Corroboration with industry experts

REPORT WRITING

Qualitative

  • Market drivers
  • Market challenges
  • Market trends
  • Five forces analysis

Quantitative

  • Market size and forecast
  • Market segmentation
  • Geographical insights
  • Competitive landscape

Interested in this report?

Get your sample now to see our research methodology and insights!

Download Now

Frequently Asked Questions

Thermoformed Packaging market growth will increase by USD 15157.1 million during 2026-2030 .

The Thermoformed Packaging market is expected to grow at a CAGR of 4.9% during 2026-2030 .

Thermoformed Packaging market is segmented by Product type (Blister packaging, Clamshell packaging, Skin packaging, Others) End-user (Food and beverages, Pharmaceuticals, Personal care and cosmetics, Others) Material (Plastic, Paper)

Amcor Plc, BBC Packaging SL, Berry Global Inc., CTCI Production, Dart Container Corp., DM THERMOFORMER, Dordan Manufacturing Co., EasyPak LLC, ENVAPLASTER SA, Huhtamaki Oyj, ITC Packaging, Lacerta Group LLC, NEFAB GROUP, Placon Corp., Prent Corp., Sealed Air Corp., Silgan Holdings Inc., Sinclair and Rush Inc., Sonoco Products Co., USK Balaji Plast Pvt. Ltd. are a few of the key vendors in the Thermoformed Packaging market.

APAC will register the highest growth rate of 45.6% among the other regions. Therefore, the Thermoformed Packaging market in APAC is expected to garner significant business opportunities for the vendors during the forecast period.

China, Japan, South Korea, India, Australia, Indonesia, US, Canada, Mexico, Germany, UK, France, Italy, Spain, The Netherlands, Brazil, Argentina, Chile, South Africa, UAE, Saudi Arabia, Egypt, Nigeria

  • Increasing demand for convenient and sustainable food packaging is the driving factor this market.

The Thermoformed Packaging market vendors should focus on grabbing business opportunities from the Product type segment as it accounted for the largest market share in the base year.