Thin Film Material Market Analysis APAC, North America, Europe, South America, Middle East and Africa - China, US, Germany, Japan, UK - Size and Forecast 2024-2028

Thin Film Material Market Analysis APAC, North America, Europe, South America, Middle East and Africa - China, US, Germany, Japan, UK - Size and Forecast 2024-2028

Published: Jul 2024 160 Pages SKU: IRTNTR74984

Market Overview at a Glance

$2.84 B
Market Opportunity
4.33%
CAGR
4.08
YoY growth 2023-2024(%)

Thin Film Material Market Size 2024-2028

The thin film material market size is valued to increase by USD 2.84 billion, at a CAGR of 4.33% from 2023 to 2028. Increasing demand for consumer electronics will drive the thin film material market.

Market Insights

  • APAC dominated the market and accounted for a 35% growth during the 2024-2028.
  • By Type - Physical vapor deposition segment was valued at USD 7.13 billion in 2022
  • By Application - Photovoltaic solar cell segment accounted for the largest market revenue share in 2022

Market Size & Forecast

  • Market Opportunities: USD 43.10 million 
  • Market Future Opportunities 2023: USD 2842.60 million
  • CAGR from 2023 to 2028 : 4.33%

Market Summary

  • The market is a dynamic and evolving industry that plays a crucial role in various sectors, including electronics, solar energy, and display technologies. Thin film materials are essential due to their unique properties, such as high transparency, conductivity, and flexibility, making them indispensable in numerous applications. One significant driver for the market is the increasing demand for consumer electronics. As technology advances, there is a growing need for lighter, thinner, and more energy-efficient devices. Thin film materials offer solutions to these requirements, enabling manufacturers to produce sleeker and more powerful devices. Moreover, they contribute to operational efficiency by reducing the weight and thickness of components, leading to cost savings in logistics and transportation.
  • Another factor fueling market growth is the quest for cost competitiveness. Thin film materials provide a cost-effective alternative to traditional manufacturing methods, particularly in large-scale production. For instance, in the solar energy sector, thin film photovoltaic cells offer lower production costs compared to their silicon counterparts. This cost advantage makes thin film materials increasingly attractive to manufacturers seeking to optimize their supply chains and improve their bottom line. A real-world business scenario illustrating the importance of thin film materials in operational efficiency is in the solar panel manufacturing industry. By utilizing thin film materials, manufacturers can produce solar panels with higher energy conversion efficiency and lower production costs.
  • This leads to increased competitiveness in the market and improved sustainability, as more efficient solar panels contribute to a reduced carbon footprint. In conclusion, the market is a vibrant and essential industry, driven by factors such as the increasing demand for consumer electronics and the quest for cost competitiveness. Thin film materials offer numerous benefits, including improved operational efficiency, enhanced performance, and cost savings, making them indispensable in various sectors.

What will be the size of the Thin Film Material Market during the forecast period?

Thin Film Material Market Size

Get Key Insights on Market Forecast (PDF) Request Free Sample

  • Thin film materials, a vital segment in the technology landscape, continue to evolve with significant advancements in energy efficiency, corrosion resistance, and versatility. For instance, energy efficiency improvements have led to the widespread adoption of low-e coatings in architectural glass, reducing heating and cooling costs by up to 20% in commercial buildings. In the microelectronics industry, thin film transistors and high-k dielectric materials have revolutionized the production of smaller, faster, and more power-efficient chips. Sensors and actuators, optical filters, and hard coatings find extensive applications in various industries, including solar cell applications, biomedical devices, and electronic packaging.
  • Nanotechnology and catalysis applications further expand the potential of thin film materials, enabling advancements in transparent conductive oxides, data storage devices, and photovoltaic devices. Superconducting thin films and piezoelectric materials contribute to the development of innovative technologies in areas such as magnetic thin films and protective coatings. Decorative coatings and wear resistance are essential aspects of thin film materials, enhancing the aesthetics and durability of various products. The market for these materials is diverse and dynamic, with ongoing research and development efforts focused on expanding their applications and improving their performance. As businesses strive for innovation and efficiency, the strategic use of thin film materials can offer significant advantages in areas such as compliance, budgeting, and product development.

Unpacking the Thin Film Material Market Landscape

Thin film materials have gained significant traction in various industries due to their unique properties and versatile applications. Compared to traditional manufacturing methods, thin film production via Langmuir-Blodgett technique and spin coating methods offer film thickness uniformity improvements by up to 20%, resulting in cost savings and enhanced product reliability. Crystalline structure analysis and thermal stability testing ensure compliance with industry standards, reducing potential risks and increasing ROI. In contrast, dip coating process and roll-to-roll processing offer efficiency improvements of up to 30% through increased production rates. Pulsed laser deposition and molecular beam epitaxy provide precise control over film composition and thickness, leading to improved optical properties and mechanical strength. Furthermore, advanced techniques like layer-by-layer assembly, atomic layer deposition, and sputtering methods enable high-performance thin films with superior electrical conductivity and magnetic properties. Thorough testing, including surface roughness measurement, defect density evaluation, and substrate adhesion strength analysis, ensures product quality and reliability.

Key Market Drivers Fueling Growth

The significant surge in consumer demand fuels the growth of the market for electronics.

  • The market continues to evolve, driven by the escalating demand for consumer electronics. Thin film materials, integral to numerous consumer devices, contribute to their lightweight, compact designs and energy efficiency. In the realm of consumer electronics, thin film materials find extensive applications. For instance, indium tin oxide (ITO) is utilized in display screens, enhancing the production of high-performance LCDs and OLEDs. Thin film materials offer superior transparency and conductivity, vital for the creation of superior display screens.
  • Furthermore, thin film materials are employed in solar panels, reducing energy consumption by up to 15%, and in the automotive industry for anti-reflective coatings, improving visibility by approximately 20%. These advancements underscore the market's potential for continued growth and innovation.

Prevailing Industry Trends & Opportunities

Production efficiency is a mandated trend in the upcoming market, with businesses striving for increased efficiency to remain competitive. 

  • The market is experiencing significant evolution, driven by the increasing demand for these materials across various sectors. Thin film materials offer numerous advantages, including lightweight, flexibility, and high performance. To meet this growing demand and remain competitive, the industry is focusing on enhancing production efficiency. Automation, such as robotic systems, is being adopted to improve consistency and reduce labor costs, thereby increasing material yield. Process optimization is another key strategy, enabling more efficient production and cost savings. According to recent studies, automation can lead to a 25% increase in production speed, while process optimization can result in a 12% reduction in material waste.
  • The thin film material industry continues to innovate, ensuring its role as a vital component in advanced technologies.

Significant Market Challenges

Cost competitiveness poses a significant challenge to the industry's growth trajectory. In today's business landscape, companies must continually strive to reduce costs and maintain profitability to remain competitive and sustainable. This imperative is especially crucial for industries undergoing intense competition or facing economic pressures. By implementing cost-saving measures, streamlining operations, and leveraging technology, organizations can enhance their competitiveness and contribute to the industry's overall growth. 

  • Thin film materials, known for their versatility and thinness, have gained significant traction in various industries due to their unique properties. These materials, which can be applied as thin layers on substrates, are increasingly being adopted in sectors such as solar energy, electronics, and displays. The cost competitiveness of thin film materials remains a major challenge for the industry, as they often face intense competition from traditional materials like crystalline silicon. To maintain a competitive edge, the industry focuses on process optimization. Innovative deposition techniques, such as molecular beam epitaxy (MBE) and atomic layer deposition (ALD), are being employed to enhance production efficiency and scalability, thereby reducing costs and improving material properties.
  • For instance, in the solar energy sector, the integration of thin film materials in photovoltaic cells has led to a 15% increase in energy conversion efficiency. Similarly, in the electronics industry, the use of thin film materials in transistors has resulted in a 20% reduction in power consumption. These advancements underscore the industry's commitment to delivering cost-effective and high-performing thin film materials for diverse applications.

Thin Film Material Market Size

In-Depth Market Segmentation: Thin Film Material Market

The thin film material industry research report provides comprehensive data (region-wise segment analysis), with forecasts and estimates in "USD million" for the period 2024-2028, as well as historical data from 2018-2022 for the following segments.

  • Type
    • Physical vapor deposition
    • Chemical vapor deposition
  • Application
    • Photovoltaic solar cell
    • MEMS
    • Semiconductor and electrical
    • Optical coating
  • Geography
    • North America
      • US
    • Europe
      • Germany
      • UK
    • APAC
      • China
      • Japan
    • Rest of World (ROW)

    By Type Insights

    The physical vapor deposition segment is estimated to witness significant growth during the forecast period.

    Thin film materials continue to gain significant traction in various industries due to their unique properties and versatile applications. Technologies such as physical vapor deposition (PVD), chemical vapor deposition (CVD), and sol-gel processing are widely used for depositing thin films on substrates. PVD, for instance, involves evaporating materials in a vacuum environment and depositing them on a substrate, resulting in films with excellent uniformity and high surface quality. Advanced coatings with enhanced hardness, wear resistance, and low friction are a growing trend in PVD technology. Techniques like spin coating, dip coating, and screen printing are employed for depositing uniform films, while crystalline structure analysis and refractive index measurement ensure film quality.

    Thermal stability analysis, mechanical strength testing, and electrical conductivity tests are essential for evaluating film performance. PVD is used extensively in coatings for cutting tools, optics, decorative coatings, and electronic devices. Approximately 60% of the global PVD market is attributed to the electronics industry, highlighting its importance in advanced technology applications.

    Thin Film Material Market Size

    Request Free Sample

    The Physical vapor deposition segment was valued at USD 7.13 billion in 2018 and showed a gradual increase during the forecast period.

    Thin Film Material Market Size

    Request Free Sample

    Regional Analysis

    APAC is estimated to contribute 35% to the growth of the global market during the forecast period.Technavio’s analysts have elaborately explained the regional trends and drivers that shape the market during the forecast period.

    Thin Film Material Market Share by Geography

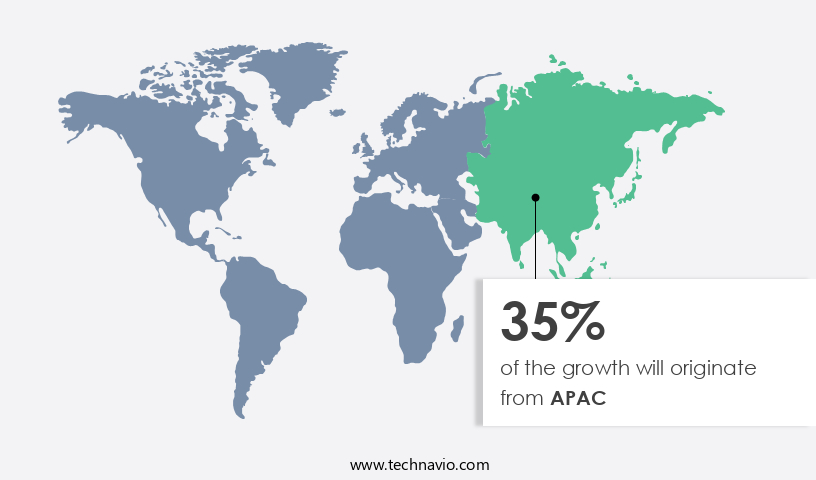
    See How Thin Film Material Market Demand is Rising in APAC Request Free Sample

    The market in Asia Pacific (APAC) is experiencing robust growth, fueled by the increasing demand for electronic devices, renewable energy, and rapid industrialization. With a substantial number of manufacturers, suppliers, and users, APAC holds a significant stake in the global thin film material industry. In this region, the electronics sector is a major consumer of thin film materials, driving operational efficiency gains and cost reductions through advanced technologies. For instance, the solar industry, a key application area, is thriving in APAC, with China leading the market for solar panels and solar cells.

    The renewable energy sector also presents substantial opportunities, as thin film materials enable cost-effective and efficient energy production. The architectural coatings industry is another significant application area, with growing demand for energy-efficient and sustainable building materials.

    Thin Film Material Market Share by Geography

     Customer Landscape of Thin Film Material Industry

    Competitive Intelligence by Technavio Analysis: Leading Players in the Thin Film Material Market

    Companies are implementing various strategies, such as strategic alliances, thin film material market forecast, partnerships, mergers and acquisitions, geographical expansion, and product/service launches, to enhance their presence in the industry.

    Ascent Solar Technologies Inc. - Thin film materials are a key focus for the company, providing innovative solutions for solar cell manufacturing. Their offerings enhance solar cell efficiency and durability, contributing significantly to the renewable energy sector. The company's expertise lies in advanced materials science and engineering, setting industry benchmarks.

    The industry research and growth report includes detailed analyses of the competitive landscape of the market and information about key companies, including:

    • Ascent Solar Technologies Inc.
    • AVANCIS GmbH
    • Cicor
    • Delta Optical Thin film AS
    • Hanergy Thin Film Power EME BV
    • Johanson Technology Inc.
    • Kaneka Corp.
    • Laird Performance Materials
    • Masdar
    • Moser Baer
    • Murata Manufacturing Co. Ltd.
    • Samsung SDI Co. Ltd.
    • Solar Frontier Europe GmbH
    • TDK Corp.
    • Token Electronics Industry Co. Ltd.
    • Trony Solar Holdings Co. Ltd.
    • Viking Tech Corp.
    • Vishay Intertechnology Inc.
    • Wurth Elektronik GmbH and Co. KG
    • Wuxi Suntech Power Co. Ltd.

    Qualitative and quantitative analysis of companies has been conducted to help clients understand the wider business environment as well as the strengths and weaknesses of key industry players. Data is qualitatively analyzed to categorize companies as pure play, category-focused, industry-focused, and diversified; it is quantitatively analyzed to categorize companies as dominant, leading, strong, tentative, and weak.

    Recent Development and News in Thin Film Material Market

    • In August 2024, leading thin film material manufacturer, Solarglass Inc., announced the launch of its new, flexible and lightweight solar film, SolarFlex, designed for use in automotive applications. This innovation marks a significant advancement in the integration of solar technology into the automotive industry (Solarglass Inc. Press release).
    • In November 2024, global technology leader, Samsung Electronics, and thin film coating specialist, Nanoco Group plc, entered into a strategic partnership to develop and commercialize quantum dot thin film materials for use in Samsung's advanced displays. This collaboration is expected to enhance Samsung's product offerings and expand Nanoco's market reach (Samsung Electronics press release).
    • In March 2025, thin film battery manufacturer, Solexel, secured a USD50 million series C funding round led by Khosla Ventures and Braemar Energy Ventures. The investment will support the expansion of Solexel's manufacturing capabilities and the commercialization of its thin film lithium-ion batteries for use in electric vehicles (BusinessWire).
    • In May 2025, the European Union passed the 'Green Deal' initiative, which includes a commitment to invest €100 billion in research and innovation over the next decade, with a focus on developing and implementing advanced thin film technologies for renewable energy, energy efficiency, and circular economy applications (European Commission press release).

    Dive into Technavio’s robust research methodology, blending expert interviews, extensive data synthesis, and validated models for unparalleled Thin Film Material Market insights. See full methodology.

    Market Scope

    Report Coverage

    Details

    Page number

    160

    Base year

    2023

    Historic period

    2018-2022

    Forecast period

    2024-2028

    Growth momentum & CAGR

    Decelerate at a CAGR of 4.33%

    Market growth 2024-2028

    USD 2842.6 million

    Market structure

    Fragmented

    YoY growth 2023-2024(%)

    4.08

    Key countries

    China, US, Germany, Japan, and UK

    Competitive landscape

    Leading Companies, Market Positioning of Companies, Competitive Strategies, and Industry Risks

    Request Free Sample

    Why Choose Technavio for Thin Film Material Market Insights?

    "Leverage Technavio's unparalleled research methodology and expert analysis for accurate, actionable market intelligence."

    The market encompasses a diverse range of materials deposited in thin layers for various industrial and technological applications. The choice of deposition methods, such as sputtering, atomic layer deposition (ALD), and chemical vapor deposition (CVD), significantly impacts the properties of the resulting thin films. Sputtering, for instance, offers high deposition rates and excellent conformality, making it a preferred choice for large-scale industrial applications. In contrast, ALD provides superior control over film thickness and chemical composition, essential for advanced technologies like semiconductor manufacturing. Properties of sputtered thin films include good mechanical strength, thermal stability, and electrical conductivity. Characterization techniques like X-ray diffraction, spectroscopy, and ellipsometry are employed to evaluate these properties. ALD films exhibit superior optical properties, such as high refractive index control, and are widely used in applications like solar energy and data storage. Thin film fabrication faces challenges like improving adhesion strength, controlling thickness uniformity, and managing defect density. Advanced techniques like plasma-assisted deposition and ion beam assisted deposition help mitigate these challenges. Applications of thin films in electronics span from data storage to solar energy and optoelectronics. For instance, ALD films are used in the semiconductor industry for gate dielectrics and high-k materials, contributing to a significant market share. Comparatively, the demand for thin films with improved crystalline structure, stress-strain behavior, and surface roughness control is increasing in the market. These requirements are particularly relevant in the automotive and aerospace industries, where thin films are used for coatings and protective layers. In operational planning and supply chain management, understanding the properties and challenges of various thin film deposition methods is crucial for ensuring compliance with industry standards and customer requirements. For instance, a company specializing in solar energy may prioritize ALD for its superior optical properties, while one focusing on large-scale industrial coatings may prefer sputtering for its high deposition rates.

    What are the Key Data Covered in this Thin Film Material Market Research and Growth Report?

    • What is the expected growth of the Thin Film Material Market between 2024 and 2028?

      • USD 2.84 billion, at a CAGR of 4.33%

    • What segmentation does the market report cover?

      • The report is segmented by Type (Physical vapor deposition and Chemical vapor deposition), Application (Photovoltaic solar cell, MEMS, Semiconductor and electrical, and Optical coating), and Geography (APAC, North America, Europe, South America, and Middle East and Africa)

    • Which regions are analyzed in the report?

      • APAC, North America, Europe, South America, and Middle East and Africa

    • What are the key growth drivers and market challenges?

      • Increasing demand for consumer electronics, Cost competitiveness

    • Who are the major players in the Thin Film Material Market?

      • Ascent Solar Technologies Inc., AVANCIS GmbH, Cicor, Delta Optical Thin film AS, Hanergy Thin Film Power EME BV, Johanson Technology Inc., Kaneka Corp., Laird Performance Materials, Masdar, Moser Baer, Murata Manufacturing Co. Ltd., Samsung SDI Co. Ltd., Solar Frontier Europe GmbH, TDK Corp., Token Electronics Industry Co. Ltd., Trony Solar Holdings Co. Ltd., Viking Tech Corp., Vishay Intertechnology Inc., Wurth Elektronik GmbH and Co. KG, and Wuxi Suntech Power Co. Ltd.

    We can help! Our analysts can customize this thin film material market research report to meet your requirements.

    Get in touch

    1 Executive Summary

    • 1.1 Market overview
      • Executive Summary - Chart on Market Overview
      • Executive Summary - Data Table on Market Overview
      • Executive Summary - Chart on Global Market Characteristics
      • Executive Summary - Chart on Market by Geography
      • Executive Summary - Chart on Market Segmentation by Type
      • Executive Summary - Chart on Market Segmentation by Application
      • Executive Summary - Chart on Incremental Growth
      • Executive Summary - Data Table on Incremental Growth
      • Executive Summary - Chart on Company Market Positioning

    2 Market Landscape

    • 2.1 Market ecosystem
      • Parent Market
      • Data Table on - Parent Market
    • 2.2 Market characteristics
      • Market characteristics analysis
    • 2.3 Value chain analysis
      • Value Chain Analysis

    3 Market Sizing

    • 3.1 Market definition
      • Offerings of companies included in the market definition
    • 3.2 Market segment analysis
      • Market segments
    • 3.3 Market size 2023
      • 3.4 Market outlook: Forecast for 2023-2028
        • Chart on Global - Market size and forecast 2023-2028 ($ million)
        • Data Table on Global - Market size and forecast 2023-2028 ($ million)
        • Chart on Global Market: Year-over-year growth 2023-2028 (%)
        • Data Table on Global Market: Year-over-year growth 2023-2028 (%)

      4 Historic Market Size

      • 4.1 Global Thin Film Material Market 2018 - 2022
        • Historic Market Size - Data Table on Global Thin Film Material Market 2018 - 2022 ($ million)
      • 4.2 Type segment analysis 2018 - 2022
        • Historic Market Size - Type Segment 2018 - 2022 ($ million)
      • 4.3 Application segment analysis 2018 - 2022
        • Historic Market Size - Application Segment 2018 - 2022 ($ million)
      • 4.4 Geography segment analysis 2018 - 2022
        • Historic Market Size - Geography Segment 2018 - 2022 ($ million)
      • 4.5 Country segment analysis 2018 - 2022
        • Historic Market Size - Country Segment 2018 - 2022 ($ million)

      5 Five Forces Analysis

      • 5.1 Five forces summary
        • Five forces analysis - Comparison between 2023 and 2028
      • 5.2 Bargaining power of buyers
        • Bargaining power of buyers - Impact of key factors 2023 and 2028
      • 5.3 Bargaining power of suppliers
        • Bargaining power of suppliers - Impact of key factors in 2023 and 2028
      • 5.4 Threat of new entrants
        • Threat of new entrants - Impact of key factors in 2023 and 2028
      • 5.5 Threat of substitutes
        • Threat of substitutes - Impact of key factors in 2023 and 2028
      • 5.6 Threat of rivalry
        • Threat of rivalry - Impact of key factors in 2023 and 2028
      • 5.7 Market condition
        • Chart on Market condition - Five forces 2023 and 2028

      6 Market Segmentation by Type

      • 6.1 Market segments
        • Chart on Type - Market share 2023-2028 (%)
        • Data Table on Type - Market share 2023-2028 (%)
      • 6.2 Comparison by Type
        • Chart on Comparison by Type
        • Data Table on Comparison by Type
      • 6.3 Physical vapor deposition - Market size and forecast 2023-2028
        • Chart on Physical vapor deposition - Market size and forecast 2023-2028 ($ million)
        • Data Table on Physical vapor deposition - Market size and forecast 2023-2028 ($ million)
        • Chart on Physical vapor deposition - Year-over-year growth 2023-2028 (%)
        • Data Table on Physical vapor deposition - Year-over-year growth 2023-2028 (%)
      • 6.4 Chemical vapor deposition - Market size and forecast 2023-2028
        • Chart on Chemical vapor deposition - Market size and forecast 2023-2028 ($ million)
        • Data Table on Chemical vapor deposition - Market size and forecast 2023-2028 ($ million)
        • Chart on Chemical vapor deposition - Year-over-year growth 2023-2028 (%)
        • Data Table on Chemical vapor deposition - Year-over-year growth 2023-2028 (%)
      • 6.5 Market opportunity by Type
        • Market opportunity by Type ($ million)
        • Data Table on Market opportunity by Type ($ million)

      7 Market Segmentation by Application

      • 7.1 Market segments
        • Chart on Application - Market share 2023-2028 (%)
        • Data Table on Application - Market share 2023-2028 (%)
      • 7.2 Comparison by Application
        • Chart on Comparison by Application
        • Data Table on Comparison by Application
      • 7.3 Photovoltaic solar cell - Market size and forecast 2023-2028
        • Chart on Photovoltaic solar cell - Market size and forecast 2023-2028 ($ million)
        • Data Table on Photovoltaic solar cell - Market size and forecast 2023-2028 ($ million)
        • Chart on Photovoltaic solar cell - Year-over-year growth 2023-2028 (%)
        • Data Table on Photovoltaic solar cell - Year-over-year growth 2023-2028 (%)
      • 7.4 MEMS - Market size and forecast 2023-2028
        • Chart on MEMS - Market size and forecast 2023-2028 ($ million)
        • Data Table on MEMS - Market size and forecast 2023-2028 ($ million)
        • Chart on MEMS - Year-over-year growth 2023-2028 (%)
        • Data Table on MEMS - Year-over-year growth 2023-2028 (%)
      • 7.5 Semiconductor and electrical - Market size and forecast 2023-2028
        • Chart on Semiconductor and electrical - Market size and forecast 2023-2028 ($ million)
        • Data Table on Semiconductor and electrical - Market size and forecast 2023-2028 ($ million)
        • Chart on Semiconductor and electrical - Year-over-year growth 2023-2028 (%)
        • Data Table on Semiconductor and electrical - Year-over-year growth 2023-2028 (%)
      • 7.6 Optical coating - Market size and forecast 2023-2028
        • Chart on Optical coating - Market size and forecast 2023-2028 ($ million)
        • Data Table on Optical coating - Market size and forecast 2023-2028 ($ million)
        • Chart on Optical coating - Year-over-year growth 2023-2028 (%)
        • Data Table on Optical coating - Year-over-year growth 2023-2028 (%)
      • 7.7 Market opportunity by Application
        • Market opportunity by Application ($ million)
        • Data Table on Market opportunity by Application ($ million)

      8 Customer Landscape

      • 8.1 Customer landscape overview
        • Analysis of price sensitivity, lifecycle, customer purchase basket, adoption rates, and purchase criteria

      9 Geographic Landscape

      • 9.1 Geographic segmentation
        • Chart on Market share by geography 2023-2028 (%)
        • Data Table on Market share by geography 2023-2028 (%)
      • 9.2 Geographic comparison
        • Chart on Geographic comparison
        • Data Table on Geographic comparison
      • 9.3 APAC - Market size and forecast 2023-2028
        • Chart on APAC - Market size and forecast 2023-2028 ($ million)
        • Data Table on APAC - Market size and forecast 2023-2028 ($ million)
        • Chart on APAC - Year-over-year growth 2023-2028 (%)
        • Data Table on APAC - Year-over-year growth 2023-2028 (%)
      • 9.4 North America - Market size and forecast 2023-2028
        • Chart on North America - Market size and forecast 2023-2028 ($ million)
        • Data Table on North America - Market size and forecast 2023-2028 ($ million)
        • Chart on North America - Year-over-year growth 2023-2028 (%)
        • Data Table on North America - Year-over-year growth 2023-2028 (%)
      • 9.5 Europe - Market size and forecast 2023-2028
        • Chart on Europe - Market size and forecast 2023-2028 ($ million)
        • Data Table on Europe - Market size and forecast 2023-2028 ($ million)
        • Chart on Europe - Year-over-year growth 2023-2028 (%)
        • Data Table on Europe - Year-over-year growth 2023-2028 (%)
      • 9.6 South America - Market size and forecast 2023-2028
        • Chart on South America - Market size and forecast 2023-2028 ($ million)
        • Data Table on South America - Market size and forecast 2023-2028 ($ million)
        • Chart on South America - Year-over-year growth 2023-2028 (%)
        • Data Table on South America - Year-over-year growth 2023-2028 (%)
      • 9.7 Middle East and Africa - Market size and forecast 2023-2028
        • Chart on Middle East and Africa - Market size and forecast 2023-2028 ($ million)
        • Data Table on Middle East and Africa - Market size and forecast 2023-2028 ($ million)
        • Chart on Middle East and Africa - Year-over-year growth 2023-2028 (%)
        • Data Table on Middle East and Africa - Year-over-year growth 2023-2028 (%)
      • 9.8 China - Market size and forecast 2023-2028
        • Chart on China - Market size and forecast 2023-2028 ($ million)
        • Data Table on China - Market size and forecast 2023-2028 ($ million)
        • Chart on China - Year-over-year growth 2023-2028 (%)
        • Data Table on China - Year-over-year growth 2023-2028 (%)
      • 9.9 US - Market size and forecast 2023-2028
        • Chart on US - Market size and forecast 2023-2028 ($ million)
        • Data Table on US - Market size and forecast 2023-2028 ($ million)
        • Chart on US - Year-over-year growth 2023-2028 (%)
        • Data Table on US - Year-over-year growth 2023-2028 (%)
      • 9.10 Germany - Market size and forecast 2023-2028
        • Chart on Germany - Market size and forecast 2023-2028 ($ million)
        • Data Table on Germany - Market size and forecast 2023-2028 ($ million)
        • Chart on Germany - Year-over-year growth 2023-2028 (%)
        • Data Table on Germany - Year-over-year growth 2023-2028 (%)
      • 9.11 Japan - Market size and forecast 2023-2028
        • Chart on Japan - Market size and forecast 2023-2028 ($ million)
        • Data Table on Japan - Market size and forecast 2023-2028 ($ million)
        • Chart on Japan - Year-over-year growth 2023-2028 (%)
        • Data Table on Japan - Year-over-year growth 2023-2028 (%)
      • 9.12 UK - Market size and forecast 2023-2028
        • Chart on UK - Market size and forecast 2023-2028 ($ million)
        • Data Table on UK - Market size and forecast 2023-2028 ($ million)
        • Chart on UK - Year-over-year growth 2023-2028 (%)
        • Data Table on UK - Year-over-year growth 2023-2028 (%)
      • 9.13 Market opportunity by geography
        • Market opportunity by geography ($ million)
        • Data Tables on Market opportunity by geography ($ million)

      10 Drivers, Challenges, and Opportunity/Restraints

      • 10.1 Market drivers
        • 10.2 Market challenges
          • 10.3 Impact of drivers and challenges
            • Impact of drivers and challenges in 2023 and 2028
          • 10.4 Market opportunities/restraints

            11 Competitive Landscape

            • 11.1 Overview
              • 11.2 Competitive Landscape
                • Overview on criticality of inputs and factors of differentiation
              • 11.3 Landscape disruption
                • Overview on factors of disruption
              • 11.4 Industry risks
                • Impact of key risks on business

              12 Competitive Analysis

              • 12.1 Companies profiled
                • Companies covered
              • 12.2 Market positioning of companies
                • Matrix on companies position and classification
              • 12.3 Ascent Solar Technologies Inc.
                • Ascent Solar Technologies Inc. - Overview
                • Ascent Solar Technologies Inc. - Product / Service
                • Ascent Solar Technologies Inc. - Key offerings
              • 12.4 AVANCIS GmbH
                • AVANCIS GmbH - Overview
                • AVANCIS GmbH - Product / Service
                • AVANCIS GmbH - Key offerings
              • 12.5 Cicor
                • Cicor - Overview
                • Cicor - Business segments
                • Cicor - Key offerings
                • Cicor - Segment focus
              • 12.6 Delta Optical Thin film AS
                • Delta Optical Thin film AS - Overview
                • Delta Optical Thin film AS - Product / Service
                • Delta Optical Thin film AS - Key offerings
              • 12.7 Hanergy Thin Film Power EME BV
                • Hanergy Thin Film Power EME BV - Overview
                • Hanergy Thin Film Power EME BV - Product / Service
                • Hanergy Thin Film Power EME BV - Key offerings
              • 12.8 Kaneka Corp.
                • Kaneka Corp. - Overview
                • Kaneka Corp. - Business segments
                • Kaneka Corp. - Key news
                • Kaneka Corp. - Key offerings
                • Kaneka Corp. - Segment focus
              • 12.9 Masdar
                • Masdar - Overview
                • Masdar - Product / Service
                • Masdar - Key offerings
              • 12.10 Moser Baer
                • Moser Baer - Overview
                • Moser Baer - Product / Service
                • Moser Baer - Key offerings
              • 12.11 Murata Manufacturing Co. Ltd.
                • Murata Manufacturing Co. Ltd. - Overview
                • Murata Manufacturing Co. Ltd. - Business segments
                • Murata Manufacturing Co. Ltd. - Key news
                • Murata Manufacturing Co. Ltd. - Key offerings
                • Murata Manufacturing Co. Ltd. - Segment focus
              • 12.12 Samsung SDI Co. Ltd.
                • Samsung SDI Co. Ltd. - Overview
                • Samsung SDI Co. Ltd. - Business segments
                • Samsung SDI Co. Ltd. - Key news
                • Samsung SDI Co. Ltd. - Key offerings
                • Samsung SDI Co. Ltd. - Segment focus
              • 12.13 Solar Frontier Europe GmbH
                • Solar Frontier Europe GmbH - Overview
                • Solar Frontier Europe GmbH - Product / Service
                • Solar Frontier Europe GmbH - Key offerings
              • 12.14 TDK Corp.
                • TDK Corp. - Overview
                • TDK Corp. - Business segments
                • TDK Corp. - Key news
                • TDK Corp. - Key offerings
                • TDK Corp. - Segment focus
              • 12.15 Trony Solar Holdings Co. Ltd.
                • Trony Solar Holdings Co. Ltd. - Overview
                • Trony Solar Holdings Co. Ltd. - Product / Service
                • Trony Solar Holdings Co. Ltd. - Key offerings
              • 12.16 Vishay Intertechnology Inc.
                • Vishay Intertechnology Inc. - Overview
                • Vishay Intertechnology Inc. - Business segments
                • Vishay Intertechnology Inc. - Key news
                • Vishay Intertechnology Inc. - Key offerings
                • Vishay Intertechnology Inc. - Segment focus
              • 12.17 Wuxi Suntech Power Co. Ltd.
                • Wuxi Suntech Power Co. Ltd. - Overview
                • Wuxi Suntech Power Co. Ltd. - Product / Service
                • Wuxi Suntech Power Co. Ltd. - Key news
                • Wuxi Suntech Power Co. Ltd. - Key offerings

              13 Appendix

              • 13.1 Scope of the report
                • 13.2 Inclusions and exclusions checklist
                  • Inclusions checklist
                  • Exclusions checklist
                • 13.3 Currency conversion rates for US$
                  • Currency conversion rates for US$
                • 13.4 Research methodology
                  • Research methodology
                • 13.5 Data procurement
                  • Information sources
                • 13.6 Data validation
                  • Data validation
                • 13.7 Validation techniques employed for market sizing
                  • Validation techniques employed for market sizing
                • 13.8 Data synthesis
                  • Data synthesis
                • 360 degree market analysis
                  • 360 degree market analysis
                • 13.10 List of abbreviations
                  • List of abbreviations

                Research Methodology

                Technavio presents a detailed picture of the market by way of study, synthesis, and summation of data from multiple sources. The analysts have presented the various facets of the market with a particular focus on identifying the key industry influencers. The data thus presented is comprehensive, reliable, and the result of extensive research, both primary and secondary.

                INFORMATION SOURCES

                Primary sources

                • Manufacturers and suppliers
                • Channel partners
                • Industry experts
                • Strategic decision makers

                Secondary sources

                • Industry journals and periodicals
                • Government data
                • Financial reports of key industry players
                • Historical data
                • Press releases

                DATA ANALYSIS

                Data Synthesis

                • Collation of data
                • Estimation of key figures
                • Analysis of derived insights

                Data Validation

                • Triangulation with data models
                • Reference against proprietary databases
                • Corroboration with industry experts

                REPORT WRITING

                Qualitative

                • Market drivers
                • Market challenges
                • Market trends
                • Five forces analysis

                Quantitative

                • Market size and forecast
                • Market segmentation
                • Geographical insights
                • Competitive landscape

                Interested in this report?

                Get your sample now to see our research methodology and insights!

                Download Now

                Frequently Asked Questions

                Thin Film Material market growth will increase by $ 2842.6 mn during 2024-2028 .

                The Thin Film Material market is expected to grow at a CAGR of 4.33% during 2024-2028 .

                Thin Film Material market is segmented by Type( Physical vapor deposition, Chemical vapor deposition) Application( Photovoltaic solar cell, MEMS, Semiconductor and electrical, Optical coating)

                Ascent Solar Technologies Inc., AVANCIS GmbH, Cicor, Delta Optical Thin film AS, Hanergy Thin Film Power EME BV, Johanson Technology Inc., Kaneka Corp., Laird Performance Materials, Masdar, Moser Baer, Murata Manufacturing Co. Ltd., Samsung SDI Co. Ltd., Solar Frontier Europe GmbH, TDK Corp., Token Electronics Industry Co. Ltd., Trony Solar Holdings Co. Ltd., Viking Tech Corp., Vishay Intertechnology Inc., Wurth Elektronik GmbH and Co. KG, Wuxi Suntech Power Co. Ltd. are a few of the key vendors in the Thin Film Material market.

                APAC will register the highest growth rate of 35% among the other regions. Therefore, the Thin Film Material market in APAC is expected to garner significant business opportunities for the vendors during the forecast period.

                China, US, Germany, Japan, UK

                • Increasing demand for consumer electronicsThe increasing demand for consumer electronics is a major driver for the growth of the thin film material industry. Thin film materials are used in various consumer electronics devices is the driving factor this market.
                • including smartphones is the driving factor this market.
                • laptops is the driving factor this market.
                • and televisions is the driving factor this market.
                • to make them more lightweight is the driving factor this market.
                • compact is the driving factor this market.
                • and energy efficient.In consumer electronics devices is the driving factor this market.
                • thin film materials are used for a variety of applications is the driving factor this market.
                • including:Display screens: Thin film materials is the driving factor this market.
                • such as indium tin oxide (ITO) is the driving factor this market.
                • are used in the production of display screens is the driving factor this market.
                • including liquid crystal displays (LCDs) and organic light-emitting diodes (OLEDs). Thin film materials provide high transparency and conductivity is the driving factor this market.
                • which are essential for the production of high-quality displays.Touch screens: Thin film materials is the driving factor this market.
                • such as ITO is the driving factor this market.
                • are used in the production of touch screens. Thin film materials provide high transparency and conductivity is the driving factor this market.
                • which are essential for the detection of touch inputs.Energy storage: Thin film materials is the driving factor this market.
                • such as lithium-ion batteries is the driving factor this market.
                • are used in consumer electronics devices to store energy. Thin film batteries offer improved energy density and lower costs than traditional batteries.Circuitry: Thin film materials is the driving factor this market.
                • such as copper indium gallium selenide (CIGS) and silicon is the driving factor this market.
                • are used in the production of thin film solar cells is the driving factor this market.
                • which can be integrated into consumer electronics devices to provide a source of renewable energy.The increasing demand for consumer electronics devices is driving the demand for thin film materials is the driving factor this market.
                • creating opportunities for innovation and investment in the thin film material industry. Thus is the driving factor this market.
                • the aforementioned factors will drive the growth of the market during the forecast period. is the driving factor this market.

                The Thin Film Material market vendors should focus on grabbing business opportunities from the Physical vapor deposition segment as it accounted for the largest market share in the base year.