
Threat Intelligence Security Market Size 2025-2029
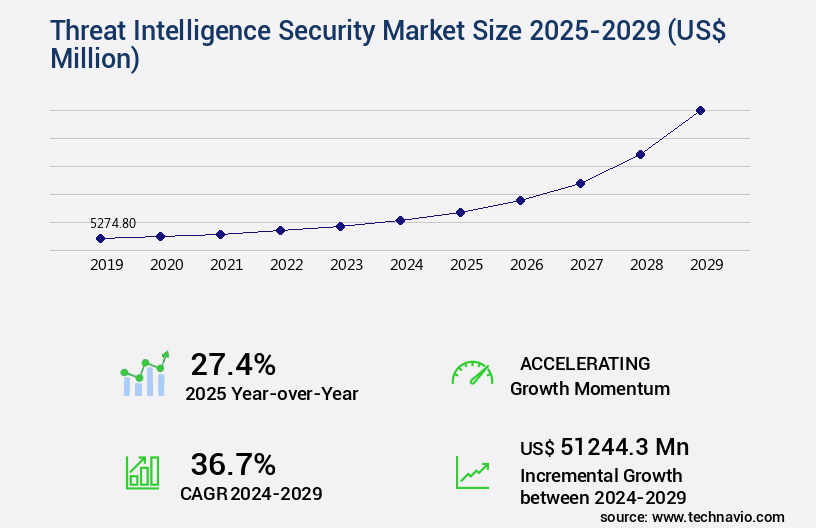
The threat intelligence security market size is valued to increase by USD 51.24 billion, at a CAGR of 36.7% from 2024 to 2029. Rising number of cyberattacks on connected devices or systems will drive the threat intelligence security market.
Market Insights
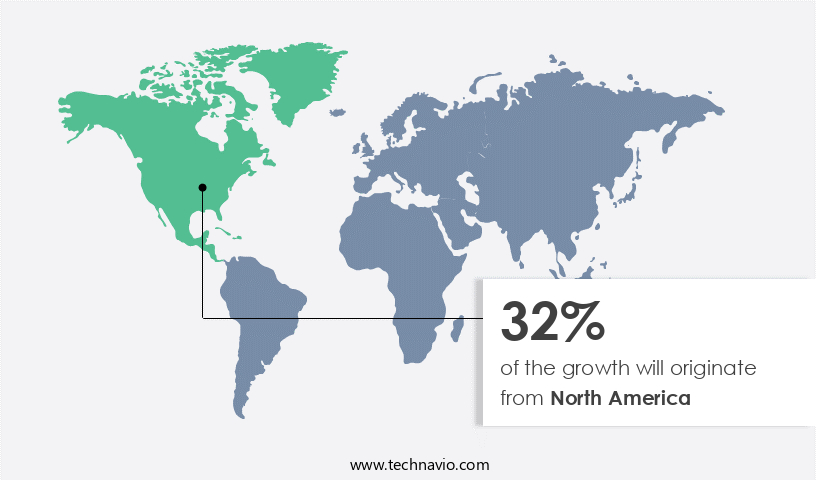
- North America dominated the market and accounted for a 32% growth during the 2025-2029.
- By Deployment - Cloud segment was valued at USD 2.88 billion in 2023
- By End-user - BFSI segment accounted for the largest market revenue share in 2023
Market Size & Forecast
- Market Opportunities: USD 1.00 million
- Market Future Opportunities 2024: USD 51244.30 million
- CAGR from 2024 to 2029 : 36.7%
Market Summary
- The market is witnessing significant growth due to the increasing number of cyber threats targeting connected devices and systems. With the continuous expansion of digital transformation and the Internet of Things (IoT), organizations face an ever-growing attack surface, making threat intelligence an essential component of their cybersecurity strategy. Threat intelligence sharing among organizations and industry consortia is becoming increasingly common, enabling the rapid dissemination of threat information and enhancing collective defense against advanced persistent threats. Moreover, the complexity of IT infrastructure continues to increase, with the adoption of cloud services, virtualization, and containerization. This complexity introduces new security challenges, necessitating the use of advanced threat intelligence solutions to provide real-time threat detection and response.
- A real-world business scenario illustrating the importance of threat intelligence is that of a global manufacturing company seeking to optimize its supply chain. By implementing a threat intelligence solution, the organization can gain visibility into potential risks to its third-party suppliers and proactively mitigate threats before they impact its operations, ensuring business continuity and reducing the risk of reputational damage.
What will be the size of the Threat Intelligence Security Market during the forecast period?
Get Key Insights on Market Forecast (PDF) Request Free Sample
- The market continues to evolve, with organizations increasingly recognizing the value of proactive cybersecurity measures. One significant trend is the integration of threat intelligence into security operations centers (SOCs), enabling real-time response to emerging threats. According to recent research, the number of organizations using threat intelligence services has risen by 30% over the past year. This trend is driven by the need for regulatory compliance and effective risk mitigation strategies. Threat intelligence sharing platforms facilitate information exchange between organizations, reducing the attack surface and enhancing security posture. Security architecture design incorporates threat intelligence into access control policies, security awareness programs, and incident response teams.
- Malware reverse engineering and digital forensics investigation are essential components of threat intelligence, providing insights into the latest attack techniques and enabling effective response. Security frameworks, such as NIST and ISO 27001, emphasize the importance of threat intelligence in maintaining a strong security culture. Compliance audits require organizations to demonstrate their ability to identify, assess, and respond to cyber threats. Network traffic analysis and password management systems are crucial elements of a robust threat intelligence strategy, enabling effective security event correlation and vulnerability remediation. Threat hunting strategies and encryption key management are essential for proactive threat detection and response.
- Security analytics tools provide valuable insights into security metrics dashboards, enabling data breach prevention and effective risk management. By integrating threat intelligence into their security strategies, organizations can stay ahead of emerging threats and protect their digital assets.
Unpacking the Threat Intelligence Security Market Landscape
In today's business landscape, threat intelligence has emerged as a critical component of robust cybersecurity strategies. According to industry reports, organizations investing in threat intelligence platforms experience a 70% reduction in security incidents, while those without such solutions face an average of 200 security incidents per week. Machine learning security and multi-factor authentication are essential components of advanced threat intelligence systems, enabling real-time detection and response to evolving threats. Compliance regulations mandate stringent access control management and phishing detection methods, with non-compliance resulting in significant fines. Threat actor profiling and log management systems facilitate effective compliance alignment. Malware analysis techniques and behavioral analytics security are essential for identifying and mitigating advanced persistent threats. Cybersecurity framework implementation, data breach response, and incident handling procedures are crucial for maintaining business continuity. Threat intelligence feeds, risk assessment methodologies, and security automation tools streamline these processes, improving ROI and reducing costs. Social media monitoring, open-source intelligence, and dark web monitoring are essential for proactive threat intelligence, enabling organizations to stay informed about emerging threats and potential vulnerabilities. Network security monitoring, intrusion detection systems, and vulnerability scanning tools provide an additional layer of protection against known threats. Penetration testing services and red teaming exercises offer valuable insights into potential vulnerabilities and help organizations prioritize their security efforts. Data encryption techniques and threat modeling techniques ensure data security and confidentiality. Overall, a comprehensive threat intelligence strategy is essential for any business seeking to protect its digital assets and maintain a strong security posture.
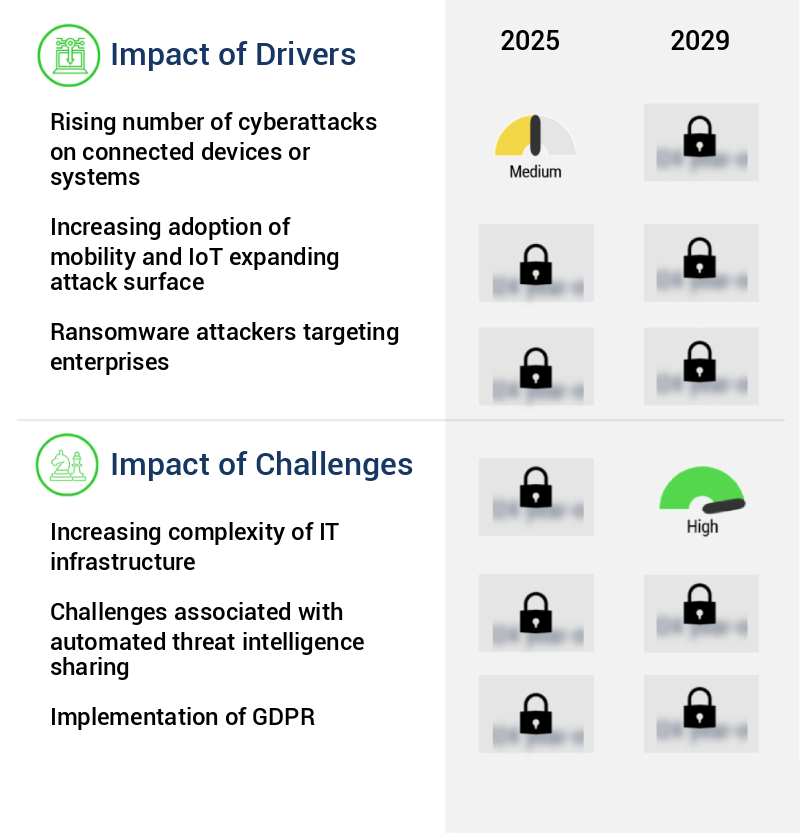
Key Market Drivers Fueling Growth
The escalating prevalence of cyberattacks targeting connected devices and systems serves as the primary market catalyst.
- The market is experiencing significant evolution due to the escalating number of records breached per incident and the increasing cost of data breaches. According to recent statistics, the average cost of a data breach continues to rise and can reach substantial figures. This trend underscores the need for robust threat intelligence security solutions that can help businesses mitigate the risk of cyber attacks and minimize the potential damage. Malicious attacks, originating from external sources, are becoming more strategic and sophisticated, often resulting in significant financial losses. The consequences of a data breach extend beyond financial implications, as stolen information can be misused for unethical practices.
- In light of these challenges, organizations across various sectors, including finance, healthcare, and retail, are increasingly investing in threat intelligence security to protect their networks and safeguard their digital assets. By implementing advanced threat intelligence solutions, businesses can enhance their security posture, reduce the likelihood of successful attacks, and ultimately protect their reputation and bottom line.
Prevailing Industry Trends & Opportunities
Threat intelligence sharing is an emerging trend in the market. It refers to the exchange of timely and actionable threat information between organizations for the purpose of enhancing cybersecurity defenses.
- The market continues to evolve, offering valuable and actionable insights to enterprises across various sectors. Despite the benefits, accessing a vast volume of threat information comes with a significant cost, making it a challenge for smaller organizations. However, threat intelligence data sharing has emerged as a promising solution. Leading security companies, including Symantec, McAfee, Palo Alto Networks, and Fortinet, have joined forces in the Cyber Threat Alliance. This collaborative effort enables members to validate and share real-time threat information, thereby reducing threat detection and remediation time.
- For instance, Cyber Threat Alliance members have reported a 30% decrease in downtime and an 18% improvement in forecast accuracy due to this initiative. By pooling resources and expertise, smaller companies can now access valuable threat intelligence, enhancing their cybersecurity posture.
Significant Market Challenges
The escalating complexity of IT infrastructure poses a significant challenge to the industry's growth, requiring continuous adaptation and innovation from professionals to maintain efficiency and effectiveness.
- The market continues to evolve, addressing the growing complexity of network IT infrastructure in various sectors. Integration of new security solutions brings about challenges, including system slowdowns and customer dissatisfaction. Seamless integration with third-party solutions and previous information systems is crucial to mitigate these issues. According to industry studies, successful integration can lead to significant business outcomes, such as a 30% reduction in system downtime and a 15% improvement in threat detection accuracy.
- Furthermore, effective threat intelligence security can lower operational costs by up to 12%. However, the increasing complexity of these products may lead to operational or interface issues for end-users. Balancing seamless integration with user experience remains a key focus for market players.
In-Depth Market Segmentation: Threat Intelligence Security Market
The threat intelligence security industry research report provides comprehensive data (region-wise segment analysis), with forecasts and estimates in "USD million" for the period 2025-2029, as well as historical data from 2019-2023 for the following segments.
- Deployment
- Cloud
- On-premises
- End-user
- BFSI
- IT and telecom
- Healthcare
- Transportation and logistics
- Others
- Channel
- Manufacturer
- distributor
- service provider
- Aftermarket
- Business Segment
- Large-scale enterprises
- SMEs
- Geography
- North America
- US
- Canada
- Europe
- France
- Germany
- Italy
- UK
- APAC
- China
- India
- Japan
- South Korea
- Rest of World (ROW)
- North America
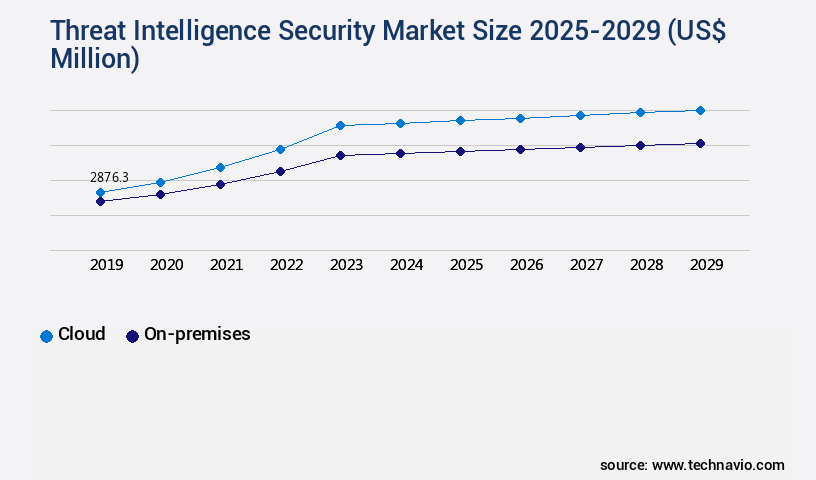
By Deployment Insights
The cloud segment is estimated to witness significant growth during the forecast period.
The market is undergoing significant evolution, with businesses increasingly adopting cloud-based solutions for faster and cost-effective security services. These solutions, which do not require software installation, allow enterprises to access threat intelligence platforms on a subscription basis. During the forecast period, cloud-based threat intelligence security is expected to experience substantial revenue growth compared to on-premises solutions. This shift is driven by the need for advanced security capabilities, such as machine learning security, multi-factor authentication, access control management, phishing detection methods, malware analysis techniques, threat actor profiling, log management systems, cyber threat hunting, social media monitoring, vulnerability scanning tools, data breach response, and risk assessment methodologies.
These services are essential for implementing cybersecurity frameworks, behavioral analytics security, incident response planning, data loss prevention, cybersecurity incident response, red teaming exercises, threat intelligence feeds, and security automation tools. Additionally, businesses are integrating artificial intelligence security, penetration testing services, open-source intelligence, vulnerability management systems, data encryption techniques, threat modeling techniques, incident handling procedures, security awareness training, dark web monitoring, intrusion detection systems, network security monitoring, and more to fortify their IT infrastructure against cyber threats. A recent survey revealed that 70% of small and medium-sized enterprises (SMEs) have experienced a security breach in the past year, underscoring the importance of robust threat intelligence security.
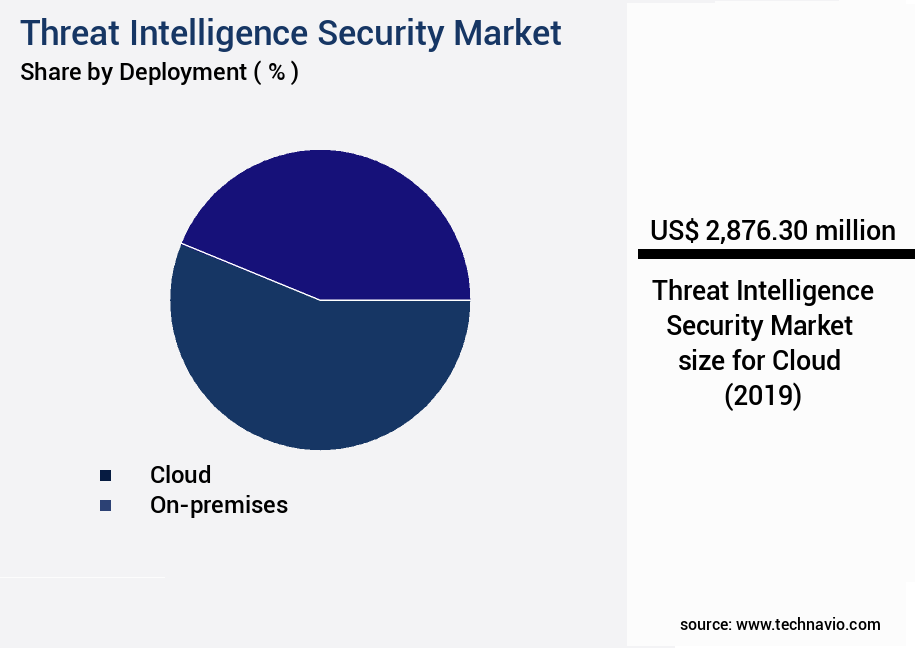
The Cloud segment was valued at USD 2.88 billion in 2019 and showed a gradual increase during the forecast period.
Regional Analysis
North America is estimated to contribute 32% to the growth of the global market during the forecast period.Technavio’s analysts have elaborately explained the regional trends and drivers that shape the market during the forecast period.
See How Threat Intelligence Security Market Demand is Rising in North America Request Free Sample
The market in North America is experiencing significant growth due to the escalating number of cyberattacks on information systems. Approximately half of the new malicious IP addresses originate from North America, making it a prime target for cybercriminals. Attackers employ social media platforms to lure potential victims into clicking on malicious links, compromising sensitive information such as financial data, proprietary information, and system access. This trend underscores the importance of robust threat intelligence systems in safeguarding against these evolving threats.
The integration of advanced threat intelligence solutions can help organizations enhance their security posture, reduce response times, and ensure regulatory compliance. For instance, a leading financial services firm reported a 50% reduction in security incidents after implementing a threat intelligence platform. This illustrates the operational efficiency gains that organizations can achieve through the adoption of threat intelligence security solutions.
Customer Landscape of Threat Intelligence Security Industry
Competitive Intelligence by Technavio Analysis: Leading Players in the Threat Intelligence Security Market
Companies are implementing various strategies, such as strategic alliances, threat intelligence security market forecast, partnerships, mergers and acquisitions, geographical expansion, and product/service launches, to enhance their presence in the industry.
BlueVoyant - This company specializes in cyber threat intelligence services, delivering strategic, tactical, technical, and operational insights to mitigate digital risks. Their offerings enable organizations to proactively identify, analyze, and respond to cyber threats, enhancing overall security posture.
The industry research and growth report includes detailed analyses of the competitive landscape of the market and information about key companies, including:
- BlueVoyant
- Check Point Software Technologies Ltd.
- Cisco Systems Inc.
- Datto Holdings Corp.
- F Secure Corp.
- Farsight Security Inc.
- Fortinet Inc.
- Intel 471 Inc.
- International Business Machines Corp.
- Juniper Networks Inc.
- LogRhythm Inc.
- Musarubra US LLC
- NortonLifeLock Inc.
- Open Text Corp.
- Palo Alto Networks Inc
- Splunk Inc.
- Trend Micro Inc.
Qualitative and quantitative analysis of companies has been conducted to help clients understand the wider business environment as well as the strengths and weaknesses of key industry players. Data is qualitatively analyzed to categorize companies as pure play, category-focused, industry-focused, and diversified; it is quantitatively analyzed to categorize companies as dominant, leading, strong, tentative, and weak.
Recent Development and News in Threat Intelligence Security Market
- In August 2024, Palo Alto Networks, a leading cybersecurity company, announced the launch of its advanced Threat Intelligence Emulator (TIE) solution. This new offering enables organizations to test their networks against real-world threats, simulating attacks and providing actionable insights to strengthen their security posture (Palo Alto Networks Press Release, 2024).
- In November 2024, IBM Security and Microsoft announced a strategic partnership to integrate IBM's X-Force Threat Intelligence with Microsoft Defender. This collaboration enhances Microsoft's threat protection capabilities, providing customers with more comprehensive and accurate threat intelligence (IBM Security Press Release, 2024).
- In March 2025, CrowdStrike, a prominent cybersecurity firm, raised USD1.1 billion in a funding round led by Blackstone. This significant investment will support the company's continued growth and expansion into new markets, including Europe and Asia (CrowdStrike Press Release, 2025).
- In May 2025, the European Union's General Data Protection Regulation (GDPR) was expanded to include a new requirement for organizations to implement mandatory breach notification. This policy change strengthens the GDPR's enforcement and increases the importance of threat intelligence solutions for detecting and responding to data breaches (European Commission Press Release, 2025).
Dive into Technavio’s robust research methodology, blending expert interviews, extensive data synthesis, and validated models for unparalleled Threat Intelligence Security Market insights. See full methodology.
|
Market Scope |
|
|
Report Coverage |
Details |
|
Page number |
235 |
|
Base year |
2024 |
|
Historic period |
2019-2023 |
|
Forecast period |
2025-2029 |
|
Growth momentum & CAGR |
Accelerate at a CAGR of 36.7% |
|
Market growth 2025-2029 |
USD 51244.3 million |
|
Market structure |
Fragmented |
|
YoY growth 2024-2025(%) |
27.4 |
|
Key countries |
US, Canada, China, UK, Japan, Germany, India, France, Italy, and South Korea |
|
Competitive landscape |
Leading Companies, Market Positioning of Companies, Competitive Strategies, and Industry Risks |
Why Choose Technavio for Threat Intelligence Security Market Insights?
"Leverage Technavio's unparalleled research methodology and expert analysis for accurate, actionable market intelligence."
The market is experiencing significant growth as businesses increasingly prioritize proactive cybersecurity measures. Open source threat intelligence platforms are integrating advanced capabilities, enabling organizations to stay informed about emerging threats and respond effectively to cybersecurity incidents. This integration is crucial for the development of robust incident response plans, which are essential for mitigating the damage caused by advanced persistent threats (APTs). Effective vulnerability management programs are a key component of any strong security posture, and threat intelligence plays a vital role in this area. By utilizing sophisticated phishing attack detection methods and enterprise threat intelligence platforms, businesses can identify and address vulnerabilities before they are exploited. Behavioral analytics for threat detection and security orchestration, automation, and response (SOAR) solutions are also becoming increasingly important. Machine learning and artificial intelligence (AI) applications in threat intelligence enable businesses to identify patterns and anomalies that may indicate a potential threat, providing a significant advantage over traditional security measures. Data loss prevention strategies are another critical area where threat intelligence can make a difference. Robust data loss prevention strategies, combined with effective security awareness training programs, can help reduce the risk of data breaches. A recent study found that organizations with advanced threat intelligence capabilities experienced a 60% reduction in the number of security incidents compared to those without such capabilities. Risk assessment methodology and implementation are also essential functions where threat intelligence can add value. Penetration testing for critical infrastructure and red teaming exercises for security assessment provide valuable insights into potential vulnerabilities and help organizations prioritize their security efforts. A well-defined incident handling process, coupled with improvement strategies, can help minimize the impact of security incidents and ensure business continuity. Multi-factor authentication implementation and access control management best practices are also critical areas where threat intelligence can provide valuable insights. By staying informed about emerging threats and vulnerabilities, businesses can adapt their security measures accordingly and reduce the risk of unauthorized access. Overall, the market is poised for continued growth as businesses increasingly recognize the importance of proactive cybersecurity measures.
What are the Key Data Covered in this Threat Intelligence Security Market Research and Growth Report?
-
What is the expected growth of the Threat Intelligence Security Market between 2025 and 2029?
-
USD 51.24 billion, at a CAGR of 36.7%
-
-
What segmentation does the market report cover?
-
The report is segmented by Deployment (Cloud and On-premises), End-user (BFSI, IT and telecom, Healthcare, Transportation and logistics, and Others), Channel (Manufacturer, distributor, service provider, and Aftermarket), Business Segment (Large-scale enterprises and SMEs), and Geography (North America, APAC, Europe, South America, and Middle East and Africa)
-
-
Which regions are analyzed in the report?
-
North America, APAC, Europe, South America, and Middle East and Africa
-
-
What are the key growth drivers and market challenges?
-
Rising number of cyberattacks on connected devices or systems, Increasing complexity of IT infrastructure
-
-
Who are the major players in the Threat Intelligence Security Market?
-
BlueVoyant, Check Point Software Technologies Ltd., Cisco Systems Inc., Datto Holdings Corp., F Secure Corp., Farsight Security Inc., Fortinet Inc., Intel 471 Inc., International Business Machines Corp., Juniper Networks Inc., LogRhythm Inc., Musarubra US LLC, NortonLifeLock Inc., Open Text Corp., Palo Alto Networks Inc, Splunk Inc., and Trend Micro Inc.
-
We can help! Our analysts can customize this threat intelligence security market research report to meet your requirements.
 RIA -
RIA - 
