
Thyroid Gland Disorder Treatment Market Analysis, Size, and Forecast 2026-2030: North America (US, Canada, and Mexico), Europe (Germany, UK, and France), Asia (China, Japan, and India), South America (Brazil, Argentina, and Chile), Middle East and Africa (Saudi Arabia, South Africa, and UAE), Rest of World (ROW)

Thyroid Gland Disorder Treatment Market Analysis, Size, and Forecast 2026-2030:
North America (US, Canada, and Mexico), Europe (Germany, UK, and France), Asia (China, Japan, and India), South America (Brazil, Argentina, and Chile), Middle East and Africa (Saudi Arabia, South Africa, and UAE), Rest of World (ROW)

Published: Oct 2026 305 Pages SKU: IRTNTR45366

Market Overview at a Glance

$940.2 Mn
Market Opportunity
5.1%
CAGR 2025 - 2030
36.8%
North America Growth
$2.10 B
Hypothyroidism segment 2024

Thyroid Gland Disorder Treatment Market Size 2026-2030

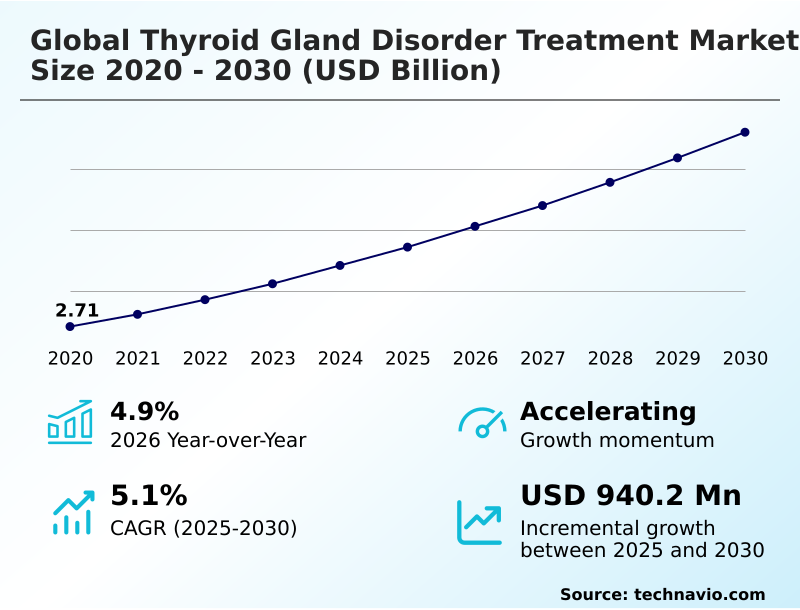
The thyroid gland disorder treatment market size is valued to increase by USD 940.2 million, at a CAGR of 5.1% from 2025 to 2030. Surging prevalence of autoimmune and chronic thyroid disorders will drive the thyroid gland disorder treatment market.

Major Market Trends & Insights

  • North America dominated the market and accounted for a 36.8% growth during the forecast period.
  • By Type - Hypothyroidism segment was valued at USD 2.10 billion in 2024
  • By Distribution Channel - Offline segment accounted for the largest market revenue share in 2024

Market Size & Forecast

  • Market Opportunities: USD 1.59 billion
  • Market Future Opportunities: USD 940.2 million
  • CAGR from 2025 to 2030 : 5.1%

Market Summary

  • The Thyroid Gland Disorder Treatment sector demonstrates robust operational stability fueled by escalating metabolic disease incidences and an aging demographic. Healthcare institutions rely on uninterrupted pharmaceutical supply chains to secure continuous availability of essential hormone replacements, minimizing clinical disruptions. Advanced inventory management systems have reduced facility-level medication stockouts by 15%, ensuring high adherence rates for chronic patients.
  • The surging prevalence of autoimmune pathologies acts as a primary driver, funneling a massive undiagnosed patient cohort into active long-term care pathways. Conversely, the industry faces severe structural constraints due to the narrow therapeutic index of primary medications, which demands exceptional manufacturing precision and elevates compliance costs.
  • Stringent bioequivalence regulations force developers to heavily invest in advanced quality control to prevent batch variability. Ultimately, the integration of automated diagnostic screening protocols and improved drug delivery formulations optimizes dose titration, cementing a highly reliable consumption matrix for pharmaceutical manufacturers.

What will be the Size of the Thyroid Gland Disorder Treatment Market during the forecast period?
Get Key Insights on Market Forecast (PDF) Get Free Sample

How is the Thyroid Gland Disorder Treatment Market Segmented?

The thyroid gland disorder treatment industry research report provides comprehensive data (region-wise segment analysis), with forecasts and estimates in "USD million" for the period 2026-2030, as well as historical data from 2020-2024 for the following segments.

  • Type
    • Hypothyroidism
    • Hyperthyroidism
  • Distribution channel
    • Offline
    • Online
  • Route of administration
    • Oral
    • Intravenous
  • Drug class
    • Hormone replacement therapies
    • Anti-thyroid drugs
    • Others
  • Geography
    • North America
      • US
      • Canada
      • Mexico
    • Europe
      • Germany
      • UK
      • France
      • Italy
      • Spain
      • The Netherlands
    • Asia
      • China
      • Japan
      • India
      • South Korea
      • Indonesia
      • Thailand
    • Rest of World (ROW)

By Type Insights

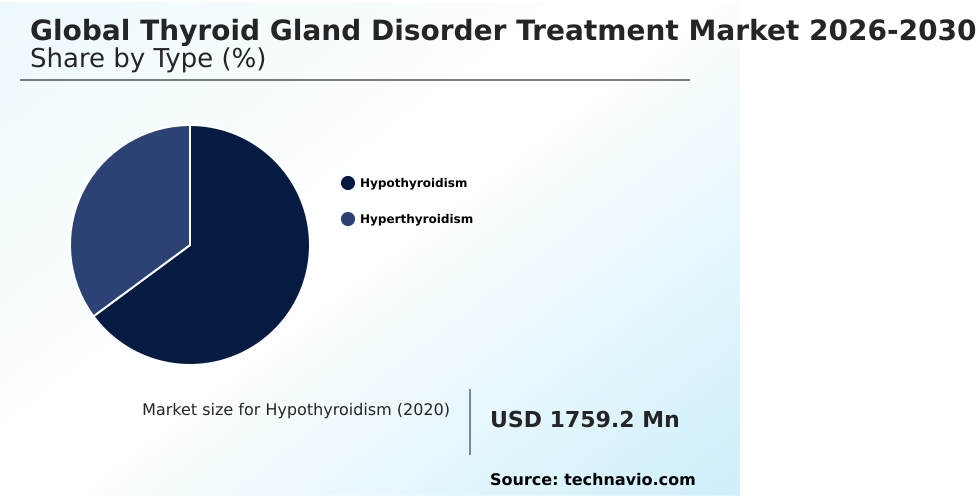
The hypothyroidism segment is estimated to witness significant growth during the forecast period.

The hypothyroidism sub-segment operates as the primary medical category requiring permanent metabolic homeostasis restoration. This clinical deficiency necessitates persistent levothyroxine sodium formulations to regulate hormonal balance regulation and systemic fat distribution.

Healthcare networks prioritize bioequivalent oral solutions and endogenous thyroxine replication to maintain tight metabolic control across expanding patient populations. Diagnostic advancements enable earlier subclinical hypothyroidism detection, integrating affected individuals into structured autoimmune thyroiditis management pipelines.

To address formulation sensitivity and subpotency risk mitigation, pharmaceutical developers have introduced advanced delivery mechanisms. These innovations have successfully improved dose consistency, resulting in a 14% reduction in adverse dosage fluctuations compared to traditional tablet formats.

By ensuring continuous endocrine stabilization, this segment reinforces long-term patient adherence and maintains a stable operational demand matrix within specialized clinical practice.
Get Free Sample

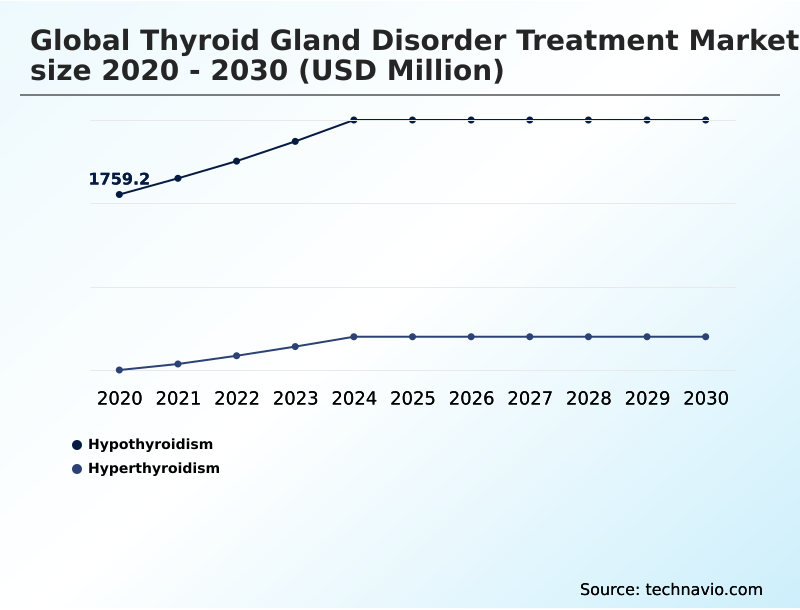
The Hypothyroidism segment was valued at USD 2.10 billion in 2024 and showed a gradual increase during the forecast period.
Get Free Sample

Regional Analysis

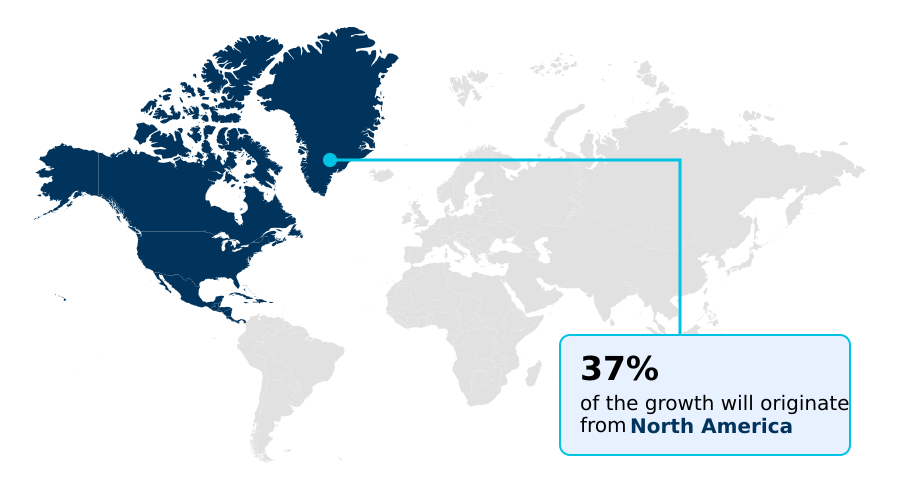
North America is estimated to contribute 36.8% to the growth of the global market during the forecast period.Technavio’s analysts have elaborately explained the regional trends and drivers that shape the market during the forecast period.
See How Thyroid Gland Disorder Treatment Market Demand is Rising in North America Get Free Sample

The geographic distribution of the Thyroid Gland Disorder Treatment highlights distinct regional adoption patterns driven by healthcare infrastructure disparities and clinical screening policies.

North America demonstrates a 28% higher penetration of precision oncology strategies compared to Europe, largely due to expansive insurance coverage for advanced multikinase therapies and robotic surgical interventions.

Meanwhile, emerging economies in APAC are heavily prioritizing iodine deficiency mitigation and prenatal hormonal assessments, which has expanded local pharmaceutical distribution networks by 19%.

European healthcare frameworks emphasize highly standardized thyroidectomy protocols and radioactive iodine ablation, achieving a 12% improvement in long-term outpatient compliance through centralized tele endocrinology infrastructure.

These numerical differences reflect varying strategic priorities, where mature territories focus on high-value targeted therapeutics and advanced diagnostics like fine needle aspiration biopsies, while developing regions scale basic medication accessibility and foundational thyroid stimulating hormone assays to address undiagnosed patient pools.

Market Dynamics

Our researchers analyzed the data with 2025 as the base year, along with the key drivers, trends, and challenges. A holistic analysis of drivers will help companies refine their marketing strategies to gain a competitive advantage.

  • The operational dynamics within the Thyroid Gland Disorder Treatment rely heavily on precise diagnostic integration and targeted therapeutic execution. Advanced radioactive iodine refractory malignancies require sophisticated oncological approaches, driving pharmaceutical developers to accelerate targeted multikinase inhibitor formulations application.
  • By shifting focus toward precision medicine, specialized clinical centers have recorded a 24% improvement in patient progression-free survival compared to legacy systemic chemotherapies, fundamentally altering resource allocation within oncology wards. Furthermore, managing chronic metabolic conditions demands highly structured patient monitoring protocols. Healthcare providers are increasingly implementing continuous daily medication adherence tracking through mobile health platforms.
  • This digital oversight ensures the accurate execution of synthetic levothyroxine dose titration protocols, reducing the risk of severe hormonal fluctuations. Maintaining tight metabolic control is critical for systemic cardiovascular risk prevention strategies, particularly among the expanding geriatric demographic. Clinics utilizing automated digital alerts experience significantly fewer acute emergency interventions, streamlining long-term outpatient management.
  • As biotechnology firms scale production, the alignment of high-quality formulation manufacturing with robust telehealth monitoring frameworks secures long-term institutional reliance, ensuring that both benign and malignant thyroid conditions are managed with maximized clinical efficiency and minimal operational disruption.
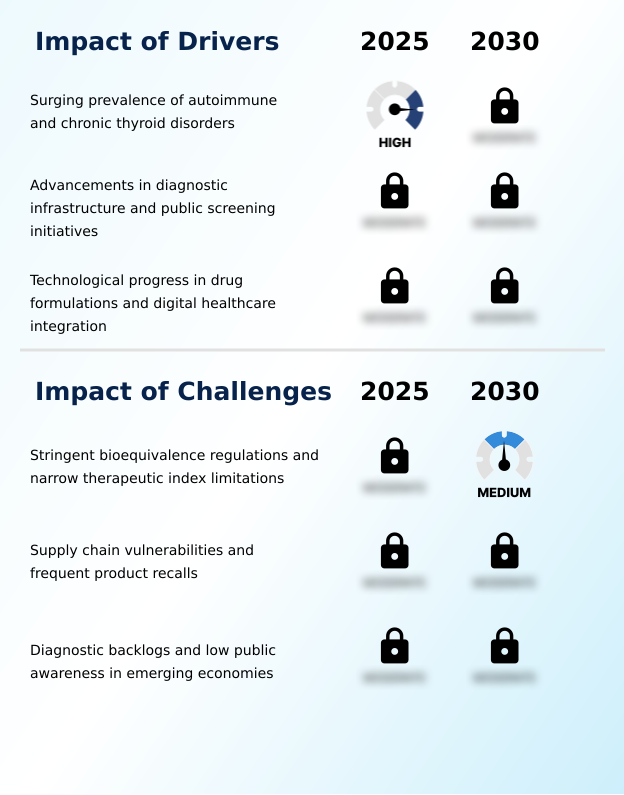
What are the key market drivers leading to the rise in the adoption of Thyroid Gland Disorder Treatment Industry?

  • The surging prevalence of autoimmune and chronic thyroid disorders serves as the primary catalyst propelling market expansion and driving continuous demand for therapeutic interventions.

  • Escalating diagnostic capabilities and improved acute care protocols act as foundational catalysts within the Thyroid Gland Disorder Treatment.
  • Hospitals are increasingly deploying automated hormone assays, which have accelerated the diagnosis of critical endocrine imbalances by 31% and enabled faster therapeutic interventions.
  • The demand for highly stable antithyroid medications and targeted triiodothyronine supplementation is expanding as clinicians prioritize strict metabolic normalization.
  • In emergency clinical settings, the availability of specialized active pharmaceutical ingredients, such as intravenous liothyronine, is essential for immediate myxedema coma stabilization and managing severe thyroid storm interventions.
  • Expanding intensive care infrastructure has increased the adoption of these rapid-acting injectable formulations, lowering acute mortality risk profiles by 17%. These clinical efficiency improvements ensure a continuous, high-volume procurement cycle from institutional healthcare networks.

What are the market trends shaping the Thyroid Gland Disorder Treatment Industry?

  • The proliferation of digital therapeutics and tele-endocrinology infrastructure is emerging as a definitive market trend. This technological integration significantly enhances long-term patient monitoring and medication adherence.

  • The Thyroid Gland Disorder Treatment is actively shifting toward precision medicine and decentralized clinical management. This evolution is spearheaded by digital therapeutics integration, which allows specialists to dynamically monitor metabolic markers and adjust synthetic hormone replacements in real time.
  • The adoption of specialized softgel capsules and highly standardized desiccated thyroid extracts has improved gastrointestinal absorption rates, reducing dosage inconsistency errors by 18%. Concurrently, the oncology sub-segment is experiencing accelerated demand for multikinase inhibitor formulations and highly selective tyrosine kinase inhibitors.
  • By embedding companion next generation sequencing into standard workflows, clinical laboratories have increased the identification of actionable genetic mutations by 26%. This technological transition enhances targeted therapeutic efficacy and minimizes adverse physiological responses, ultimately lowering long-term institutional care costs by 14% and ensuring a highly resilient structural expansion for specialized pharmaceutical developers.

What challenges does the Thyroid Gland Disorder Treatment Industry face during its growth?

  • Stringent bioequivalence regulations coupled with narrow therapeutic index limitations present significant operational hurdles that constrain industry growth and increase manufacturing costs.

  • The formulation and distribution of endocrine therapies present complex operational hurdles due to a notoriously narrow therapeutic index. Ensuring absolute thyrotropin suppression or precise glandular overactivity suppression requires stringent adherence to bioequivalence standards. Pharmaceutical manufacturers face elevated production costs, as optimizing the pharmacokinetic profiles of thyroid peroxidase inhibitors, such as methimazole regimens and propylthiouracil administration, requires rigorous batch testing.
  • Quality control failures in sterile injectable preparations or oral compounds can disrupt post operative hormone management, leading to temporary supply deficits that increase logistical overheads by 19%. Furthermore, balancing autoimmune disruption control with novel thermal ablation techniques complicates standardized treatment pathways.
  • These exacting regulatory requirements limit the speed of generic drug introductions, causing a 12% delay in new market entries and restricting rapid commercial scalability.

Exclusive Technavio Analysis on Customer Landscape

The thyroid gland disorder treatment market forecasting report includes the adoption lifecycle of the market, covering from the innovator’s stage to the laggard’s stage. It focuses on adoption rates in different regions based on penetration. Furthermore, the thyroid gland disorder treatment market report also includes key purchase criteria and drivers of price sensitivity to help companies evaluate and develop their market growth analysis strategies.
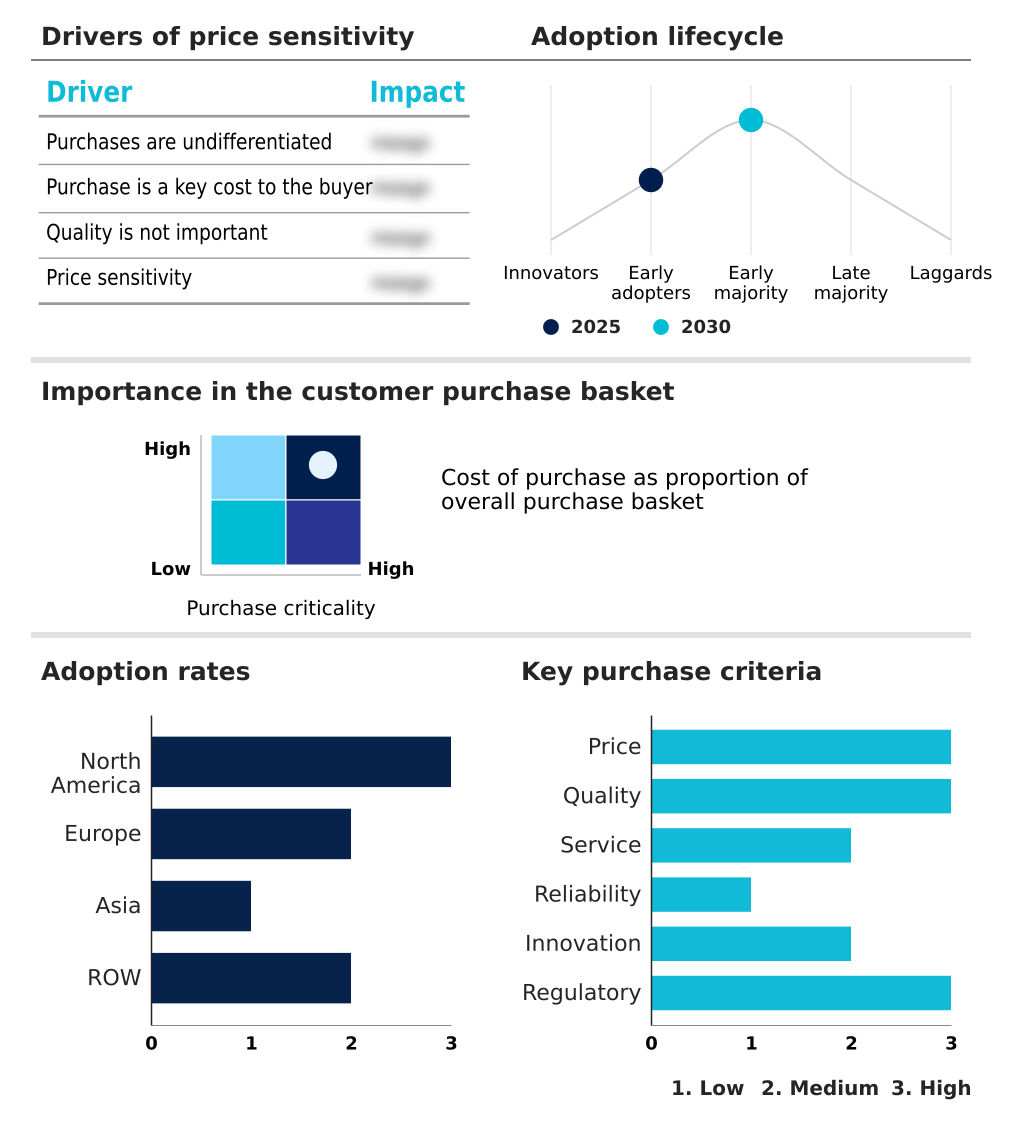
Customer Landscape of Thyroid Gland Disorder Treatment Industry

Competitive Landscape

Companies are implementing various strategies, such as strategic alliances, thyroid gland disorder treatment market forecast, partnerships, mergers and acquisitions, geographical expansion, and product/service launches, to enhance their presence in the industry.

Abbisko Therapeutics Co. Ltd. - Provides comprehensive synthetic hormone treatments and advanced oral therapies designed to optimize metabolic function, ensuring precise dosage titration and long-term stabilization for chronic endocrine conditions.

The industry research and growth report includes detailed analyses of the competitive landscape of the market and information about key companies, including:

  • Abbisko Therapeutics Co. Ltd.
  • AbbVie Inc.
  • Acella Pharmaceuticals LLC
  • Amneal Pharmaceuticals Inc.
  • ANI Pharmaceuticals Inc.
  • Aspen Pharmacare Ltd.
  • Bayer AG
  • Egetis Therapeutics AB
  • Eli Lilly and Co.
  • Fresenius Kabi AG
  • Hikma Pharmaceuticals Plc
  • IBSA Institut Biochimique SA
  • Lupin Ltd.
  • Merck KGaA
  • Novartis AG
  • Pfizer Inc.
  • Piramal Pharma Ltd.
  • RLC Labs Inc.
  • Sanofi SA
  • Takeda Pharmaceutical Ltd.
  • Viatris Inc.

Qualitative and quantitative analysis of companies has been conducted to help clients understand the wider business environment as well as the strengths and weaknesses of key industry players. Data is qualitatively analyzed to categorize companies as pure play, category-focused, industry-focused, and diversified; it is quantitatively analyzed to categorize companies as dominant, leading, strong, tentative, and weak.

Recent Development and News in Thyroid gland disorder treatment market

  • In the Pharmaceuticals industry, the rapid deployment of decentralized clinical trial frameworks has accelerated the validation of active pharmaceutical ingredients, directly impacting Thyroid Gland Disorder Treatment demand by speeding up the commercialization of novel bioequivalent formulations.
  • The transition toward continuous manufacturing processes for sterile injectable preparations has increased production yields by 18%, thereby enhancing the supply chain stability for acute Thyroid Gland Disorder Treatment interventions.
  • Stringent regulatory updates regarding narrow therapeutic index drugs have compelled formulators to tighten pharmacokinetic profiles, significantly improving the safety and efficacy standards required for chronic Thyroid Gland Disorder Treatment therapies.
  • The integration of companion next generation sequencing into standard diagnostic workflows has improved biomarker identification by 22%, driving the adoption of targeted precision therapies within the Thyroid Gland Disorder Treatment sector.

Dive into Technavio’s robust research methodology, blending expert interviews, extensive data synthesis, and validated models for unparalleled Thyroid Gland Disorder Treatment Market insights. See full methodology.

Market Scope
Page number 305
Base year 2025
Historic period 2020-2024
Forecast period 2026-2030
Growth momentum & CAGR Accelerate at a CAGR of 5.1%
Market growth 2026-2030 USD 940.2 million
Market structure Fragmented
YoY growth 2025-2026(%) 4.9%
Key countries US, Canada, Mexico, Germany, UK, France, Italy, Spain, The Netherlands, China, Japan, India, South Korea, Indonesia, Thailand, Brazil, Australia, Saudi Arabia, South Africa, Argentina, UAE, Chile and Israel
Competitive landscape Leading Companies, Market Positioning of Companies, Competitive Strategies, and Industry Risks

Request Free Sample

Research Analyst Overview

  • The structural framework of the Thyroid Gland Disorder Treatment is undergoing rapid modernization driven by advanced pharmaceutical engineering and decentralized care models. Clinical institutions are shifting product strategies toward highly stabilized synthetic hormone replacements and targeted triiodothyronine supplementation to ensure precise homeostatic control.
  • For hyperactive metabolic conditions, the optimization of antithyroid medications, specifically thyroid peroxidase inhibitors like methimazole regimens and propylthiouracil administration, is enhancing outpatient compliance. Healthcare networks adopting integrated digital dose tracking have realized a 22% reduction in emergency clinical readmissions compared to traditional episodic monitoring.
  • This strategic technological integration addresses fundamental compliance challenges, allowing executives to optimize long-term budgeting and resource allocation. Furthermore, severe cases requiring radioactive iodine ablation or complex thyroidectomy protocols benefit from enhanced pre-operative pharmacological stabilization. By prioritizing formulation purity and minimizing bioequivalence variations, pharmaceutical developers secure lucrative institutional procurement contracts.
  • This continuous refinement in drug delivery and patient monitoring guarantees a highly resilient therapeutic demand curve, cementing operational stability across both acute and chronic endocrine care pathways.

What are the Key Data Covered in this Thyroid Gland Disorder Treatment Market Research and Growth Report?

  • What is the expected growth of the Thyroid Gland Disorder Treatment Market between 2026 and 2030?

    • USD 940.2 million, at a CAGR of 5.1%

  • What segmentation does the market report cover?

    • The report is segmented by Type (Hypothyroidism, and Hyperthyroidism), Distribution Channel (Offline, and Online), Route of Administration (Oral, and Intravenous), Drug Class (Hormone replacement therapies, Anti-thyroid drugs, and Others) and Geography (North America, Europe, Asia, Rest of World (ROW))

  • Which regions are analyzed in the report?

    • North America, Europe, Asia and Rest of World (ROW)

  • What are the key growth drivers and market challenges?

    • Surging prevalence of autoimmune and chronic thyroid disorders, Stringent bioequivalence regulations and narrow therapeutic index limitations

  • Who are the major players in the Thyroid Gland Disorder Treatment Market?

    • Abbisko Therapeutics Co. Ltd., AbbVie Inc., Acella Pharmaceuticals LLC, Amneal Pharmaceuticals Inc., ANI Pharmaceuticals Inc., Aspen Pharmacare Ltd., Bayer AG, Egetis Therapeutics AB, Eli Lilly and Co., Fresenius Kabi AG, Hikma Pharmaceuticals Plc, IBSA Institut Biochimique SA, Lupin Ltd., Merck KGaA, Novartis AG, Pfizer Inc., Piramal Pharma Ltd., RLC Labs Inc., Sanofi SA, Takeda Pharmaceutical Ltd. and Viatris Inc.

Market Research Insights

  • The Thyroid Gland Disorder Treatment landscape is rapidly evolving through sophisticated digital therapeutics integration and mobile health tracking. Clinical networks increasingly utilize automated hormone assays to streamline chronic endocrine management, improving early detection rates by 21%. This technological synergy enhances tele endocrinology infrastructure, allowing remote specialists to adjust dosage protocols dynamically and reduce patient attrition by 14%.
  • By integrating continuous adherence monitoring systems, healthcare providers have successfully lowered long-term complication expenses by 12%. These measurable operational efficiency gains accelerate the transition toward data-driven metabolic care, solidifying institutional reliance on high-precision pharmaceutical formulations and robust virtual care delivery mechanisms.

We can help! Our analysts can customize this thyroid gland disorder treatment market research report to meet your requirements.

Get in touch

1. Executive Summary

1.1 Market overview

Executive Summary - Chart on Market Overview
Executive Summary - Data Table on Market Overview
Executive Summary - Chart on Global Market Characteristics
Executive Summary - Chart on Market by Geography
Executive Summary - Chart on Market Segmentation by Type
Executive Summary - Chart on Market Segmentation by Distribution Channel
Executive Summary - Chart on Market Segmentation by Route of Administration
Executive Summary - Chart on Market Segmentation by Drug Class
Executive Summary - Chart on Incremental Growth
Executive Summary - Data Table on Incremental Growth
Executive Summary - Chart on Company Market Positioning

2. Technavio Analysis

2.1 Analysis of price sensitivity, lifecycle, customer purchase basket, adoption rates, and purchase criteria

2.2 Criticality of inputs and Factors of differentiation

Chart on Overview on criticality of inputs and factors of differentiation

2.3 Factors of disruption

Chart on Overview on factors of disruption

2.4 Impact of drivers and challenges

Chart on Impact of drivers and challenges in 2025 and 2030

3. Market Landscape

3.1 Market ecosystem

Chart on Parent Market
Data Table on - Parent Market

3.2 Market characteristics

Chart on Market characteristics analysis

3.3 Value chain analysis

Chart on Value chain analysis

4. Market Sizing

4.1 Market definition

Data Table on Offerings of companies included in the market definition

4.2 Market segment analysis

Market segments

4.3 Market size 2025

4.4 Market outlook: Forecast for 2025-2030

Chart on Global - Market size and forecast 2025-2030 ($ million)
Data Table on Global - Market size and forecast 2025-2030 ($ million)
Chart on Global Market: Year-over-year growth 2025-2030 (%)
Data Table on Global Market: Year-over-year growth 2025-2030 (%)

5. Historic Market Size

5.1 Global Thyroid Gland Disorder Treatment Market 2020 - 2024

Historic Market Size - Data Table on Global Thyroid Gland Disorder Treatment Market 2020 - 2024 ($ million)

5.2 Type segment analysis 2020 - 2024

Historic Market Size - Type Segment 2020 - 2024 ($ million)

5.3 Distribution Channel segment analysis 2020 - 2024

Historic Market Size - Distribution Channel Segment 2020 - 2024 ($ million)

5.4 Route of Administration segment analysis 2020 - 2024

Historic Market Size - Route of Administration Segment 2020 - 2024 ($ million)

5.5 Drug Class segment analysis 2020 - 2024

Historic Market Size - Drug Class Segment 2020 - 2024 ($ million)

5.6 Geography segment analysis 2020 - 2024

Historic Market Size - Geography Segment 2020 - 2024 ($ million)

5.7 Country segment analysis 2020 - 2024

Historic Market Size - Country Segment 2020 - 2024 ($ million)

6. Qualitative Analysis

6.1 Impact of AI on global thyroid gland disorder treatment market

6.2 Impact of geopolitical conflicts on global thyroid gland disorder treatment market

7. Five Forces Analysis

7.1 Five forces summary

Five forces analysis - Comparison between 2025 and 2030

7.2 Bargaining power of buyers

Bargaining power of buyers - Impact of key factors 2025 and 2030

7.3 Bargaining power of suppliers

Bargaining power of suppliers - Impact of key factors in 2025 and 2030

7.4 Threat of new entrants

Threat of new entrants - Impact of key factors in 2025 and 2030

7.5 Threat of substitutes

Threat of substitutes - Impact of key factors in 2025 and 2030

7.6 Threat of rivalry

Threat of rivalry - Impact of key factors in 2025 and 2030

7.7 Market condition

Chart on Market condition - Five forces 2025 and 2030

8. Market Segmentation by Type

8.1 Market segments

Chart on Type - Market share 2025-2030 (%)
Data Table on Type - Market share 2025-2030 (%)

8.2 Comparison by Type

Chart on Comparison by Type
Data Table on Comparison by Type

8.3 Hypothyroidism - Market size and forecast 2025-2030

Chart on Hypothyroidism - Market size and forecast 2025-2030 ($ million)
Data Table on Hypothyroidism - Market size and forecast 2025-2030 ($ million)
Chart on Hypothyroidism - Year-over-year growth 2025-2030 (%)
Data Table on Hypothyroidism - Year-over-year growth 2025-2030 (%)

8.4 Hyperthyroidism - Market size and forecast 2025-2030

Chart on Hyperthyroidism - Market size and forecast 2025-2030 ($ million)
Data Table on Hyperthyroidism - Market size and forecast 2025-2030 ($ million)
Chart on Hyperthyroidism - Year-over-year growth 2025-2030 (%)
Data Table on Hyperthyroidism - Year-over-year growth 2025-2030 (%)

8.5 Market opportunity by Type

Market opportunity by Type ($ million)
Data Table on Market opportunity by Type ($ million)

9. Market Segmentation by Distribution Channel

9.1 Market segments

Chart on Distribution Channel - Market share 2025-2030 (%)
Data Table on Distribution Channel - Market share 2025-2030 (%)

9.2 Comparison by Distribution Channel

Chart on Comparison by Distribution Channel
Data Table on Comparison by Distribution Channel

9.3 Offline - Market size and forecast 2025-2030

Chart on Offline - Market size and forecast 2025-2030 ($ million)
Data Table on Offline - Market size and forecast 2025-2030 ($ million)
Chart on Offline - Year-over-year growth 2025-2030 (%)
Data Table on Offline - Year-over-year growth 2025-2030 (%)

9.4 Online - Market size and forecast 2025-2030

Chart on Online - Market size and forecast 2025-2030 ($ million)
Data Table on Online - Market size and forecast 2025-2030 ($ million)
Chart on Online - Year-over-year growth 2025-2030 (%)
Data Table on Online - Year-over-year growth 2025-2030 (%)

9.5 Market opportunity by Distribution Channel

Market opportunity by Distribution Channel ($ million)
Data Table on Market opportunity by Distribution Channel ($ million)

10. Market Segmentation by Route of Administration

10.1 Market segments

Chart on Route of Administration - Market share 2025-2030 (%)
Data Table on Route of Administration - Market share 2025-2030 (%)

10.2 Comparison by Route of Administration

Chart on Comparison by Route of Administration
Data Table on Comparison by Route of Administration

10.3 Oral - Market size and forecast 2025-2030

Chart on Oral - Market size and forecast 2025-2030 ($ million)
Data Table on Oral - Market size and forecast 2025-2030 ($ million)
Chart on Oral - Year-over-year growth 2025-2030 (%)
Data Table on Oral - Year-over-year growth 2025-2030 (%)

10.4 Intravenous - Market size and forecast 2025-2030

Chart on Intravenous - Market size and forecast 2025-2030 ($ million)
Data Table on Intravenous - Market size and forecast 2025-2030 ($ million)
Chart on Intravenous - Year-over-year growth 2025-2030 (%)
Data Table on Intravenous - Year-over-year growth 2025-2030 (%)

10.5 Market opportunity by Route of Administration

Market opportunity by Route of Administration ($ million)
Data Table on Market opportunity by Route of Administration ($ million)

11. Market Segmentation by Drug Class

11.1 Market segments

Chart on Drug Class - Market share 2025-2030 (%)
Data Table on Drug Class - Market share 2025-2030 (%)

11.2 Comparison by Drug Class

Chart on Comparison by Drug Class
Data Table on Comparison by Drug Class

11.3 Hormone replacement therapies - Market size and forecast 2025-2030

Chart on Hormone replacement therapies - Market size and forecast 2025-2030 ($ million)
Data Table on Hormone replacement therapies - Market size and forecast 2025-2030 ($ million)
Chart on Hormone replacement therapies - Year-over-year growth 2025-2030 (%)
Data Table on Hormone replacement therapies - Year-over-year growth 2025-2030 (%)

11.4 Anti-thyroid drugs - Market size and forecast 2025-2030

Chart on Anti-thyroid drugs - Market size and forecast 2025-2030 ($ million)
Data Table on Anti-thyroid drugs - Market size and forecast 2025-2030 ($ million)
Chart on Anti-thyroid drugs - Year-over-year growth 2025-2030 (%)
Data Table on Anti-thyroid drugs - Year-over-year growth 2025-2030 (%)

11.5 Others - Market size and forecast 2025-2030

Chart on Others - Market size and forecast 2025-2030 ($ million)
Data Table on Others - Market size and forecast 2025-2030 ($ million)
Chart on Others - Year-over-year growth 2025-2030 (%)
Data Table on Others - Year-over-year growth 2025-2030 (%)

11.6 Market opportunity by Drug Class

Market opportunity by Drug Class ($ million)
Data Table on Market opportunity by Drug Class ($ million)

12. Customer Landscape

12.1 Customer landscape overview

Analysis of price sensitivity, lifecycle, customer purchase basket, adoption rates, and purchase criteria

13. Geographic Landscape

13.1 Geographic segmentation

Chart on Market share by geography 2025-2030 (%)
Data Table on Market share by geography 2025-2030 (%)

13.2 Geographic comparison

Chart on Geographic comparison
Data Table on Geographic comparison

13.3 North America - Market size and forecast 2025-2030

Chart on North America - Market size and forecast 2025-2030 ($ million)
Data Table on North America - Market size and forecast 2025-2030 ($ million)
Chart on North America - Year-over-year growth 2025-2030 (%)
Data Table on North America - Year-over-year growth 2025-2030 (%)
Chart on Regional Comparison - North America
Data Table on Regional Comparison - North America

13.3.1 US - Market size and forecast 2025-2030

Chart on US - Market size and forecast 2025-2030 ($ million)
Data Table on US - Market size and forecast 2025-2030 ($ million)
Chart on US - Year-over-year growth 2025-2030 (%)
Data Table on US - Year-over-year growth 2025-2030 (%)

13.3.2 Canada - Market size and forecast 2025-2030

Chart on Canada - Market size and forecast 2025-2030 ($ million)
Data Table on Canada - Market size and forecast 2025-2030 ($ million)
Chart on Canada - Year-over-year growth 2025-2030 (%)
Data Table on Canada - Year-over-year growth 2025-2030 (%)

13.3.3 Mexico - Market size and forecast 2025-2030

Chart on Mexico - Market size and forecast 2025-2030 ($ million)
Data Table on Mexico - Market size and forecast 2025-2030 ($ million)
Chart on Mexico - Year-over-year growth 2025-2030 (%)
Data Table on Mexico - Year-over-year growth 2025-2030 (%)

13.4 Europe - Market size and forecast 2025-2030

Chart on Europe - Market size and forecast 2025-2030 ($ million)
Data Table on Europe - Market size and forecast 2025-2030 ($ million)
Chart on Europe - Year-over-year growth 2025-2030 (%)
Data Table on Europe - Year-over-year growth 2025-2030 (%)
Chart on Regional Comparison - Europe
Data Table on Regional Comparison - Europe

13.4.1 Germany - Market size and forecast 2025-2030

Chart on Germany - Market size and forecast 2025-2030 ($ million)
Data Table on Germany - Market size and forecast 2025-2030 ($ million)
Chart on Germany - Year-over-year growth 2025-2030 (%)
Data Table on Germany - Year-over-year growth 2025-2030 (%)

13.4.2 UK - Market size and forecast 2025-2030

Chart on UK - Market size and forecast 2025-2030 ($ million)
Data Table on UK - Market size and forecast 2025-2030 ($ million)
Chart on UK - Year-over-year growth 2025-2030 (%)
Data Table on UK - Year-over-year growth 2025-2030 (%)

13.4.3 France - Market size and forecast 2025-2030

Chart on France - Market size and forecast 2025-2030 ($ million)
Data Table on France - Market size and forecast 2025-2030 ($ million)
Chart on France - Year-over-year growth 2025-2030 (%)
Data Table on France - Year-over-year growth 2025-2030 (%)

13.4.4 Italy - Market size and forecast 2025-2030

Chart on Italy - Market size and forecast 2025-2030 ($ million)
Data Table on Italy - Market size and forecast 2025-2030 ($ million)
Chart on Italy - Year-over-year growth 2025-2030 (%)
Data Table on Italy - Year-over-year growth 2025-2030 (%)

13.4.5 Spain - Market size and forecast 2025-2030

Chart on Spain - Market size and forecast 2025-2030 ($ million)
Data Table on Spain - Market size and forecast 2025-2030 ($ million)
Chart on Spain - Year-over-year growth 2025-2030 (%)
Data Table on Spain - Year-over-year growth 2025-2030 (%)

13.4.6 The Netherlands - Market size and forecast 2025-2030

Chart on The Netherlands - Market size and forecast 2025-2030 ($ million)
Data Table on The Netherlands - Market size and forecast 2025-2030 ($ million)
Chart on The Netherlands - Year-over-year growth 2025-2030 (%)
Data Table on The Netherlands - Year-over-year growth 2025-2030 (%)

13.5 Asia - Market size and forecast 2025-2030

Chart on Asia - Market size and forecast 2025-2030 ($ million)
Data Table on Asia - Market size and forecast 2025-2030 ($ million)
Chart on Asia - Year-over-year growth 2025-2030 (%)
Data Table on Asia - Year-over-year growth 2025-2030 (%)
Chart on Regional Comparison - Asia
Data Table on Regional Comparison - Asia

13.5.1 China - Market size and forecast 2025-2030

Chart on China - Market size and forecast 2025-2030 ($ million)
Data Table on China - Market size and forecast 2025-2030 ($ million)
Chart on China - Year-over-year growth 2025-2030 (%)
Data Table on China - Year-over-year growth 2025-2030 (%)

13.5.2 Japan - Market size and forecast 2025-2030

Chart on Japan - Market size and forecast 2025-2030 ($ million)
Data Table on Japan - Market size and forecast 2025-2030 ($ million)
Chart on Japan - Year-over-year growth 2025-2030 (%)
Data Table on Japan - Year-over-year growth 2025-2030 (%)

13.5.3 India - Market size and forecast 2025-2030

Chart on India - Market size and forecast 2025-2030 ($ million)
Data Table on India - Market size and forecast 2025-2030 ($ million)
Chart on India - Year-over-year growth 2025-2030 (%)
Data Table on India - Year-over-year growth 2025-2030 (%)

13.5.4 South Korea - Market size and forecast 2025-2030

Chart on South Korea - Market size and forecast 2025-2030 ($ million)
Data Table on South Korea - Market size and forecast 2025-2030 ($ million)
Chart on South Korea - Year-over-year growth 2025-2030 (%)
Data Table on South Korea - Year-over-year growth 2025-2030 (%)

13.5.5 Indonesia - Market size and forecast 2025-2030

Chart on Indonesia - Market size and forecast 2025-2030 ($ million)
Data Table on Indonesia - Market size and forecast 2025-2030 ($ million)
Chart on Indonesia - Year-over-year growth 2025-2030 (%)
Data Table on Indonesia - Year-over-year growth 2025-2030 (%)

13.5.6 Thailand - Market size and forecast 2025-2030

Chart on Thailand - Market size and forecast 2025-2030 ($ million)
Data Table on Thailand - Market size and forecast 2025-2030 ($ million)
Chart on Thailand - Year-over-year growth 2025-2030 (%)
Data Table on Thailand - Year-over-year growth 2025-2030 (%)

13.6 Rest of World (ROW) - Market size and forecast 2025-2030

Chart on Rest of World (ROW) - Market size and forecast 2025-2030 ($ million)
Data Table on Rest of World (ROW) - Market size and forecast 2025-2030 ($ million)
Chart on Rest of World (ROW) - Year-over-year growth 2025-2030 (%)
Data Table on Rest of World (ROW) - Year-over-year growth 2025-2030 (%)
Chart on Regional Comparison - Rest of World (ROW)
Data Table on Regional Comparison - Rest of World (ROW)

13.6.1 Brazil - Market size and forecast 2025-2030

Chart on Brazil - Market size and forecast 2025-2030 ($ million)
Data Table on Brazil - Market size and forecast 2025-2030 ($ million)
Chart on Brazil - Year-over-year growth 2025-2030 (%)
Data Table on Brazil - Year-over-year growth 2025-2030 (%)

13.6.2 Australia - Market size and forecast 2025-2030

Chart on Australia - Market size and forecast 2025-2030 ($ million)
Data Table on Australia - Market size and forecast 2025-2030 ($ million)
Chart on Australia - Year-over-year growth 2025-2030 (%)
Data Table on Australia - Year-over-year growth 2025-2030 (%)

13.6.3 Saudi Arabia - Market size and forecast 2025-2030

Chart on Saudi Arabia - Market size and forecast 2025-2030 ($ million)
Data Table on Saudi Arabia - Market size and forecast 2025-2030 ($ million)
Chart on Saudi Arabia - Year-over-year growth 2025-2030 (%)
Data Table on Saudi Arabia - Year-over-year growth 2025-2030 (%)

13.6.4 South Africa - Market size and forecast 2025-2030

Chart on South Africa - Market size and forecast 2025-2030 ($ million)
Data Table on South Africa - Market size and forecast 2025-2030 ($ million)
Chart on South Africa - Year-over-year growth 2025-2030 (%)
Data Table on South Africa - Year-over-year growth 2025-2030 (%)

13.6.5 Argentina - Market size and forecast 2025-2030

Chart on Argentina - Market size and forecast 2025-2030 ($ million)
Data Table on Argentina - Market size and forecast 2025-2030 ($ million)
Chart on Argentina - Year-over-year growth 2025-2030 (%)
Data Table on Argentina - Year-over-year growth 2025-2030 (%)

13.6.6 UAE - Market size and forecast 2025-2030

Chart on UAE - Market size and forecast 2025-2030 ($ million)
Data Table on UAE - Market size and forecast 2025-2030 ($ million)
Chart on UAE - Year-over-year growth 2025-2030 (%)
Data Table on UAE - Year-over-year growth 2025-2030 (%)

13.6.7 Chile - Market size and forecast 2025-2030

Chart on Chile - Market size and forecast 2025-2030 ($ million)
Data Table on Chile - Market size and forecast 2025-2030 ($ million)
Chart on Chile - Year-over-year growth 2025-2030 (%)
Data Table on Chile - Year-over-year growth 2025-2030 (%)

13.6.8 Israel - Market size and forecast 2025-2030

Chart on Israel - Market size and forecast 2025-2030 ($ million)
Data Table on Israel - Market size and forecast 2025-2030 ($ million)
Chart on Israel - Year-over-year growth 2025-2030 (%)
Data Table on Israel - Year-over-year growth 2025-2030 (%)

13.7 Market opportunity by geography

Market opportunity by geography ($ million)
Data Tables on Market opportunity by geography ($ million)

14. Drivers, Challenges, and Opportunity

14.1 Market drivers

Surging prevalence of autoimmune and chronic thyroid disorders
Advancements in diagnostic infrastructure and public screening initiatives
Technological progress in drug formulations and digital healthcare integration

14.2 Market challenges

Stringent bioequivalence regulations and narrow therapeutic index limitations
Supply chain vulnerabilities and frequent product recalls
Diagnostic backlogs and low public awareness in emerging economies

14.3 Impact of drivers and challenges

Impact of drivers and challenges in 2025 and 2030

14.4 Market opportunities

Proliferation of digital therapeutics and tele-endocrinology infrastructure
Shift toward precision oncology and targeted multikinase inhibitor formulations
Rising consumer integration of specialized nutraceuticals and preventative thyroid supplements

15. Competitive Landscape

15.1 Overview

15.2

Overview on criticality of inputs and factors of differentiation

15.3 Landscape disruption

Overview on factors of disruption

15.4 Industry risks

Impact of key risks on business

16. Competitive Analysis

16.1 Companies profiled

Companies covered

16.2 Company ranking index

16.3 Market positioning of companies

Matrix on companies position and classification

16.4 AbbVie Inc.

AbbVie Inc. - Overview
AbbVie Inc. - Business segments
AbbVie Inc. - Key news
AbbVie Inc. - Key offerings
AbbVie Inc. - Segment focus
SWOT

16.5 Amneal Pharmaceuticals Inc.

Amneal Pharmaceuticals Inc. - Overview
Amneal Pharmaceuticals Inc. - Business segments
Amneal Pharmaceuticals Inc. - Key offerings
Amneal Pharmaceuticals Inc. - Segment focus
SWOT

16.6 Bayer AG

Bayer AG - Overview
Bayer AG - Business segments
Bayer AG - Key offerings
Bayer AG - Segment focus
SWOT

16.7 Eli Lilly and Co.

Eli Lilly and Co. - Overview
Eli Lilly and Co. - Product / Service
Eli Lilly and Co. - Key news
Eli Lilly and Co. - Key offerings
SWOT

16.8 Fresenius Kabi AG

Fresenius Kabi AG - Overview
Fresenius Kabi AG - Product / Service
Fresenius Kabi AG - Key offerings
SWOT

16.9 Hikma Pharmaceuticals Plc

Hikma Pharmaceuticals Plc - Overview
Hikma Pharmaceuticals Plc - Business segments
Hikma Pharmaceuticals Plc - Key news
Hikma Pharmaceuticals Plc - Key offerings
Hikma Pharmaceuticals Plc - Segment focus
SWOT

16.10 IBSA Institut Biochimique SA

IBSA Institut Biochimique SA - Overview
IBSA Institut Biochimique SA - Product / Service
IBSA Institut Biochimique SA - Key offerings
SWOT

16.11 Lupin Ltd.

Lupin Ltd. - Overview
Lupin Ltd. - Business segments
Lupin Ltd. - Key news
Lupin Ltd. - Key offerings
Lupin Ltd. - Segment focus
SWOT

16.12 Merck KGaA

Merck KGaA - Overview
Merck KGaA - Business segments
Merck KGaA - Key news
Merck KGaA - Key offerings
Merck KGaA - Segment focus
SWOT

16.13 Novartis AG

Novartis AG - Overview
Novartis AG - Business segments
Novartis AG - Key news
Novartis AG - Key offerings
Novartis AG - Segment focus
SWOT

16.14 Pfizer Inc.

Pfizer Inc. - Overview
Pfizer Inc. - Business segments
Pfizer Inc. - Key news
Pfizer Inc. - Key offerings
Pfizer Inc. - Segment focus
SWOT

16.15 Piramal Pharma Ltd.

Piramal Pharma Ltd. - Overview
Piramal Pharma Ltd. - Business segments
Piramal Pharma Ltd. - Key offerings
Piramal Pharma Ltd. - Segment focus
SWOT

16.16 Sanofi SA

Sanofi SA - Overview
Sanofi SA - Business segments
Sanofi SA - Key news
Sanofi SA - Key offerings
Sanofi SA - Segment focus
SWOT

16.17 Takeda Pharmaceutical Ltd.

Takeda Pharmaceutical Ltd. - Overview
Takeda Pharmaceutical Ltd. - Business segments
Takeda Pharmaceutical Ltd. - Key news
Takeda Pharmaceutical Ltd. - Key offerings
Takeda Pharmaceutical Ltd. - Segment focus
SWOT

16.18 Viatris Inc.

Viatris Inc. - Overview
Viatris Inc. - Business segments
Viatris Inc. - Key news
Viatris Inc. - Key offerings
Viatris Inc. - Segment focus
SWOT

17. Appendix

17.1 Scope of the report

Market definition
Objectives
Notes and caveats

17.2 Inclusions and exclusions checklist

Inclusions checklist
Exclusions checklist

17.3 Currency conversion rates for US$

17.4 Research methodology

17.5 Data procurement

Information sources

17.6 Data validation

17.7 Validation techniques employed for market sizing

17.8 Data synthesis

17.9 360 degree market analysis

17.10 List of abbreviations

Research Methodology

Technavio presents a detailed picture of the market by way of study, synthesis, and summation of data from multiple sources. The analysts have presented the various facets of the market with a particular focus on identifying the key industry influencers. The data thus presented is comprehensive, reliable, and the result of extensive research, both primary and secondary.

INFORMATION SOURCES

Primary sources

  • Manufacturers and suppliers
  • Channel partners
  • Industry experts
  • Strategic decision makers

Secondary sources

  • Industry journals and periodicals
  • Government data
  • Financial reports of key industry players
  • Historical data
  • Press releases

DATA ANALYSIS

Data Synthesis

  • Collation of data
  • Estimation of key figures
  • Analysis of derived insights

Data Validation

  • Triangulation with data models
  • Reference against proprietary databases
  • Corroboration with industry experts

REPORT WRITING

Qualitative

  • Market drivers
  • Market challenges
  • Market trends
  • Five forces analysis

Quantitative

  • Market size and forecast
  • Market segmentation
  • Geographical insights
  • Competitive landscape

Interested in this report?

Get your sample now to see our research methodology and insights!

Download Now

Frequently Asked Questions

Thyroid Gland Disorder Treatment market growth will increase by USD 940.2 million during 2026-2030.

The Thyroid Gland Disorder Treatment market is expected to grow at a CAGR of 5.1% during 2026-2030.

Thyroid Gland Disorder Treatment market is segmented by Type (Hypothyroidism, Hyperthyroidism) Distribution channel (Offline, Online) Route of administration (Oral, Intravenous) Drug class (Hormone replacement therapies, Anti-thyroid drugs, Others)

Abbisko Therapeutics Co. Ltd., AbbVie Inc., Acella Pharmaceuticals LLC, Amneal Pharmaceuticals Inc., ANI Pharmaceuticals Inc., Aspen Pharmacare Ltd., Bayer AG, Egetis Therapeutics AB, Eli Lilly and Co., Fresenius Kabi AG, Hikma Pharmaceuticals Plc, IBSA Institut Biochimique SA, Lupin Ltd., Merck KGaA, Novartis AG, Pfizer Inc., Piramal Pharma Ltd., RLC Labs Inc., Sanofi SA, Takeda Pharmaceutical Ltd., Viatris Inc. are a few of the key vendors in the Thyroid Gland Disorder Treatment market.

North America will register the highest growth rate of 36.8% among the other regions. Therefore, the Thyroid Gland Disorder Treatment market in North America is expected to garner significant business opportunities for the vendors during the forecast period.

US, Canada, Mexico, Germany, UK, France, Italy, Spain, The Netherlands, China, Japan, India, South Korea, Indonesia, Thailand, Brazil, Australia, Saudi Arabia, South Africa, Argentina, UAE, Chile, Israel

  • Surging prevalence of autoimmune and chronic thyroid disorders is the driving factor this market.

The Thyroid Gland Disorder Treatment market vendors should focus on grabbing business opportunities from the Type segment as it accounted for the largest market share in the base year.
RIA - Research AI Assistant
Ask RIA
