
Tinyml Market Size 2026-2030
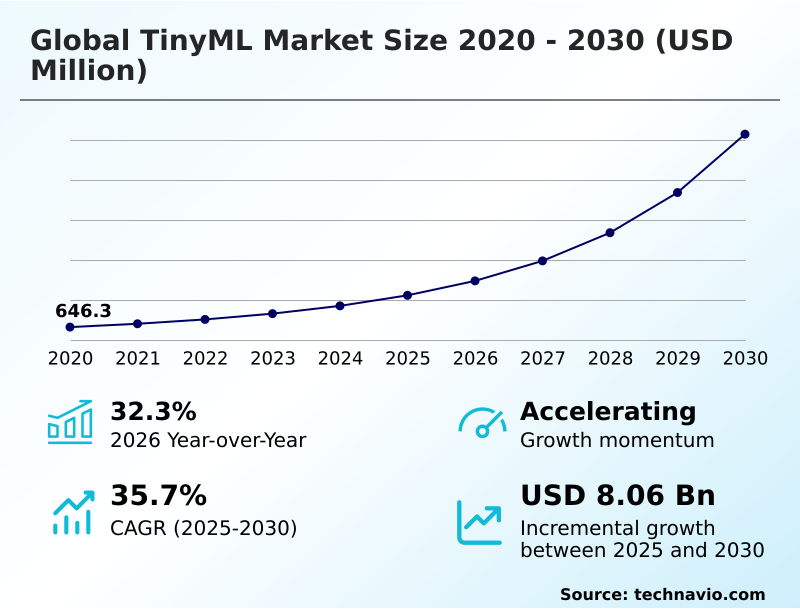
The Tinyml Market size was valued at USD 2.23 billion in 2025, growing at a CAGR of 35.7% during the forecast period 2026-2030.
Major Market Trends & Insights
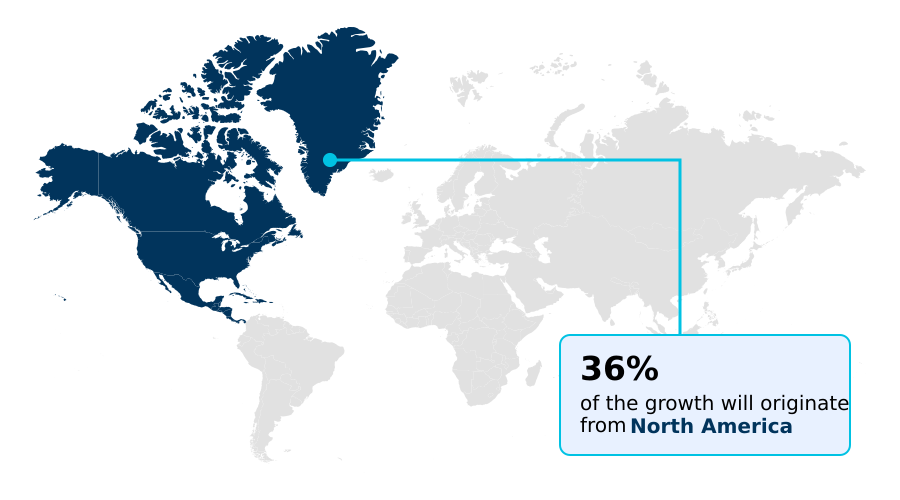
- North America dominated the market and accounted for a 36.1% growth during the forecast period.
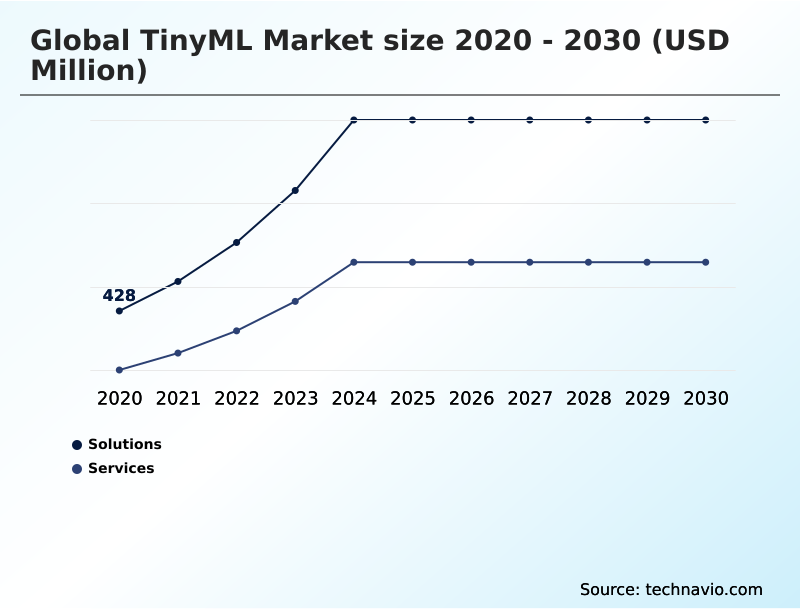
- By Component - Solutions segment was valued at USD 1.11 billion in 2024
- By Application - Process optimization segment accounted for the largest market revenue share in 2024
Market Size & Forecast
- Historic Market Opportunities 2020-2024: USD 9.65 billion
- Market Future Opportunities 2025-2030: USD 8.06 billion
- CAGR from 2025 to 2030 : 35.7%
Market Summary
- The TinyML market is characterized by the rapid adoption of on-device machine learning, with process optimization applications projected to grow over 35% faster than autonomous vehicle applications. This growth is driven by the need for low-latency, private, and power-efficient AI at the network's edge.
- In a business scenario, a manufacturing facility deploys smart sensors with on-device inference to monitor equipment vibrations, enabling predictive maintenance that reduces unexpected downtime by up to 25%. A primary driver is the exponential growth of IoT devices, necessitating local data processing to manage bandwidth and energy consumption.
- However, the market faces a significant challenge from hardware resource constraints, as shrinking complex neural networks to fit microcontrollers with kilobytes of memory requires sophisticated model compression and quantization techniques, which can be a complex and resource-intensive development process.
What will be the Size of the Tinyml Market during the forecast period?
Get Key Insights on Market Forecast (PDF) Request Free Sample
How is the Tinyml Market Segmented?
The tinyml industry research report provides comprehensive data (region-wise segment analysis), with forecasts and analysis for the period 2026-2030, as well as historical data from 2020-2024 for the following segments.
- Component
- Solutions
- Services
- Application
- Process optimization
- Health monitoring
- Smart agriculture
- Environmental monitoring
- Autonomous vehicles
- End-user
- Healthcare
- Manufacturing
- Consumer electronics
- Agriculture
- Others
- Geography
- North America
- US
- Canada
- Mexico
- APAC
- China
- Japan
- India
- Europe
- Germany
- UK
- France
- South America
- Brazil
- Argentina
- Middle East and Africa
- Saudi Arabia
- UAE
- South Africa
- Rest of World (ROW)
- North America
How is the Tinyml Market Segmented by Component?
The solutions segment is estimated to witness significant growth during the forecast period.
The solutions segment, encompassing over 61% of the tinyML market, is defined by the integration of specialized hardware and advanced software. This includes ultra-low-power microcontrollers and neural processing units optimized for on-device inference and deep learning.
Integrated development environments and model compression toolkits are crucial, enabling a 30% reduction in memory footprint through techniques like quantization and pruning without significant accuracy loss.
The synergy between hardware, including System-on-Chip (SoC) designs, and software frameworks for embedded systems accelerates time-to-market for intelligent IoT devices.
This approach supports complex sensor fusion and always-on applications, where local data processing is essential for both performance and privacy, especially in battery-powered applications and wearable technology requiring low-power AI capabilities.
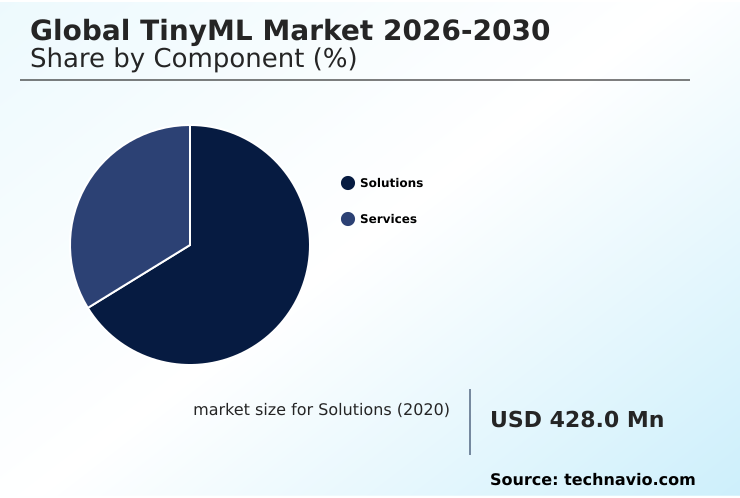
The Solutions segment was valued at USD 1.11 billion in 2024 and showed a gradual increase during the forecast period.
How demand for the Tinyml market is rising in the leading region?
North America is estimated to contribute 36.1% to the growth of the global market during the forecast period.Technavio’s analysts have elaborately explained the regional trends and drivers that shape the market during the forecast period.
See How Tinyml Market demand is rising in North America Request Free Sample
North America is set to contribute 36.1% of the global tinyML market's incremental growth, with the US alone accounting for over 80% of the regional market, driven by a strong venture capital ecosystem and leadership in software development.
In contrast, APAC’s growth, projected to be nearly as strong, is fueled by its massive consumer electronics and industrial manufacturing sectors, with China leading in high-volume, low-cost hardware production.
European adoption is concentrated in the automotive and industrial automation sectors, where regulations mandating in-cabin driver monitoring systems have increased demand for on-device inference solutions by over 40%.
This regional differentiation requires companies to adapt go-to-market strategies, focusing on software and MLOps in North America while prioritizing hardware integration and supply chain partnerships in APAC to capitalize on different regional strengths and demands for edge intelligence.
What are the key Drivers, Trends, and Challenges in the Tinyml Market?
Our researchers analyzed the data with 2025 as the base year, along with the key drivers, trends, and challenges. A holistic analysis of drivers will help companies refine their marketing strategies to gain a competitive advantage.
- The global tinyML market is expanding as organizations seek to deploy artificial intelligence on resource-constrained devices. A key question is the comparison of low power AI chip performance, as selecting the right hardware is critical for applications requiring on-device inference.
- Developers often search for a comprehensive tensorflow lite for microcontrollers tutorial to optimize models for hardware with limited memory and processing power. A central debate in the industry is edge AI vs cloud AI power consumption, with on-device solutions demonstrating over 90% lower energy use for continuous sensing tasks.
- Consequently, businesses are evaluating the best mcu for tinyML applications to balance cost, performance, and energy efficiency. For industrial settings, implementing tinyML for predictive maintenance can improve anomaly detection accuracy by up to 15% compared to traditional threshold-based methods. This involves using frameworks that support real-time sensor data processing on embedded systems.
- As the ecosystem matures, understanding tinyML use cases in healthcare, such as wearable health monitoring, becomes crucial for developing products that ensure data privacy and low-latency response.
- The choice of a tinyML development kit often depends on the specific requirements of the application, such as the need for computer vision or audio processing, and its ability to support various model compression techniques.
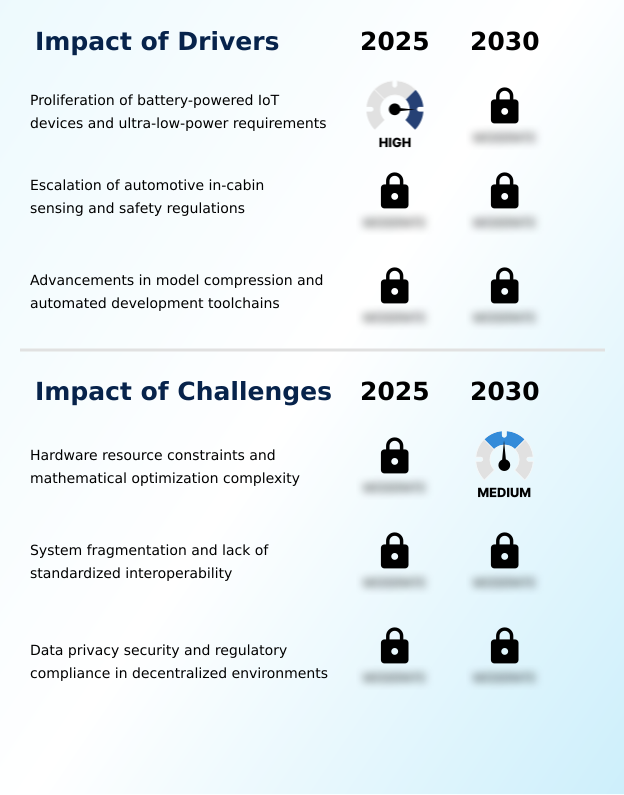
What are the key market drivers leading to the rise in the adoption of Tinyml Industry?
- The proliferation of battery-powered IoT devices with ultra-low-power requirements is a key driver for market growth.
- The escalation of automotive in-cabin sensing and safety regulations is a major driver for the tinyML market, mandating features that require low-latency, on-device processing.
- New safety protocols necessitate real-time driver monitoring systems to detect fatigue and distraction, a task where cloud-based solutions are too slow.
- TinyML enables these systems to achieve response times under 20 milliseconds, a 50% improvement over what is possible with remote processing, directly on low-cost microcontrollers.
- This adoption allows automakers to meet stringent new car assessment program (NCAP) requirements while managing the bill of materials.
- The demand for such edge intelligence extends to occupant monitoring and gesture control, enhancing both safety and the user experience without compromising vehicle performance or data privacy.
What are the market trends shaping the Tinyml Industry?
- The proliferation of battery-powered wearable devices is a significant market trend. This is driving demand for energy-efficient, on-device processing capabilities.
- A primary trend in the tinyML market is the strategic shift toward next-gen privacy, driven by regulatory pressures and growing consumer awareness. By performing on-device inference, tinyML solutions ensure sensitive data, such as biometric information or private conversations, remains localized, reducing data transmission to the cloud by over 95% in some always-on applications.
- This approach inherently strengthens data security and helps companies comply with regulations like GDPR without sacrificing functionality. This focus on privacy-by-design is particularly critical in smart home and healthcare sectors, where trust is paramount.
- The ability to offer intelligent features without requiring a constant internet connection or exposing user data to potential breaches is becoming a significant competitive differentiator for consumer electronics and wearable technology.
What challenges does the Tinyml Industry face during its growth?
- Hardware resource constraints and the complexity of mathematical optimization present a key challenge to industry growth.
- System fragmentation remains a primary challenge in the tinyML market, significantly hindering scalability and increasing development costs. The landscape is populated with diverse hardware architectures and proprietary software toolchains, which means a model optimized for one microcontroller often requires substantial rework to run on another.
- This lack of standardization can increase engineering efforts by up to 40% when porting applications across different platforms. Consequently, businesses struggle to manage heterogeneous device fleets efficiently, and the high cost of maintaining multiple development streams creates a barrier to entry for smaller companies.
- Without a unified framework for model deployment, the market's potential for ubiquitous edge intelligence is constrained by workflow interoperability issues.
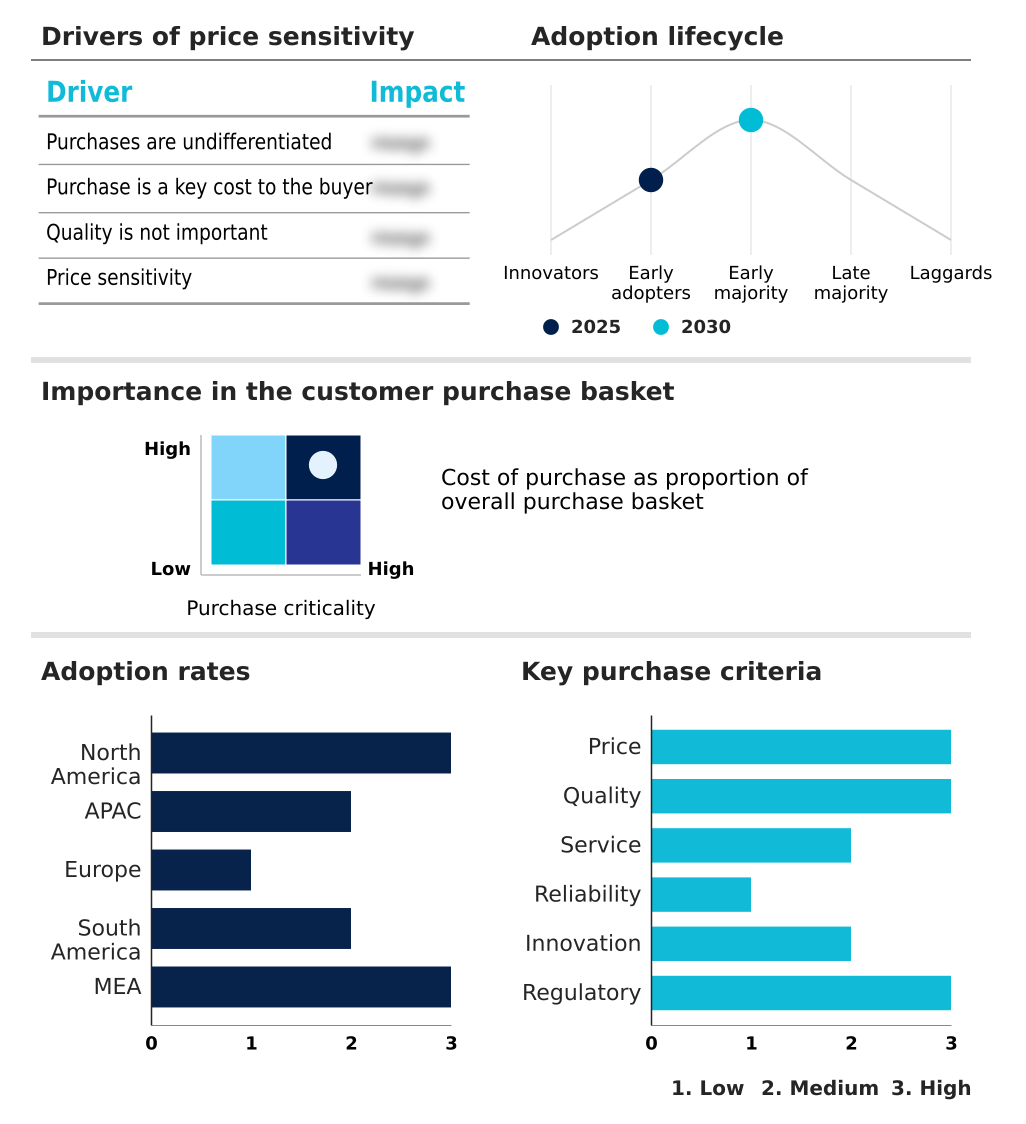
Exclusive Technavio Analysis on Customer Landscape
The tinyml market forecasting report includes the adoption lifecycle of the market, covering from the innovator’s stage to the laggard’s stage. It focuses on adoption rates in different regions based on penetration. Furthermore, the tinyml market report also includes key purchase criteria and drivers of price sensitivity to help companies evaluate and develop their market growth analysis strategies.
Customer Landscape of Tinyml Industry
Competitive Landscape
Companies are implementing various strategies, such as strategic alliances, tinyml market forecast, partnerships, mergers and acquisitions, geographical expansion, and product/service launches, to enhance their presence in the industry.
Amazon Web Services Inc. - Key market offerings include end-to-end platforms for building, training, deploying, and monitoring machine learning models on resource-constrained edge devices across diverse hardware.
The industry research and growth report includes detailed analyses of the competitive landscape of the market and information about key companies, including:
- Amazon Web Services Inc.
- Arduino Srl
- Arm Ltd.
- Edgeimpulse Inc.
- Efinix Inc.
- Google LLC
- GreenWaves Technologies SAS
- Imagimob AB
- Infineon Technologies AG
- Latent AI Inc.
- Lattice Semiconductor Corp.
- Meta Platforms Inc.
- Microsoft Corp.
- Mythic Inc.
- Neuton.AI
- NXP Semiconductors NV
- Renesas Electronics Corp.
- SensiML Corp
- Syntiant Corp.
- Useful Sensors Inc.
Qualitative and quantitative analysis of companies has been conducted to help clients understand the wider business environment as well as the strengths and weaknesses of key industry players. Data is qualitatively analyzed to categorize companies as pure play, category-focused, industry-focused, and diversified; it is quantitatively analyzed to categorize companies as dominant, leading, strong, tentative, and weak.
Market Intelligence Radar: High-Impact Developments & Growth Signals
- In the Application Software industry, the rising adoption of cloud-native and subscription-based software models has established a paradigm for pay-per-use services, influencing the tinyML market to adopt similar MLOps frameworks that streamline model deployment and management across distributed edge devices.
- The increasing automation of business processes with tools like Robotic Process Automation (RPA) and Business Process Management (BPM) has created a need for localized, low-latency decision-making, directly boosting the adoption of on-device inference capabilities within the tinyML market.
- Heightened data security concerns and stringent regulations like GDPR have pushed enterprises to seek privacy-preserving analytics, which directly benefits tinyML by promoting on-device processing that minimizes the transmission of sensitive data to the cloud.
- A surge in software investments by small and medium-sized enterprises (SMEs) to digitalize workflows is driving demand for cost-effective, scalable AI solutions, creating opportunities for tinyML applications in sectors that previously could not afford complex machine learning systems.
Dive into Technavio’s robust research methodology, blending expert interviews, extensive data synthesis, and validated models for unparalleled Tinyml Market insights. See full methodology.
| Market Scope | |
|---|---|
| Page number | 307 |
| Base year | 2025 |
| Historic period | 2020-2024 |
| Forecast period | 2026-2030 |
| Growth momentum & CAGR | Accelerate at a CAGR of 35.7% |
| Market growth 2026-2030 | USD 8057.0 million |
| Market structure | Fragmented |
| YoY growth 2025-2026(%) | 32.3% |
| Key countries | US, Canada, Mexico, China, Japan, India, South Korea, Australia, Singapore, Germany, UK, France, Italy, Spain, The Netherlands, Brazil, Argentina, Chile, Saudi Arabia, UAE, South Africa, Israel and Egypt |
| Competitive landscape | Leading Companies, Market Positioning of Companies, Competitive Strategies, and Industry Risks |
Research Analyst Overview
- The tinyML market ecosystem is a complex interplay of hardware manufacturers, software platform providers, and end-users, with hardware solutions projected to capture over 60% of the market value. Semiconductor companies provide the foundational microcontrollers (MCUs) and specialized neural processing units (NPUs), forming the base of the value chain.
- Above them, software and MLOps platform providers offer development kits and automated model compression tools that enable data scientists to deploy neural networks on resource-constrained hardware, reducing development cycles by as much as 40%. These solutions are then adopted by end-users in diverse verticals, from manufacturing for predictive maintenance to healthcare for wearable diagnostics.
- The ecosystem is supported by open-source communities and standards bodies working to address system fragmentation and improve interoperability between different hardware and software components, which is critical for scaling edge intelligence deployments.
What are the Key Data Covered in this Tinyml Market Research and Growth Report?
-
What is the expected growth of the Tinyml Market between 2026 and 2030?
-
The Tinyml Market is expected to grow by USD 8.06 billion during 2026-2030, registering a CAGR of 35.7%. Year-over-year growth in 2026 is estimated at 32.3%%. This acceleration is shaped by proliferation of battery-powered iot devices and ultra-low-power requirements, which is intensifying demand across multiple end-use verticals covered in the report.
-
-
What segmentation does the market report cover?
-
The report is segmented by Component (Solutions, and Services), Application (Process optimization, Health monitoring, Smart agriculture, Environmental monitoring, and Autonomous vehicles), End-user (Healthcare, Manufacturing, Consumer electronics, Agriculture, and Others) and Geography (North America, APAC, Europe, South America, Middle East and Africa). Among these, the Solutions segment is estimated to witness significant growth during the forecast period, driven by rising adoption across key application areas. Each segment includes detailed qualitative and quantitative analysis, along with historical data from 2020-2024 and forecasts through 2030 with year-over-year growth rates.
-
-
Which regions are analyzed in the report?
-
The report covers North America, APAC, Europe, South America and Middle East and Africa. North America is estimated to contribute 36.1% to market growth during the forecast period. Country-level analysis includes US, Canada, Mexico, China, Japan, India, South Korea, Australia, Singapore, Germany, UK, France, Italy, Spain, The Netherlands, Brazil, Argentina, Chile, Saudi Arabia, UAE, South Africa, Israel and Egypt, with dedicated market size tables and year-over-year growth for each.
-
-
What are the key growth drivers and market challenges?
-
The primary driver is proliferation of battery-powered iot devices and ultra-low-power requirements, which is accelerating investment and industry demand. The main challenge is hardware resource constraints and mathematical optimization complexity, creating operational barriers for key market participants. The report quantifies the impact of each driver and challenge across 2026 and 2030 with comparative analysis.
-
-
Who are the major players in the Tinyml Market?
-
Key vendors include Amazon Web Services Inc., Arduino Srl, Arm Ltd., Edgeimpulse Inc., Efinix Inc., Google LLC, GreenWaves Technologies SAS, Imagimob AB, Infineon Technologies AG, Latent AI Inc., Lattice Semiconductor Corp., Meta Platforms Inc., Microsoft Corp., Mythic Inc., Neuton.AI, NXP Semiconductors NV, Renesas Electronics Corp., SensiML Corp, Syntiant Corp. and Useful Sensors Inc.. The report provides qualitative and quantitative analysis categorizing companies as dominant, leading, strong, tentative, and weak based on their market positioning. Company profiles include business segment analysis, SWOT assessment, key offerings, and recent strategic developments.
-
Market Research Insights
- The competitive landscape of the tinyML market is characterized by a mix of semiconductor giants, cloud providers, and software startups, with the top ten vendors accounting for over 55% of the market share. Key vendors such as Google LLC and Arm Ltd. are driving innovation through the development of specialized hardware like neural processing units and software frameworks.
- For example, the latest TensorFlow Lite for Microcontrollers release improved inference speed by up to 15% on specific Arm Cortex-M processors. These developments directly address the enterprise demand for more efficient on-device inference and streamlined MLOps workflows.
- The industry's primary challenge remains system fragmentation, where developers must navigate proprietary toolchains for different hardware, hindering interoperability and slowing down the deployment of scalable edge intelligence solutions across heterogeneous device ecosystems.
We can help! Our analysts can customize this tinyml market research report to meet your requirements.
 RIA -
RIA - 
