Tomato Market Size 2026-2030
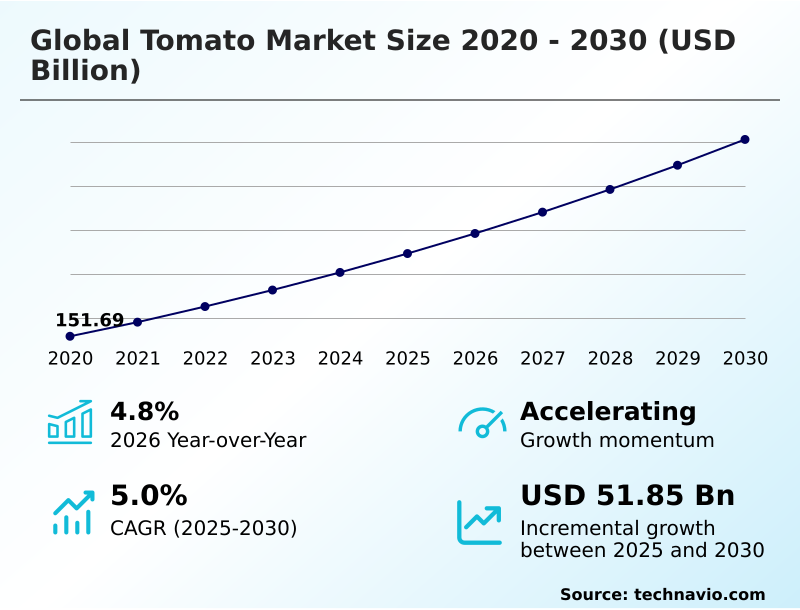
The tomato market size is valued to increase by USD 51.85 billion, at a CAGR of 5% from 2025 to 2030. High demand for tomatoes from food sector will drive the tomato market.
Major Market Trends & Insights
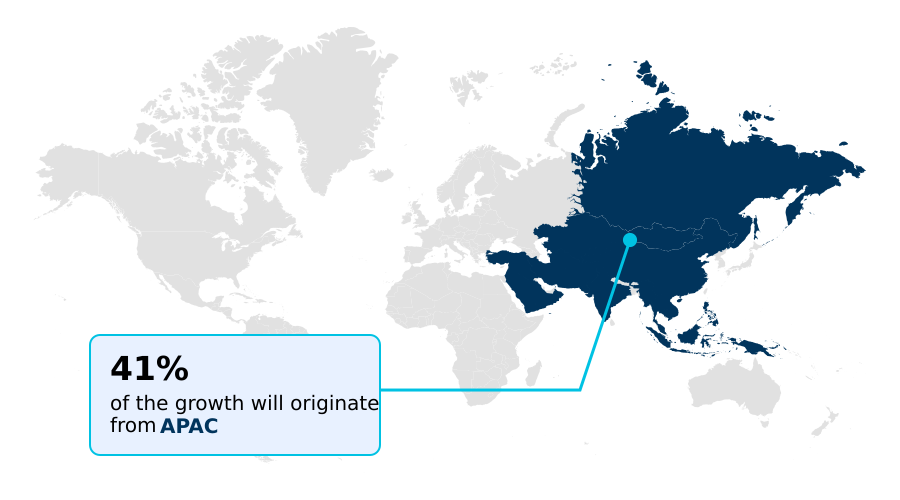
- APAC dominated the market and accounted for a 40.8% growth during the forecast period.
- By Product Type - Fresh segment was valued at USD 78.19 billion in 2024
- By Type - Conventional segment accounted for the largest market revenue share in 2024
Market Size & Forecast
- Market Opportunities: USD 89.47 billion
- Market Future Opportunities: USD 51.85 billion
- CAGR from 2025 to 2030 : 5%
Market Summary
- The tomato market is a cornerstone of global agriculture, defined by consistent demand from both fresh consumption and industrial food processing sectors. Growth is supported by rising consumer health awareness, which elevates the status of tomatoes as a functional food ingredient, driving interest in specialty and organic tomato segments.
- However, the industry faces significant hurdles from climate variability, which can disrupt supply chains and create wholesale price volatility. To mitigate these risks, leading producers are adopting climate adaptation strategies and investing in resilient horticultural production methods.
- For instance, a major food manufacturer can leverage a farm-to-fork traceability system to monitor its supply of processed tomato derivatives, ensuring that any disruption from a localized weather event is quickly identified and rerouted through alternate suppliers.
- This strategic use of technology enhances supply chain resilience, protects against agricultural commodity trade fluctuations, and secures a stable supply of essential food manufacturing inputs, reinforcing market stability.
What will be the Size of the Tomato Market during the forecast period?
Get Key Insights on Market Forecast (PDF) Get Free Sample
How is the Tomato Market Segmented?
The tomato industry research report provides comprehensive data (region-wise segment analysis), with forecasts and estimates in "USD million" for the period 2026-2030, as well as historical data from 2020-2024 for the following segments.
- Product type
- Fresh
- Frozen
- Dried
- Type
- Conventional
- Organic
- Distribution channel
- Indirect
- Direct
- Geography
- APAC
- China
- India
- Japan
- North America
- US
- Mexico
- Canada
- Europe
- Italy
- Spain
- The Netherlands
- Middle East and Africa
- South Africa
- South America
- Brazil
- Argentina
- Rest of World (ROW)
- APAC
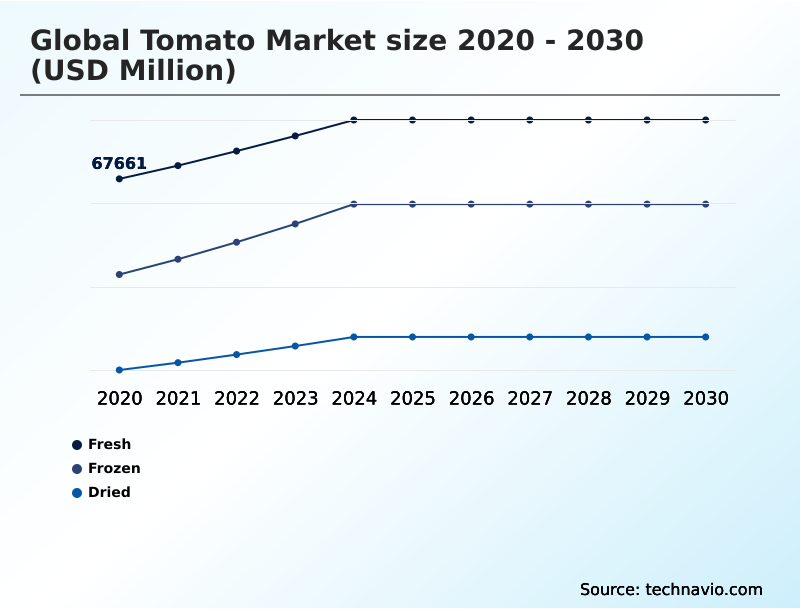
By Product Type Insights
The fresh segment is estimated to witness significant growth during the forecast period.
The fresh produce market segment is shaped by strong consumer demand for high-quality, safe, and readily available products. Success in this area hinges on robust supply chain resilience, particularly in cold chain logistics and post-harvest loss reduction strategies.
Advanced greenhouse climate control and efficient drip irrigation systems are critical for maintaining consistent output and meeting the stringent vine-ripened quality standards required by retail grocery distribution networks.
Furthermore, implementing comprehensive food safety traceability provides the farm-to-fork transparency that a growing number of health-conscious consumers demand.
Innovations in packaging and handling that focus on shelf life extension are also paramount, with some advanced logistics systems reducing spoilage by up to 25%, ensuring that supermarket procurement standards are consistently met.
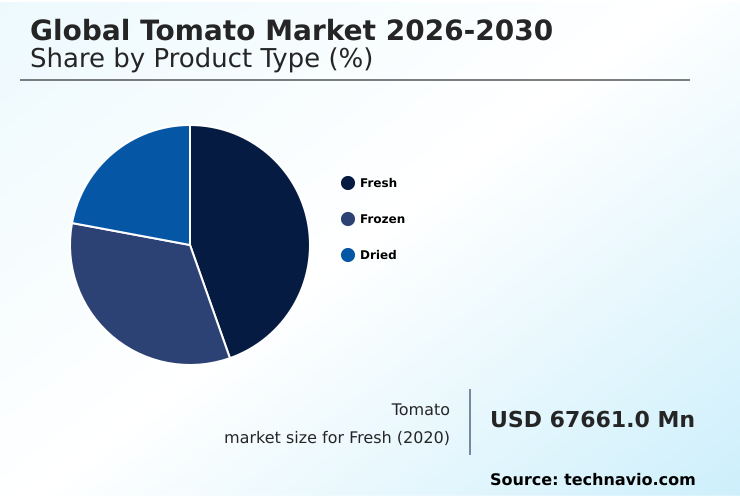
The Fresh segment was valued at USD 78.19 billion in 2024 and showed a gradual increase during the forecast period.
Regional Analysis
APAC is estimated to contribute 40.8% to the growth of the global market during the forecast period.Technavio’s analysts have elaborately explained the regional trends and drivers that shape the market during the forecast period.
See How Tomato Market Demand is Rising in APAC Get Free Sample
The geographic landscape of the market is diverse, with horticultural production centers in APAC, Europe, and the Americas driving global supply. APAC accounts for 40.8% of the market's incremental growth, fueled by strong domestic consumption and expanding export market access.
In contrast, European producers often lead in technological adoption, utilizing advanced hydroponic cultivation systems and geothermal energy cultivation to enhance sustainability. These controlled environments enable a circular economy in agriculture, where resources like water and energy are optimized.
For instance, greenhouse operations in The Netherlands report up to 15% higher water use efficiency than traditional open-field farms.
Across all regions, climate adaptation strategies are becoming critical for managing wholesale price volatility, with an increasing reliance on robust contract farming models to stabilize the supply of functional food ingredients for aseptic processing technology.
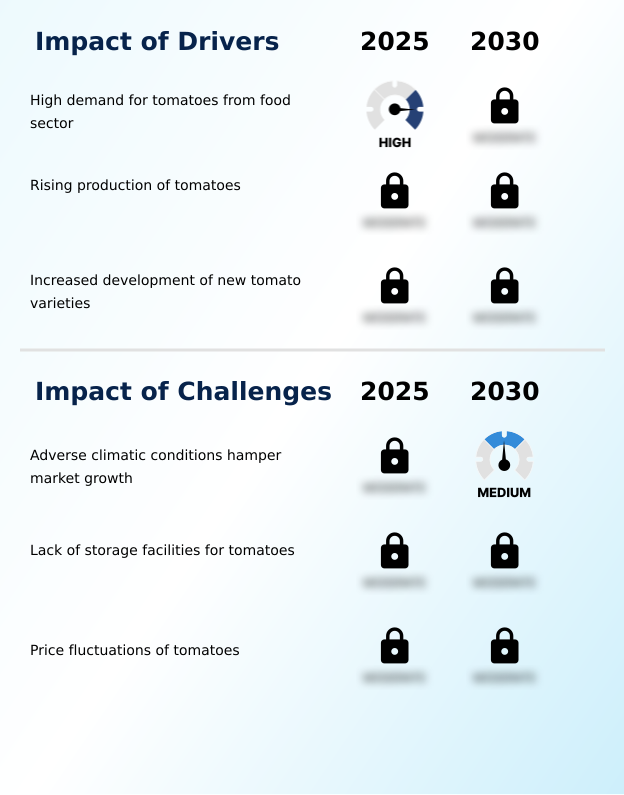
Market Dynamics
Our researchers analyzed the data with 2025 as the base year, along with the key drivers, trends, and challenges. A holistic analysis of drivers will help companies refine their marketing strategies to gain a competitive advantage.
- Achieving success in the contemporary tomato market requires a holistic understanding of factors from cultivation to consumption. Stakeholders must evaluate the impact of brix level on tomato paste quality, as it directly influences the final product's value in industrial applications.
- Optimizing drip irrigation for greenhouse tomatoes is crucial for resource management, just as leveraging CEA technology for year-round tomato production ensures supply consistency. A primary operational focus is on reducing post-harvest loss in tomato supply chains through better handling and advanced cold chain management for fresh tomato exports.
- Growers are adopting sustainable practices for conventional tomato farming while also implementing integrated pest management for organic tomato crops to meet diverse consumer demands. To navigate market volatility, developing strategies for managing tomato price fluctuations is essential.
- The industry is also capitalizing on consumer trends driving organic tomato market growth by highlighting the health benefits of high-lycopene tomato varieties and exploring market opportunities for specialty heirloom tomatoes. Processors are implementing aseptic packaging for extending tomato sauce shelf life and finding new uses for value-added products from tomato processing waste.
- This entire value chain is grappling with the challenges of climate change on tomato cultivation, making technologies for improving tomato crop water efficiency and comparing hydroponic and soil-based tomato yields critical for future planning.
- Firms that master traceability systems in the fresh tomato industry, adhere to regulatory standards for exporting processed tomatoes, and utilize advanced methods for fungal disease control in tomatoes are best positioned for success. For example, producers using advanced control methods report spoilage rates nearly half those of farms with conventional schedules, directly boosting profitability.
What are the key market drivers leading to the rise in the adoption of Tomato Industry?
- The primary market driver is the high and sustained demand for tomatoes from the industrial food processing sector.
- The industrial food processing sector remains the primary engine of the market, fueled by unceasing demand for processed tomato derivatives used in ready-to-eat meal components and other convenience foods.
- Food service industry demand requires a consistent supply of ingredients with specific attributes, such as a uniform tomato paste brix level and fruit firmness measurement, to ensure product consistency.
- In response, growers are adopting hybrid seed varieties and precision agriculture technology to achieve significant crop yield optimization, with some farms boosting output by over 20%.
- This synergy between agriculture and food manufacturing input requirements is creating new opportunities, including tomato pomace valorization, where byproducts are converted into new revenue streams.
- Processors that secure a stable supply of high-quality raw materials can improve operational efficiency by more than 10%, strengthening their competitiveness in both branded and private label manufacturing.
What are the market trends shaping the Tomato Industry?
- The market is increasingly influenced by a prominent trend centered on the numerous health benefits associated with tomato consumption. This shift is reshaping consumer preferences and purchasing behavior toward wellness-oriented products.
- A significant trend transforming the market is the convergence of consumer health awareness and food technology. This is driving demand for value-added tomato products formulated with specific wellness benefits, moving beyond simple culinary application versatility. The focus is now on the biochemical composition analysis of tomatoes to isolate and market beneficial compounds.
- For instance, the lycopene extraction process is being refined for nutraceutical applications, leading to the development of bio-fortified tomato varieties. These varieties can offer up to 50% higher antioxidant content, meeting demand from the dietary supplement formulation sector.
- Quality assessment is also becoming more sophisticated, with metrics like total soluble solids (TSS) and colorimetric quality assessment used to validate the premium attributes of non-GMO verified heirloom tomato genetics. This shift allows producers to command higher margins, as surveys show consumers will pay a 15% premium for such products.
What challenges does the Tomato Industry face during its growth?
- A key challenge affecting industry growth is the adverse and unpredictable climatic conditions that hamper consistent tomato production.
- Navigating the modern agri-food supply chain presents multifaceted challenges, from on-farm production to market delivery. At the cultivation level, effective soil nutrient management and blossom-end rot prevention are constant operational hurdles that directly impact yield and quality.
- In the face of climate instability, growers are increasingly turning to controlled-environment agriculture (CEA) and integrated pest management (IPM) to maintain control over production. CEA systems can reduce water consumption by up to 90% compared to open-field farming, addressing concerns around water use efficiency.
- Adherence to stringent organic certification standards requires a deep commitment to sustainable farming practices, including advanced methods for fungal disease control. This complexity extends to the market, where supply and demand dynamics influence agricultural commodity trade and require robust crop insurance policies to mitigate financial risk, even for those exploring direct-to-consumer sales.
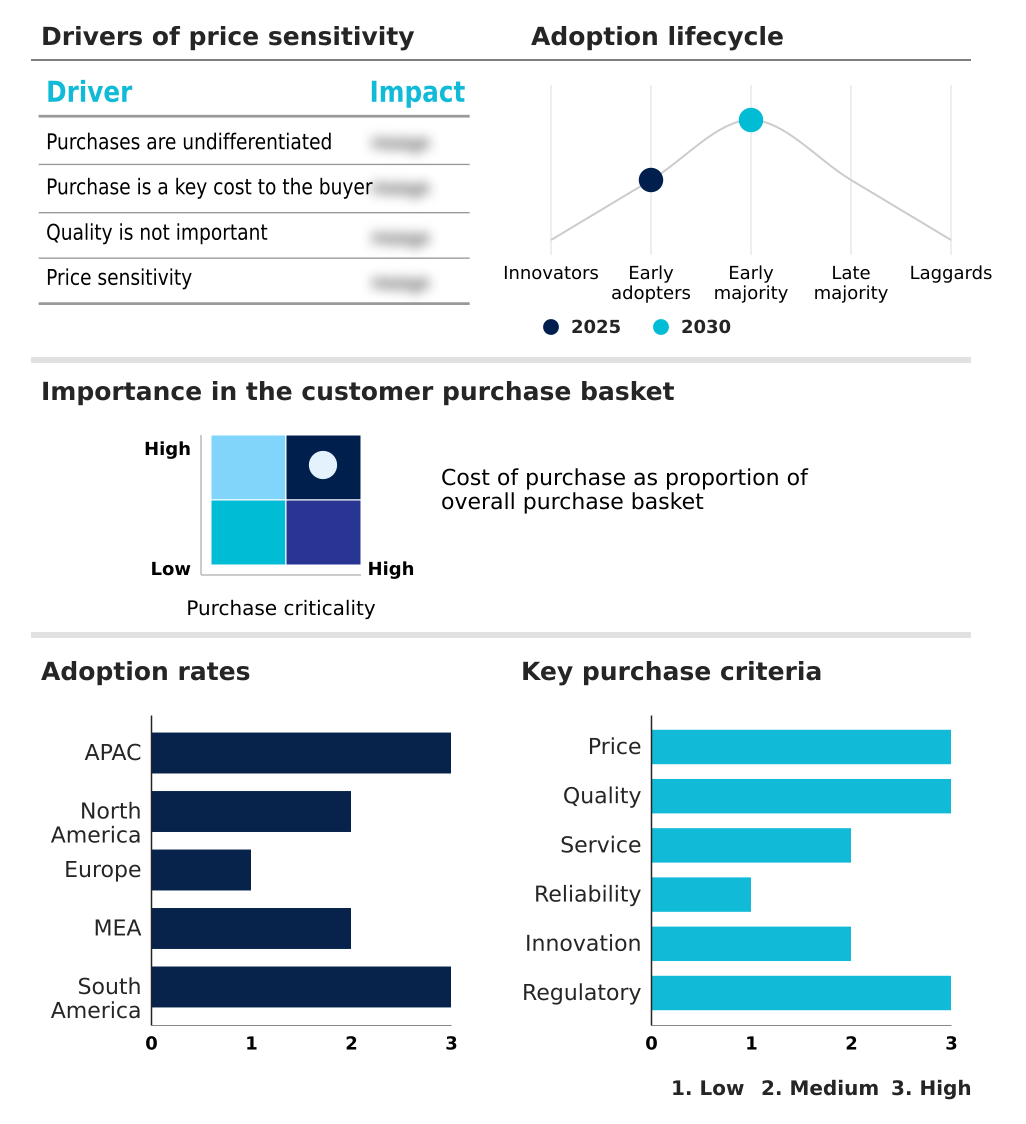
Exclusive Technavio Analysis on Customer Landscape
The tomato market forecasting report includes the adoption lifecycle of the market, covering from the innovator’s stage to the laggard’s stage. It focuses on adoption rates in different regions based on penetration. Furthermore, the tomato market report also includes key purchase criteria and drivers of price sensitivity to help companies evaluate and develop their market growth analysis strategies.
Customer Landscape of Tomato Industry
Competitive Landscape
Companies are implementing various strategies, such as strategic alliances, tomato market forecast, partnerships, mergers and acquisitions, geographical expansion, and product/service launches, to enhance their presence in the industry.
Casalasco Societa Agricola SpA - Provides processed tomato ingredients, including pulps and pastes, catering to global private label and industrial food manufacturing sectors.
The industry research and growth report includes detailed analyses of the competitive landscape of the market and information about key companies, including:
- Casalasco Societa Agricola SpA
- Chalkis Health Industry Ltd.
- Duijvestijn Tomaten
- Houweling Group
- Ingomar Packing Co.
- Kagome Co. Ltd.
- Los Gatos Tomato Products
- Magic Sun Farms
- Mucci Intl. Mrktg. Inc.
- NatureSweet Ltd.
- Ontario Vegetable Growers
- Pacific Rim Agri Services
- R and L Holt Ltd.
- RedStar
- Royal Pride Holland
- Sahyadri Farmers Producer Co.
- The Global Green Co. Ltd.
- The Morning Star Co.
- Tomato Growers Supply Co.
- West Coast Tomato LLC
Qualitative and quantitative analysis of companies has been conducted to help clients understand the wider business environment as well as the strengths and weaknesses of key industry players. Data is qualitatively analyzed to categorize companies as pure play, category-focused, industry-focused, and diversified; it is quantitatively analyzed to categorize companies as dominant, leading, strong, tentative, and weak.
Recent Development and News in Tomato market
- In April 2025, AgriTech Solutions unveiled a new AI-powered precision irrigation system for greenhouse tomato cultivation, designed to improve water use efficiency by up to 30%.
- In March 2025, the World Health Institute published a meta-analysis that confirmed a direct link between the consumption of cooked tomato products and reduced inflammatory markers, fueling consumer interest in high-lycopene foods.
- In February 2025, Global Food Processors Inc. announced a multi-billion-dollar initiative to expand its tomato processing capacities in South Asia to capitalize on the growing middle-class demand for westernized food products.
- In January 2025, the AgroEuropa Cooperative reported significant crop decimation across Mediterranean tomato plantations due to an unprecedented cold snap, triggering a supply shock and sharp price increases in European wholesale markets.
Dive into Technavio’s robust research methodology, blending expert interviews, extensive data synthesis, and validated models for unparalleled Tomato Market insights. See full methodology.
| Market Scope | |
|---|---|
| Page number | 280 |
| Base year | 2025 |
| Historic period | 2020-2024 |
| Forecast period | 2026-2030 |
| Growth momentum & CAGR | Accelerate at a CAGR of 5% |
| Market growth 2026-2030 | USD 51853.4 million |
| Market structure | Fragmented |
| YoY growth 2025-2026(%) | 4.8% |
| Key countries | China, India, Japan, Indonesia, South Korea, Vietnam, US, Mexico, Canada, Italy, Spain, The Netherlands, Poland, France, Germany, Egypt, Nigeria, South Africa, Kenya, Morocco, Brazil, Argentina and Chile |
| Competitive landscape | Leading Companies, Market Positioning of Companies, Competitive Strategies, and Industry Risks |
Research Analyst Overview
- The tomato market's operational framework is undergoing a significant technological transformation, driven by the need for greater efficiency and resilience. The integration of controlled-environment agriculture (CEA) is fundamental, as it enables precise management of growing conditions, directly impacting crop yield optimization. Firms leveraging CEA have achieved a 20% increase in yields compared to conventional methods.
- Core to this is a focus on agronomic trait selection and the use of specialized hybrid seed varieties to enhance plant stress physiology and output. Advanced precision agriculture technology, including sophisticated drip irrigation systems, optimizes water use efficiency. In processing, aseptic processing technology and understanding the tomato paste brix level are critical for quality control.
- Boardroom decisions increasingly center on capital investment in food safety traceability systems and cold chain logistics to mitigate risks associated with post-harvest loss reduction and ensure compliance.
- Furthermore, strategies for pest infestation management and fungal disease control are evolving, with a move toward integrated approaches that support sustainable farming practices and shelf life extension, reinforcing the importance of a technologically adept and integrated supply chain.
What are the Key Data Covered in this Tomato Market Research and Growth Report?
-
What is the expected growth of the Tomato Market between 2026 and 2030?
-
USD 51.85 billion, at a CAGR of 5%
-
-
What segmentation does the market report cover?
-
The report is segmented by Product Type (Fresh, Frozen, and Dried), Type (Conventional, and Organic), Distribution Channel (Indirect, and Direct) and Geography (APAC, North America, Europe, Middle East and Africa, South America)
-
-
Which regions are analyzed in the report?
-
APAC, North America, Europe, Middle East and Africa and South America
-
-
What are the key growth drivers and market challenges?
-
High demand for tomatoes from food sector, Adverse climatic conditions hamper market growth
-
-
Who are the major players in the Tomato Market?
-
Casalasco Societa Agricola SpA, Chalkis Health Industry Ltd., Duijvestijn Tomaten, Houweling Group, Ingomar Packing Co., Kagome Co. Ltd., Los Gatos Tomato Products, Magic Sun Farms, Mucci Intl. Mrktg. Inc., NatureSweet Ltd., Ontario Vegetable Growers, Pacific Rim Agri Services, R and L Holt Ltd., RedStar, Royal Pride Holland, Sahyadri Farmers Producer Co., The Global Green Co. Ltd., The Morning Star Co., Tomato Growers Supply Co. and West Coast Tomato LLC
-
Market Research Insights
- Market dynamics are increasingly shaped by efforts to enhance supply chain resilience and meet evolving consumer expectations for transparency. The strategic implementation of farm-to-fork traceability systems has been shown to increase consumer trust by over 40% compared to conventional labeling.
- Simultaneously, the adoption of comprehensive crop insurance policies is becoming standard practice, reducing financial volatility for growers by as much as 60% during adverse weather events. This focus on risk mitigation extends to the retail grocery distribution network, where sophisticated inventory management improves efficiency.
- As the agri-food supply chain becomes more complex, stakeholders are prioritizing strategies that ensure stability from horticultural production to final sale, balancing supply and demand dynamics in a volatile environment.
We can help! Our analysts can customize this tomato market research report to meet your requirements.
 RIA -
RIA - 
