Flexible Display Market Analysis APAC, North America, Europe, Middle East and Africa, South America - US, South Korea, Japan, UK, China - Size and Forecast 2024-2028

Flexible Display Market Analysis APAC, North America, Europe, Middle East and Africa, South America - US, South Korea, Japan, UK, China - Size and Forecast 2024-2028

Published: Jul 2024 154 Pages SKU: IRTNTR73251

Market Overview at a Glance

$18.5 B
Market Opportunity
10.08%
CAGR
9.0
YoY growth 2023-2024(%)

Flexible Display Market Size 2024-2028 

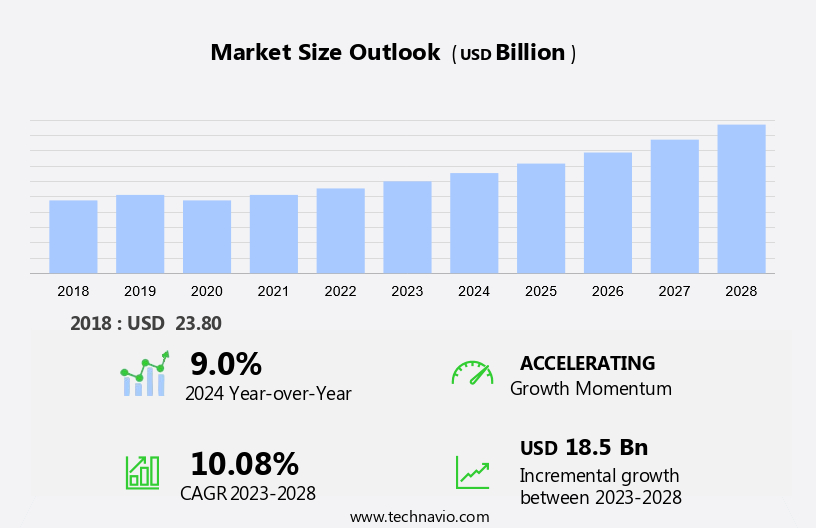
The flexible display market size is forecast to increase by USD 18.5 billion, at a CAGR of 10.08% between 2023 and 2028. The market is experiencing significant growth due to advancements in technology and increasing demand from various industries. Key drivers include increased research and development investments and the introduction of innovative flexible display products. However, the market also faces challenges such as the shortened shelf life of these displays. In the consumer electronics sector, flexible displays are gaining popularity in smartphones, laptops, and desktop screens. OLED screens, a type of flexible display, are particularly sought after for their high resolution and energy efficiency. The trend is not limited to consumer electronics alone, as flexible displays are also making their way into televisions and wearables. The supply chain for flexible displays is complex, involving multiple stakeholders from raw material suppliers to manufacturers and end-users. Ensuring a seamless supply chain is crucial to meet the growing demand for these displays. As the market continues to evolve, it is essential for businesses to stay informed about the latest trends and challenges to remain competitive.

Market Analysis

Flexible Display Market Size

 Request Free Sample

The market is witnessing significant advancements driven by the increasing demand for innovative and versatile display solutions in various applications. Flexible displays offer numerous benefits such as enhanced durability, improved design aesthetics, and the ability to conform to different shapes and sizes. In the consumer electronics sector, flexible displays are gaining popularity in smartphones and wearable devices. The integration of these displays enables manufacturers to create sleeker, more compact devices with unique form factors. Moreover, the adoption of flexible displays in connected technologies, such as smart home products, is expected to expand their application base further. Moreover, one of the primary display technologies driving the market is OLED (Organic Light-Emitting Diode). OLED displays offer several advantages, including high contrast ratio, deep blacks, and energy efficiency. Companies like TCL CSOT and Samsung are investing heavily in OLED technology to cater to the growing demand for flexible OLED displays. Another significant development in the market is the emergence of rollable displays. Rollable displays allow for larger screen sizes to be compacted into smaller form factors, making them ideal for smartphones, laptops, and even desktop screens. Stanford University and other research institutions are exploring the potential of rollable OLED displays, while companies like LG and TCL have already showcased prototypes.

Additionally, the market's supply chain is undergoing transformative changes to accommodate the increasing demand for these advanced displays. Key players are collaborating with material suppliers, equipment manufacturers, and other stakeholders to ensure a steady supply of raw materials and components. Flexible displays are also making their way into the television market, with manufacturers like Samsung and LG introducing curved and rollable TVs. These displays offer a more interactive viewing experience and are expected to gain traction among consumers looking for premium home entertainment solutions. The market's growth is not limited to consumer electronics alone. Industries like healthcare, transportation, and advertising are also exploring the potential of flexible displays for various applications. For instance, flexible EPD (Electrophoretic Display) panels are being used in e-readers and signage, while flexible glass and metal displays are being considered for use in automotive and aerospace applications.

Market Segmentation

The market research report provides comprehensive data (region-wise segment analysis), with forecasts and estimates in "USD billion" for the period 2024-2028, as well as historical data from 2018-2022 for the following segments.

  • Application
    • Smartphones
    • Wearables
    • TVs
    • Others
  • Geography
    • APAC
      • China
      • Japan
      • South Korea
    • North America
      • US
    • Europe
      • UK
    • Middle East and Africa
    • South America

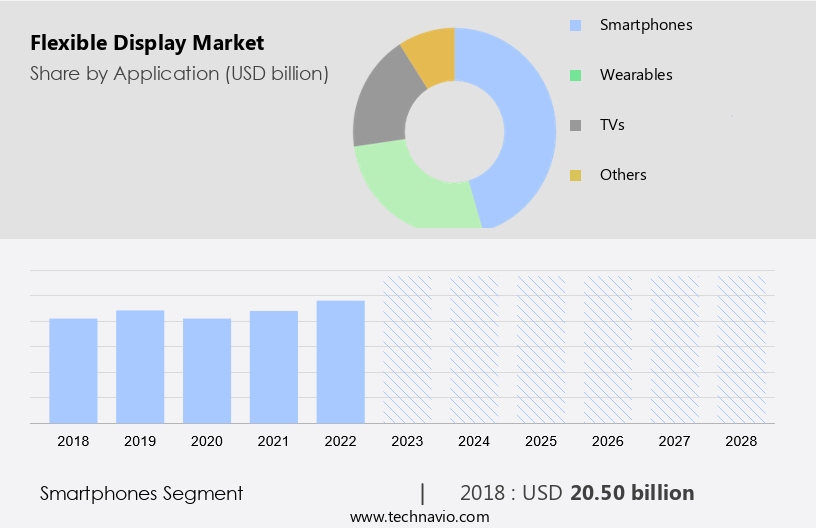
By Application Insights

The smartphones segment is estimated to witness significant growth during the forecast period. The market is experiencing significant growth, particularly in the smartphone segment. This trend is driven by the adoption of plastic and flexible organic light-emitting diode (OLED) displays, such as those made with active-matrix technology. These displays offer advantages over traditional glass panels, including being thinner and lighter. As a result, they enable the production of devices with reduced thickness and weight. In the coming years, it is anticipated that smartphones will become available in foldable and bendable designs. Major players in the industry, including Samsung Electronics Co., Ltd and LG Display Co., Ltd, have recently announced plans to expand their production capacities to meet the increasing demand for these innovative displays.

Furthermore, flexible displays are also gaining traction in other consumer electronics, such as laptops, desktop screens, televisions, and wearables. For instance, OLED technology is increasingly being used in high-end laptops and televisions due to its superior picture quality and energy efficiency. In the wearables segment, flexible displays offer the advantage of being lightweight and flexible, making them ideal for use in smartwatches and other wearable devices. According to industry reports, The market is expected to grow at a steady pace during the forecast period. This growth is attributed to the increasing demand for flexible displays in various applications, as well as advancements in display technology and manufacturing processes.

As the market continues to evolve, it is expected that flexible displays will become increasingly common in a wide range of consumer electronics. In conclusion, the market is poised for significant growth, driven by the adoption of flexible OLED displays in various consumer electronics applications, particularly in smartphones. Major players in the industry are investing in expanding their production capacities to meet the increasing demand for these innovative displays. The market is expected to continue growing due to the advantages offered by flexible displays, such as reduced thickness and weight, as well as advancements in display technology and manufacturing processes.

Flexible Display Market Size

Get a glance at the market share of various segments Request Free Sample

The smartphones segment accounted for USD 20.50 billion in 2018 and showed a gradual increase during the forecast period.

Regional Insights

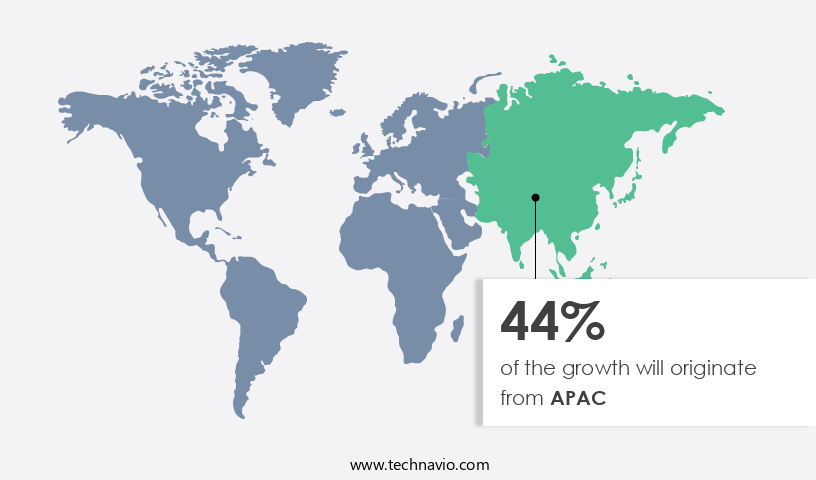
APAC is estimated to contribute 44% to the growth of the global market during the forecast period. Technavio's analysts have elaborately explained the regional trends and drivers that shape the market during the forecast period.

Flexible Display Market Share by Geography

For more insights on the market share of various regions Request Free Sample

In 2023, the Asia Pacific (APAC) region holds a significant share of The market. This dominance can be attributed to the region's established supply chain for display devices and the presence of numerous electronic device manufacturers. South Korea, Japan, Taiwan, and China are home to most of these manufacturers, including those specializing in flat-panel TVs, smartphones, tablets, and wearable devices. The APAC market's leading position is expected to continue during the forecast period. Factors contributing to this include the region's large consumer base and the increasing demand for advanced display technologies. Curved displays and rollable displays are gaining popularity, particularly in the TV and smartphone segments.

Furthermore, e-readers and smartwatches are also embracing flexible displays to offer more ergonomic and portable designs. APAC's market growth can be attributed to the region's manufacturing capabilities and the increasing demand for innovative display technologies. The market is expected to witness substantial growth due to the adoption of these advanced displays in various applications. The market in APAC is a significant contributor to the global market and is expected to maintain its position as a major revenue generator during the forecast period.

Market Dynamics

Our researchers analyzed the data with 2023 as the base year, along with the key drivers, trends, and challenges. A holistic analysis of drivers will help companies refine their marketing strategies to gain a competitive advantage.

Market Driver

Increased R&D investments are the key drivers of the market. The market has witnessed significant investment from corporations' R&D divisions, as the technology remains in its developmental stages and has not yet been commercially scaled. Since the smart devices market experienced substantial growth starting in 2014, companies like LG and Samsung have allocated resources towards R&D of hardware devices, aiming to create more durable, high-quality, and cost-effective displays.

Further, these investments are focused on South Korea and Taiwan to expedite the production of innovative flexible displays, incorporating new features suitable for various hardware applications. The market is poised for growth due to the increasing demand for advanced and versatile displays in various industries, including Automotive & Transportation. The skilled labor force and polymer compound advancements are also contributing factors to the market's expansion. 

Market Trends

The advent of conceptual flexible display products is the upcoming trend in the market. The market is experiencing significant advancements as technology companies explore new applications for this innovative technology. Smartphones and wearable devices are at the forefront of this trend, with manufacturers such as Samsung, Microsoft, and Apple integrating flexible displays into their product offerings. In the realm of gaming, Sony and Microsoft are experimenting with flexible screens for console displays, aiming to enhance the user experience.

Furthermore, the home automation sector is also adopting flexible displays, with companies like TCL CSOT and others introducing OLED and AMOLED Rollable Displays for smart home products. The wearables industry has been instrumental in driving the growth of the market, as manufacturers continue to conceptualize new and innovative products. The integration of flexible displays into various consumer electronics is expected to continue, further expanding the market's potential. 

Market Challenge

Reduced shelf life of products is a key challenge affecting the market growth. Flexible displays have gained significant traction in the market due to their ability to address various challenges posed by traditional displays. However, these displays come with their own setbacks. With continuous advancements in technology, manufacturers are introducing innovative products, rendering older versions less desirable. This dynamic market environment puts pressure on flexible display companies to keep up with the latest technology to remain competitive.

Moreover, the increasing geriatric population in the US presents a unique challenge for the market. The elderly population may have specific temperature requirements for using these displays, which can impact their adoption. Therefore, it is essential for companies to consider these factors while developing new products. Transportation facilities also play a crucial role in the market. The need for lightweight and portable displays in transportation applications is growing. Flexible displays offer a solution to this requirement, making them an attractive option for this sector. In conclusion, the market is witnessing rapid technological advancements, making it essential for companies to stay updated to meet the evolving demands of consumers. Additionally, considering the unique requirements of specific demographics, such as the elderly population, and sectors, such as transportation, can help companies gain a competitive edge.

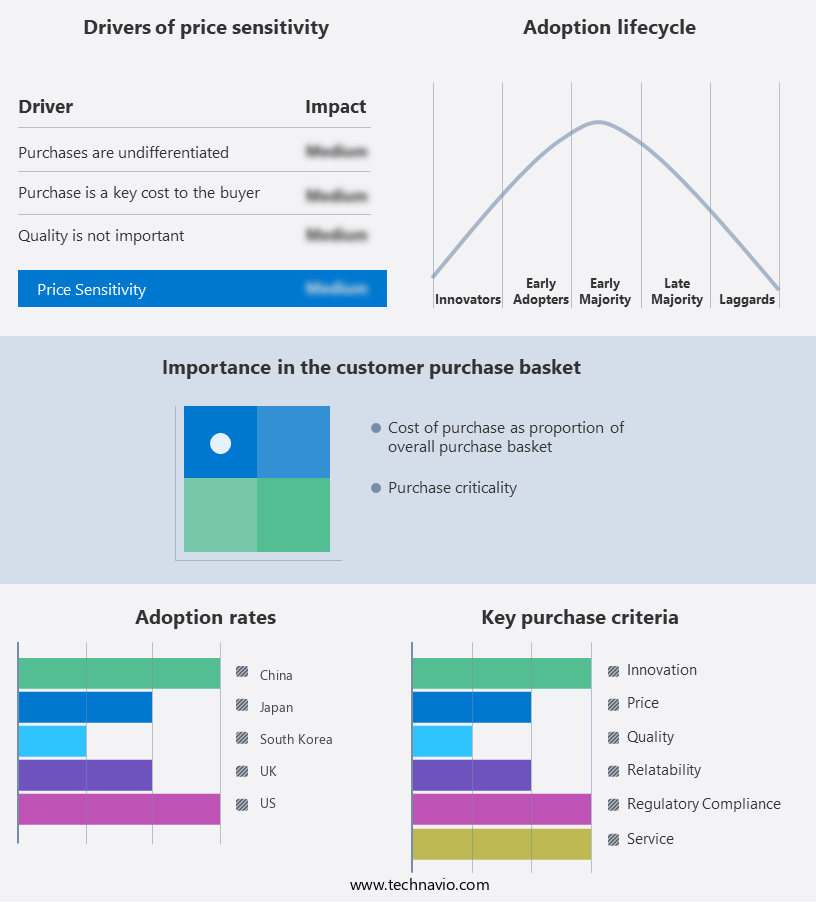
Exclusive Customer Landscape

The market forecasting report includes the adoption lifecycle of the market, covering from the innovator's stage to the laggard's stage. It focuses on adoption rates in different regions based on penetration. Furthermore, the report also includes key purchase criteria and drivers of price sensitivity to help companies evaluate and develop their market growth analysis strategies.

Flexible Display Market Share by Geography

 Customer Landscape

Key Companies & Market Insights

Companies are implementing various strategies, such as strategic alliances, partnerships, mergers and acquisitions, geographical expansion, and product/service launches, to enhance their presence in the market.

AUO Corp: The company offers flexible micro LED display that satisfies the demand of fitting Central Information Display to interior shape with its dual panel, dual curvature stitching into an S shaped CID.

The market research and growth report includes detailed analyses of the competitive landscape of the market and information about key companies, including:

  • BOE Technology Group Co. Ltd.
  • Corning Inc.
  • E Ink Holdings Inc.
  • Hannstar Display Corp.
  • HP Inc.
  • Innolux Corp.
  • Kent Displays Inc.
  • KLA Corp.
  • LG Corp.
  • Microtips Technology Inc.
  • Panasonic Holdings Corp.
  • Pioneer Corp.
  • Plastic Logic HK Ltd.
  • Royole Corp.
  • Samsung Electronics Co. Ltd.
  • Sony Group Corp.
  • TDK Corp.
  • Tianma Microelectronics Co. Ltd.
  • Visionox Co.

Qualitative and quantitative analysis of companies has been conducted to help clients understand the wider business environment as well as the strengths and weaknesses of key market players. Data is qualitatively analyzed to categorize companies as pure play, category-focused, industry-focused, and diversified; it is quantitatively analyzed to categorize companies as dominant, leading, strong, tentative, and weak.

Research Analyst Overview

The market is experiencing significant growth due to the increasing demand for advanced displays in various consumer electronics. Smartphones and wearable devices are leading the charge, with OLED displays, such as Amoled rollable displays, becoming increasingly popular. The smartphone market is expected to continue driving the demand for flexible displays, as manufacturers seek to differentiate their products with innovative designs. Laptops and desktop screens are also adopting flexible OLED screens, while televisions are exploring curved and rollable displays.

Moreover, the market for CIOT, including smart home products, is also expected to contribute to the growth of the market. The supply chain for flexible displays involves a complex network of raw material suppliers, panel manufacturers, and assembly and packaging facilities. The use of polymer compounds, skilled labor force, and advanced transportation facilities are essential in the production of flexible displays. The geriatric population and the automotive & transportation industries are also expected to provide opportunities for growth in the market. The size and share of the market are expected to increase as technology insights continue to drive innovation in the field.

Market Scope

Report Coverage

Details

Page number

154

Base year

2023

Historic period

2018-2022

Forecast period

2024-2028

Growth momentum & CAGR

Accelerate at a CAGR of 10.08%

Market growth 2024-2028

USD 18.5 billion

Market structure

Fragmented

YoY growth 2023-2024(%)

9.0

Regional analysis

APAC, North America, Europe, Middle East and Africa, and South America

Performing market contribution

APAC at 44%

Key countries

US, South Korea, Japan, UK, and China

Competitive landscape

Leading Companies, Market Positioning of Companies, Competitive Strategies, and Industry Risks

Key companies profiled

AUO Corp., BOE Technology Group Co. Ltd., Corning Inc., E Ink Holdings Inc., Hannstar Display Corp., HP Inc., Innolux Corp., Kent Displays Inc., KLA Corp., LG Corp., Microtips Technology Inc., Panasonic Holdings Corp., Pioneer Corp., Plastic Logic HK Ltd., Royole Corp., Samsung Electronics Co. Ltd., Sony Group Corp., TDK Corp., Tianma Microelectronics Co. Ltd., and Visionox Co.

Market dynamics

Parent market analysis, market growth inducers and obstacles, market forecast, fast-growing and slow-growing segment analysis, COVID-19 impact and recovery analysis and future consumer dynamics, market condition analysis for the forecast period

Customization purview

If our market report has not included the data that you are looking for, you can reach out to our analysts and get segments customized.

Request Free Sample

What are the Key Data Covered in this Market Research and Growth Report?

  • CAGR of the market during the forecast period
  • Detailed information on factors that will drive the market growth and forecasting between 2024 and 2028
  • Precise estimation of the size of the market  and its contribution of the market in focus to the parent market
  • Accurate predictions about upcoming market growth and trends and changes in consumer behaviour
  • Growth of the market across APAC, North America, Europe, Middle East and Africa, and South America
  • Thorough analysis of the market's competitive landscape and detailed information about companies
  • Comprehensive analysis of factors that will challenge the growth of market companies

We can help! Our analysts can customize this market research report to meet your requirements. Get in touch

1 Executive Summary

  • 1.1 Market overview
    • Executive Summary - Chart on Market Overview
    • Executive Summary - Data Table on Market Overview
    • Executive Summary - Chart on Global Market Characteristics
    • Executive Summary - Chart on Market by Geography
    • Executive Summary - Chart on Market Segmentation by Application
    • Executive Summary - Chart on Incremental Growth
    • Executive Summary - Data Table on Incremental Growth
    • Executive Summary - Chart on Company Market Positioning

2 Market Landscape

  • 2.1 Market ecosystem
    • Parent Market
    • Data Table on - Parent Market
  • 2.2 Market characteristics
    • Market characteristics analysis
  • 2.3 Value chain analysis
    • Value Chain Analysis

3 Market Sizing

  • 3.1 Market definition
    • Offerings of companies included in the market definition
  • 3.2 Market segment analysis
    • Market segments
  • 3.3 Market size 2023
    • 3.4 Market outlook: Forecast for 2023-2028
      • Chart on Global - Market size and forecast 2023-2028 ($ billion)
      • Data Table on Global - Market size and forecast 2023-2028 ($ billion)
      • Chart on Global Market: Year-over-year growth 2023-2028 (%)
      • Data Table on Global Market: Year-over-year growth 2023-2028 (%)

    4 Historic Market Size

    • 4.1 Global Flexible Display Market 2018 - 2022
      • Historic Market Size - Data Table on Global Flexible Display Market 2018 - 2022 ($ billion)
    • 4.2 Application segment analysis 2018 - 2022
      • Historic Market Size - Application Segment 2018 - 2022 ($ billion)
    • 4.3 Geography segment analysis 2018 - 2022
      • Historic Market Size - Geography Segment 2018 - 2022 ($ billion)
    • 4.4 Country segment analysis 2018 - 2022
      • Historic Market Size - Country Segment 2018 - 2022 ($ billion)

    5 Five Forces Analysis

    • 5.1 Five forces summary
      • Five forces analysis - Comparison between 2023 and 2028
    • 5.2 Bargaining power of buyers
      • Bargaining power of buyers - Impact of key factors 2023 and 2028
    • 5.3 Bargaining power of suppliers
      • Bargaining power of suppliers - Impact of key factors in 2023 and 2028
    • 5.4 Threat of new entrants
      • Threat of new entrants - Impact of key factors in 2023 and 2028
    • 5.5 Threat of substitutes
      • Threat of substitutes - Impact of key factors in 2023 and 2028
    • 5.6 Threat of rivalry
      • Threat of rivalry - Impact of key factors in 2023 and 2028
    • 5.7 Market condition
      • Chart on Market condition - Five forces 2023 and 2028

    6 Market Segmentation by Application

    • 6.1 Market segments
      • Chart on Application - Market share 2023-2028 (%)
      • Data Table on Application - Market share 2023-2028 (%)
    • 6.2 Comparison by Application
      • Chart on Comparison by Application
      • Data Table on Comparison by Application
    • 6.3 Smartphones - Market size and forecast 2023-2028
      • Chart on Smartphones - Market size and forecast 2023-2028 ($ billion)
      • Data Table on Smartphones - Market size and forecast 2023-2028 ($ billion)
      • Chart on Smartphones - Year-over-year growth 2023-2028 (%)
      • Data Table on Smartphones - Year-over-year growth 2023-2028 (%)
    • 6.4 Wearables - Market size and forecast 2023-2028
      • Chart on Wearables - Market size and forecast 2023-2028 ($ billion)
      • Data Table on Wearables - Market size and forecast 2023-2028 ($ billion)
      • Chart on Wearables - Year-over-year growth 2023-2028 (%)
      • Data Table on Wearables - Year-over-year growth 2023-2028 (%)
    • 6.5 TVs - Market size and forecast 2023-2028
      • Chart on TVs - Market size and forecast 2023-2028 ($ billion)
      • Data Table on TVs - Market size and forecast 2023-2028 ($ billion)
      • Chart on TVs - Year-over-year growth 2023-2028 (%)
      • Data Table on TVs - Year-over-year growth 2023-2028 (%)
    • 6.6 Others - Market size and forecast 2023-2028
      • Chart on Others - Market size and forecast 2023-2028 ($ billion)
      • Data Table on Others - Market size and forecast 2023-2028 ($ billion)
      • Chart on Others - Year-over-year growth 2023-2028 (%)
      • Data Table on Others - Year-over-year growth 2023-2028 (%)
    • 6.7 Market opportunity by Application
      • Market opportunity by Application ($ billion)
      • Data Table on Market opportunity by Application ($ billion)

    7 Customer Landscape

    • 7.1 Customer landscape overview
      • Analysis of price sensitivity, lifecycle, customer purchase basket, adoption rates, and purchase criteria

    8 Geographic Landscape

    • 8.1 Geographic segmentation
      • Chart on Market share by geography 2023-2028 (%)
      • Data Table on Market share by geography 2023-2028 (%)
    • 8.2 Geographic comparison
      • Chart on Geographic comparison
      • Data Table on Geographic comparison
    • 8.3 APAC - Market size and forecast 2023-2028
      • Chart on APAC - Market size and forecast 2023-2028 ($ billion)
      • Data Table on APAC - Market size and forecast 2023-2028 ($ billion)
      • Chart on APAC - Year-over-year growth 2023-2028 (%)
      • Data Table on APAC - Year-over-year growth 2023-2028 (%)
    • 8.4 North America - Market size and forecast 2023-2028
      • Chart on North America - Market size and forecast 2023-2028 ($ billion)
      • Data Table on North America - Market size and forecast 2023-2028 ($ billion)
      • Chart on North America - Year-over-year growth 2023-2028 (%)
      • Data Table on North America - Year-over-year growth 2023-2028 (%)
    • 8.5 Europe - Market size and forecast 2023-2028
      • Chart on Europe - Market size and forecast 2023-2028 ($ billion)
      • Data Table on Europe - Market size and forecast 2023-2028 ($ billion)
      • Chart on Europe - Year-over-year growth 2023-2028 (%)
      • Data Table on Europe - Year-over-year growth 2023-2028 (%)
    • 8.6 Middle East and Africa - Market size and forecast 2023-2028
      • Chart on Middle East and Africa - Market size and forecast 2023-2028 ($ billion)
      • Data Table on Middle East and Africa - Market size and forecast 2023-2028 ($ billion)
      • Chart on Middle East and Africa - Year-over-year growth 2023-2028 (%)
      • Data Table on Middle East and Africa - Year-over-year growth 2023-2028 (%)
    • 8.7 South America - Market size and forecast 2023-2028
      • Chart on South America - Market size and forecast 2023-2028 ($ billion)
      • Data Table on South America - Market size and forecast 2023-2028 ($ billion)
      • Chart on South America - Year-over-year growth 2023-2028 (%)
      • Data Table on South America - Year-over-year growth 2023-2028 (%)
    • 8.8 US - Market size and forecast 2023-2028
      • Chart on US - Market size and forecast 2023-2028 ($ billion)
      • Data Table on US - Market size and forecast 2023-2028 ($ billion)
      • Chart on US - Year-over-year growth 2023-2028 (%)
      • Data Table on US - Year-over-year growth 2023-2028 (%)
    • 8.9 South Korea - Market size and forecast 2023-2028
      • Chart on South Korea - Market size and forecast 2023-2028 ($ billion)
      • Data Table on South Korea - Market size and forecast 2023-2028 ($ billion)
      • Chart on South Korea - Year-over-year growth 2023-2028 (%)
      • Data Table on South Korea - Year-over-year growth 2023-2028 (%)
    • 8.10 Japan - Market size and forecast 2023-2028
      • Chart on Japan - Market size and forecast 2023-2028 ($ billion)
      • Data Table on Japan - Market size and forecast 2023-2028 ($ billion)
      • Chart on Japan - Year-over-year growth 2023-2028 (%)
      • Data Table on Japan - Year-over-year growth 2023-2028 (%)
    • 8.11 UK - Market size and forecast 2023-2028
      • Chart on UK - Market size and forecast 2023-2028 ($ billion)
      • Data Table on UK - Market size and forecast 2023-2028 ($ billion)
      • Chart on UK - Year-over-year growth 2023-2028 (%)
      • Data Table on UK - Year-over-year growth 2023-2028 (%)
    • 8.12 China - Market size and forecast 2023-2028
      • Chart on China - Market size and forecast 2023-2028 ($ billion)
      • Data Table on China - Market size and forecast 2023-2028 ($ billion)
      • Chart on China - Year-over-year growth 2023-2028 (%)
      • Data Table on China - Year-over-year growth 2023-2028 (%)
    • 8.13 Market opportunity by geography
      • Market opportunity by geography ($ billion)
      • Data Tables on Market opportunity by geography ($ billion)

    9 Drivers, Challenges, and Opportunity/Restraints

    • 9.1 Market drivers
      • 9.2 Market challenges
        • 9.3 Impact of drivers and challenges
          • Impact of drivers and challenges in 2023 and 2028
        • 9.4 Market opportunities/restraints

          10 Competitive Landscape

          • 10.1 Overview
            • 10.2 Competitive Landscape
              • Overview on criticality of inputs and factors of differentiation
            • 10.3 Landscape disruption
              • Overview on factors of disruption
            • 10.4 Industry risks
              • Impact of key risks on business

            11 Competitive Analysis

            • 11.1 Companies profiled
              • Companies covered
            • 11.2 Market positioning of companies
              • Matrix on companies position and classification
            • 11.3 AUO Corp.
              • AUO Corp. - Overview
              • AUO Corp. - Business segments
              • AUO Corp. - Key news
              • AUO Corp. - Key offerings
              • AUO Corp. - Segment focus
            • 11.4 BOE Technology Group Co. Ltd.
              • BOE Technology Group Co. Ltd. - Overview
              • BOE Technology Group Co. Ltd. - Business segments
              • BOE Technology Group Co. Ltd. - Key offerings
              • BOE Technology Group Co. Ltd. - Segment focus
            • 11.5 E Ink Holdings Inc.
              • E Ink Holdings Inc. - Overview
              • E Ink Holdings Inc. - Business segments
              • E Ink Holdings Inc. - Key news
              • E Ink Holdings Inc. - Key offerings
              • E Ink Holdings Inc. - Segment focus
            • 11.6 HP Inc.
              • HP Inc. - Overview
              • HP Inc. - Business segments
              • HP Inc. - Key news
              • HP Inc. - Key offerings
              • HP Inc. - Segment focus
            • 11.7 Innolux Corp.
              • Innolux Corp. - Overview
              • Innolux Corp. - Product / Service
              • Innolux Corp. - Key offerings
            • 11.8 LG Corp.
              • LG Corp. - Overview
              • LG Corp. - Business segments
              • LG Corp. - Key news
              • LG Corp. - Key offerings
              • LG Corp. - Segment focus
            • 11.9 Royole Corp.
              • Royole Corp. - Overview
              • Royole Corp. - Product / Service
              • Royole Corp. - Key offerings
            • 11.10 Samsung Electronics Co. Ltd.
              • Samsung Electronics Co. Ltd. - Overview
              • Samsung Electronics Co. Ltd. - Business segments
              • Samsung Electronics Co. Ltd. - Key news
              • Samsung Electronics Co. Ltd. - Key offerings
              • Samsung Electronics Co. Ltd. - Segment focus
            • 11.11 Sony Group Corp.
              • Sony Group Corp. - Overview
              • Sony Group Corp. - Business segments
              • Sony Group Corp. - Key news
              • Sony Group Corp. - Key offerings
              • Sony Group Corp. - Segment focus
            • 11.12 Tianma Microelectronics Co. Ltd.
              • Tianma Microelectronics Co. Ltd. - Overview
              • Tianma Microelectronics Co. Ltd. - Product / Service
              • Tianma Microelectronics Co. Ltd. - Key offerings

            12 Appendix

            • 12.1 Scope of the report
              • 12.2 Inclusions and exclusions checklist
                • Inclusions checklist
                • Exclusions checklist
              • 12.3 Currency conversion rates for US$
                • Currency conversion rates for US$
              • 12.4 Research methodology
                • Research methodology
              • 12.5 Data procurement
                • Information sources
              • 12.6 Data validation
                • Data validation
              • 12.7 Validation techniques employed for market sizing
                • Validation techniques employed for market sizing
              • 12.8 Data synthesis
                • Data synthesis
              • 12.9 360 degree market analysis
                • 360 degree market analysis
              • 12.10 List of abbreviations
                • List of abbreviations

              Research Methodology

              Technavio presents a detailed picture of the market by way of study, synthesis, and summation of data from multiple sources. The analysts have presented the various facets of the market with a particular focus on identifying the key industry influencers. The data thus presented is comprehensive, reliable, and the result of extensive research, both primary and secondary.

              INFORMATION SOURCES

              Primary sources

              • Manufacturers and suppliers
              • Channel partners
              • Industry experts
              • Strategic decision makers

              Secondary sources

              • Industry journals and periodicals
              • Government data
              • Financial reports of key industry players
              • Historical data
              • Press releases

              DATA ANALYSIS

              Data Synthesis

              • Collation of data
              • Estimation of key figures
              • Analysis of derived insights

              Data Validation

              • Triangulation with data models
              • Reference against proprietary databases
              • Corroboration with industry experts

              REPORT WRITING

              Qualitative

              • Market drivers
              • Market challenges
              • Market trends
              • Five forces analysis

              Quantitative

              • Market size and forecast
              • Market segmentation
              • Geographical insights
              • Competitive landscape

              Interested in this report?

              Get your sample now to see our research methodology and insights!

              Download Now

              Frequently Asked Questions

              Flexible Display market growth will increase by $ 18.5 bn during 2024-2028 .

              The Flexible Display market is expected to grow at a CAGR of 10.08% during 2024-2028 .

              Flexible Display market is segmented by Application( Smartphones, Wearables, TVs, Others)

              AUO Corp., BOE Technology Group Co. Ltd., Corning Inc., E Ink Holdings Inc., Hannstar Display Corp., HP Inc., Innolux Corp., Kent Displays Inc., KLA Corp., LG Corp., Microtips Technology Inc., Panasonic Holdings Corp., Pioneer Corp., Plastic Logic HK Ltd., Royole Corp., Samsung Electronics Co. Ltd., Sony Group Corp., TDK Corp., Tianma Microelectronics Co. Ltd., Visionox Co. are a few of the key vendors in the Flexible Display market.

              APAC will register the highest growth rate of 44% among the other regions. Therefore, the Flexible Display market in APAC is expected to garner significant business opportunities for the vendors during the forecast period.

              US, South Korea, Japan, UK, China

              • Increased R and D investmentsThe majority of the market revenue comes from the R is the driving factor this market.
              • 65 is the driving factor this market.
              • 65); font-size: 14px"> and D divisions of the end-users is the driving factor this market.
              • as the technology is yet to be commercialized on a large scale and is still in the development stages. Owing to extensive developments in the smart devices market since 2014 is the driving factor this market.
              • corporations have been investing in R is the driving factor this market.
              • 65 is the driving factor this market.
              • 65); font-size: 14px"> and D of hardware devices to come up with screens or displays that are more durable is the driving factor this market.
              • of better quality is the driving factor this market.
              • and cost-efficient. Companies such as LG and Samsung have made R and D investments in South Korea and Taiwan to speed up the availability of new flexible displays with many new features so that they can be used in new hardware devices. Companies such as BASF are making significant investments in multiple countries to ensure the upcoming flexible display market has the required raw materials and all improvements can be made alongside the development of flexible screens. Many companies have entered into partnerships with universities to speed up the innovation of flexible displays. For instance is the driving factor this market.
              • Xerox has partnered with PARC is the driving factor this market.
              • HP has partnered with Arizona State University is the driving factor this market.
              • and Organic User Interfaces has partnered with Human Media Lab. Such factors are expected to propel the growth of the market in focus. is the driving factor this market.

              The Flexible Display market vendors should focus on grabbing business opportunities from the Smartphones segment as it accounted for the largest market share in the base year.