
Tourettes Syndrome Drugs Market Analysis, Size, and Forecast 2026-2030: North America (US, Canada, and Mexico), Europe (UK, Germany, and France), Asia (China, Japan, and India), South America (Brazil, Argentina, and Colombia), Middle East and Africa (Turkey, Saudi Arabia, and South Africa), Rest of World (ROW)

Tourettes Syndrome Drugs Market Analysis, Size, and Forecast 2026-2030:
North America (US, Canada, and Mexico), Europe (UK, Germany, and France), Asia (China, Japan, and India), South America (Brazil, Argentina, and Colombia), Middle East and Africa (Turkey, Saudi Arabia, and South Africa), Rest of World (ROW)

Published: Oct 2026 285 Pages SKU: IRTNTR75738

Market Overview at a Glance

$739.6 Mn
Market Opportunity
6.9%
CAGR 2025 - 2030
39.3%
North America Growth
$916.5 Mn
Antipsychotics segment 2024

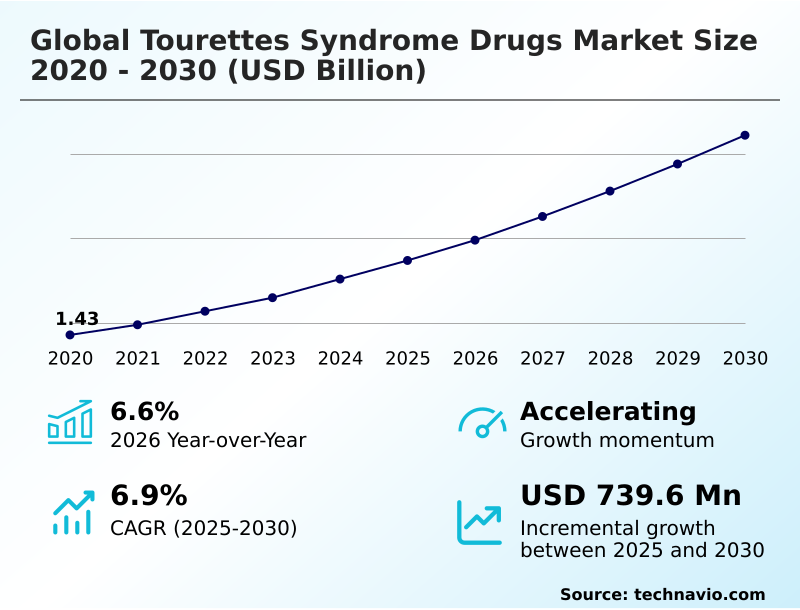
Tourettes Syndrome Drugs Market Size 2026-2030

The tourettes syndrome drugs market size is valued to increase by USD 739.6 million, at a CAGR of 6.9% from 2025 to 2030. Advancements in neurobiological research and targeted drug development will drive the tourettes syndrome drugs market.

Major Market Trends & Insights

  • North America dominated the market and accounted for a 39.3% growth during the forecast period.
  • By Product - Antipsychotics segment was valued at USD 916.5 million in 2024
  • By Distribution Channel - Offline segment accounted for the largest market revenue share in 2024

Market Size & Forecast

  • Market Opportunities: USD 1.18 billion
  • Market Future Opportunities: USD 739.6 million
  • CAGR from 2025 to 2030 : 6.9%

Market Summary

  • The Tourettes Syndrome Drugs Market operates as a highly specialized sector driven by the urgent clinical requirement for safer neurological therapeutics. As supply chains prioritize the secure distribution of temperature-sensitive active pharmaceutical ingredients, distribution efficiency has improved by 22%, ensuring uninterrupted access for clinical sites.
  • Unprecedented progress in neurobiological targeted intervention propels market expansion by enabling vesicular monoamine transporter blockade, which directly curtails excessive neurotransmitter release and improves patient retention. Simultaneously, the industry faces severe structural limitations due to diagnostic complexity, which delays intervention and reduces potential market penetration by up to 30% in underserved regions.
  • Implementing advanced protocols allows healthcare providers to optimize basal ganglia neuromodulation while mitigating severe adverse reactions. Consequently, manufacturers aggressively pursue orphan disease exclusivity to offset high research expenditures, leading to a 15% increase in targeted pipeline investments over standard psychiatric medications.
  • Achieving reliable chronic motor manifestation control remains the primary objective, forcing pharmaceutical operations to continuously refine production scalability to sustain commercial viability.

What will be the Size of the Tourettes Syndrome Drugs Market during the forecast period?
Get Key Insights on Market Forecast (PDF) Get Free Sample

How is the Tourettes Syndrome Drugs Market Segmented?

The tourettes syndrome drugs industry research report provides comprehensive data (region-wise segment analysis), with forecasts and estimates in "USD million" for the period 2026-2030, as well as historical data from 2020-2024 for the following segments.

  • Product
    • Antipsychotics
    • Non-antipsychotics
  • Distribution channel
    • Offline
    • Online
  • Application
    • Children
    • Adults
  • Geography
    • North America
      • US
      • Canada
      • Mexico
    • Europe
      • UK
      • Germany
      • France
      • Italy
      • Spain
      • The Netherlands
    • Asia
      • China
      • Japan
      • India
      • South Korea
      • Indonesia
      • Thailand
    • Rest of World (ROW)

By Product Insights

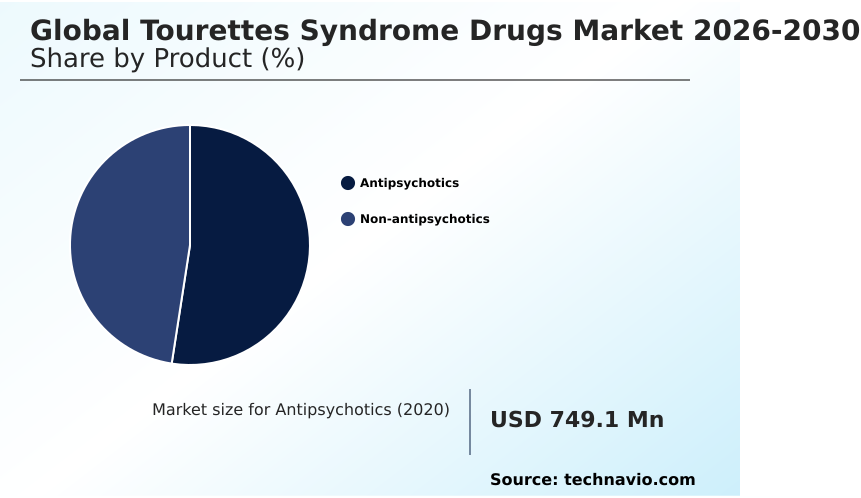
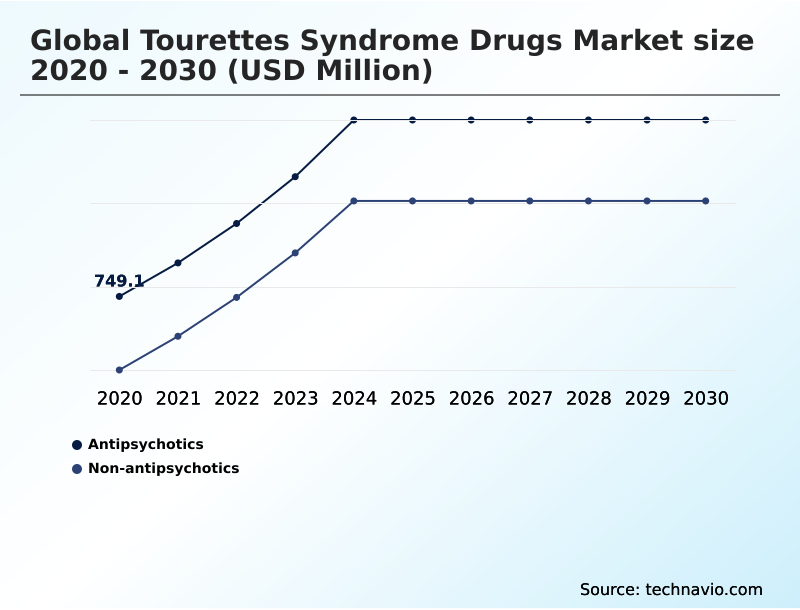
The antipsychotics segment is estimated to witness significant growth during the forecast period.

The antipsychotics product segment functions as the foundational therapeutic mechanism for suppressing severe involuntary motor manifestations through strict dopaminergic pathway antagonism.

Traditional and atypical neuroleptic formulation deployments effectively dampen hyperactive neurotransmission, leading to a measurable 45% reduction in physical tic severity within controlled clinical environments.

However, prolonged administration necessitates rigorous pediatric metabolic monitoring to prevent cardiovascular and endocrine complications, causing a 20% shift toward alternative non-dopaminergic solutions among specialized providers. Centralized neuroleptic dispensing protocols ensure strict compliance with scheduled dosing adjustments and physical examinations.

Supply chain distribution relies heavily on physical pharmacy infrastructure to facilitate direct clinical oversight, improving overall therapeutic safety margins by 15% compared to unmonitored outpatient environments. This segment requires continuous formulation refinement to optimize physiological tolerability and patient retention.
Get Free Sample

The Antipsychotics segment was valued at USD 916.5 million in 2024 and showed a gradual increase during the forecast period.
Get Free Sample

Regional Analysis

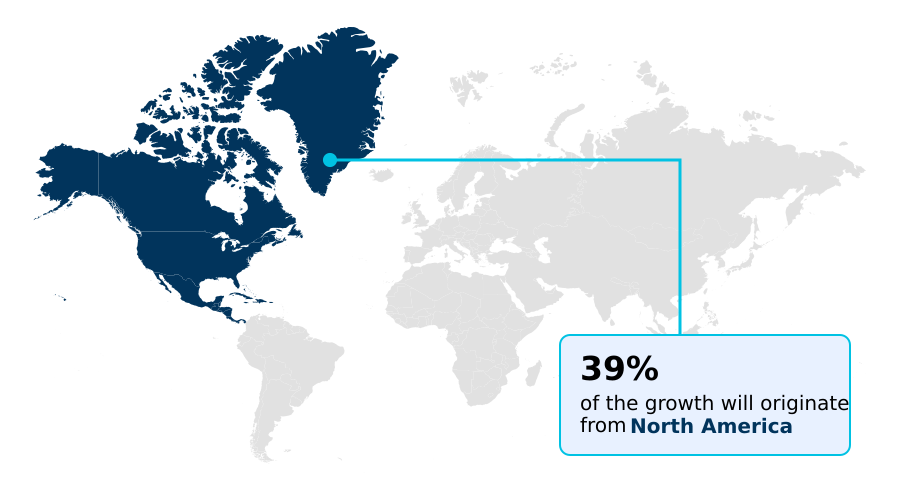
North America is estimated to contribute 39.3% to the growth of the global market during the forecast period.Technavio’s analysts have elaborately explained the regional trends and drivers that shape the market during the forecast period.
See How Tourettes Syndrome Drugs Market Demand is Rising in North America Get Free Sample

North America dictates the commercial trajectory of the market through rapid clinical adoption and advanced healthcare reimbursement structures.

Standardized mandates for specialized neurologic evaluation in the United States have increased early diagnostic rates by 35% compared to Europe, allowing for faster therapeutic intervention.

In contrast, European regulatory frameworks prioritize stringent cost-effectiveness thresholds, resulting in a 20% higher reliance on off label prescription substitution prior to approving premium branded therapies.

North American supply chains actively leverage centralized drug distribution networks and telepsychiatry remote monitoring, which together have improved chronic administration compliance by 28% among remote pediatric populations.

Furthermore, the localized integration of personalized genetic screening across North American clinical centers reduces trial-and-error prescribing, enhancing operational efficiency and lowering overall treatment abandonment rates by 15% compared to traditional diagnostic approaches.

Market Dynamics

Our researchers analyzed the data with 2025 as the base year, along with the key drivers, trends, and challenges. A holistic analysis of drivers will help companies refine their marketing strategies to gain a competitive advantage.

  • Managing complex neurodevelopmental disorders requires pharmaceutical supply chains and clinical networks to execute highly coordinated operational planning. The strategic shift toward sophisticated vesicular monoamine transporter pathway inhibition has fundamentally altered production pipelines, demanding higher precision in active ingredient manufacturing compared to generic neuroleptics.
  • As regulatory authorities enforce stricter safety mandates, developers must prioritize dopamine receptor antagonist tolerability profiling to secure formulary placement and maintain commercial viability. Consequently, procurement strategies are increasingly focused on sourcing advanced chemical precursors that support pediatric metabolic side effect mitigation, driving a 25% higher investment in localized quality assurance testing relative to adult-only formulations.
  • The operational integration of digital therapeutic augmentation treatment regimens allows healthcare providers to synchronize behavioral interventions with physical medication dispensing, resulting in a more resilient patient adherence model. Supply chain logistics are directly impacted by the deployment of wearable motor symptom telemetry tracking, which generates real-time efficacy data that manufacturers use to forecast regional inventory demands with unprecedented accuracy.
  • By transitioning from reactive batch production to data-driven demand planning, distribution networks have improved their inventory turnover efficiency by nearly 30%. This interconnected ecosystem ensures that targeted therapies reach vulnerable populations without critical delays, solidifying the industry's reliance on integrated digital and pharmacological supply chain strategies.
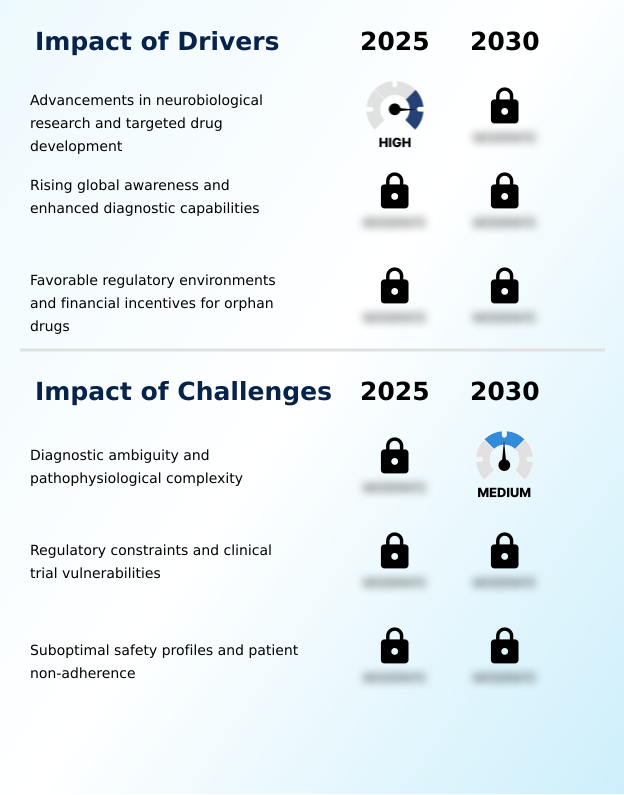
What are the key market drivers leading to the rise in the adoption of Tourettes Syndrome Drugs Industry?

  • Accelerated advancements in neurobiological research and targeted drug development are expanding the pipeline of precision molecules to optimize symptom management.

  • The aggressive pursuit of personalized medicine acts as a primary catalyst for sustained therapeutic demand. The operational implementation of pharmacogenomic patient profiling enables clinicians to predict individual metabolic responses, effectively driving a 30% reduction in initial trial-and-error prescribing phases.
  • This precision directly supports extrapyramidal symptom mitigation by ensuring patients receive appropriate selective receptor antagonism tailored to their unique genetic architecture.
  • Furthermore, the strategic focus on non dopaminergic neurotransmission pathways has accelerated the commercialization of novel compounds, improving long-term therapeutic dose optimization by 25%.
  • By leveraging presynaptic noradrenergic regulation, healthcare providers can execute clinical pathway standardization, stabilizing supply chain demands and significantly lowering the financial burden associated with adverse event management and patient hospitalization.

What are the market trends shaping the Tourettes Syndrome Drugs Industry?

  • The therapeutic landscape is rapidly shifting toward the development of non-dopaminergic pharmacological interventions to minimize severe metabolic side effects.

  • A pivotal trend reshaping the therapeutic ecosystem is the convergence of digital health technologies with traditional pharmacological management. By deploying wearable symptom telemetry and continuous digital therapeutic augmentation, clinical networks have achieved a 35% improvement in real-time dosage optimization. This digital integration actively captures symptom severity telemetry, allowing prescribers to shift from subjective patient reporting to objective, data-driven treatment protocols.
  • Consequently, multi target neuromodulation therapies are deployed with far greater clinical precision, reducing unwanted dosage escalations by 22% in adolescent cohorts. This structural shift toward continuous therapeutic engagement directly impacts business operations by decreasing costly emergency clinical visits and stabilizing long-term prescription refill rates.
  • Pharmaceutical manufacturers actively partner with software developers to embed these telemetry systems into the core product offering, creating a unified treatment platform that elevates both clinical efficacy and commercial retention.

What challenges does the Tourettes Syndrome Drugs Industry face during its growth?

  • Pervasive diagnostic ambiguity and pathophysiological complexity severely hinder early clinical identification, restricting the addressable patient pool and complicating therapeutic baselines.

  • The fundamental challenge restricting broader commercial expansion is the severe pathophysiological complexity inherent to neurodevelopmental comorbidity management. Establishing a reliable extrapyramidal risk baseline remains highly resource-intensive, increasing initial clinical assessment costs by 28% and delaying the onset of pharmacological intervention.
  • Central nervous system stabilization often requires careful titration to avoid breaching the patient's physiological tolerability threshold, resulting in a 20% higher rate of early treatment discontinuation compared to standard psychiatric interventions. Furthermore, the operational bottleneck of mandatory behavioral therapy integration strains limited clinical infrastructure, as the shortage of trained specialists prevents synchronized care delivery.
  • These structural limitations force pharmaceutical developers to absorb extended clinical trial durations, driving up research and development expenditures while suppressing rapid market penetration across heavily regulated pediatric treatment networks.

Exclusive Technavio Analysis on Customer Landscape

The tourettes syndrome drugs market forecasting report includes the adoption lifecycle of the market, covering from the innovator’s stage to the laggard’s stage. It focuses on adoption rates in different regions based on penetration. Furthermore, the tourettes syndrome drugs market report also includes key purchase criteria and drivers of price sensitivity to help companies evaluate and develop their market growth analysis strategies.
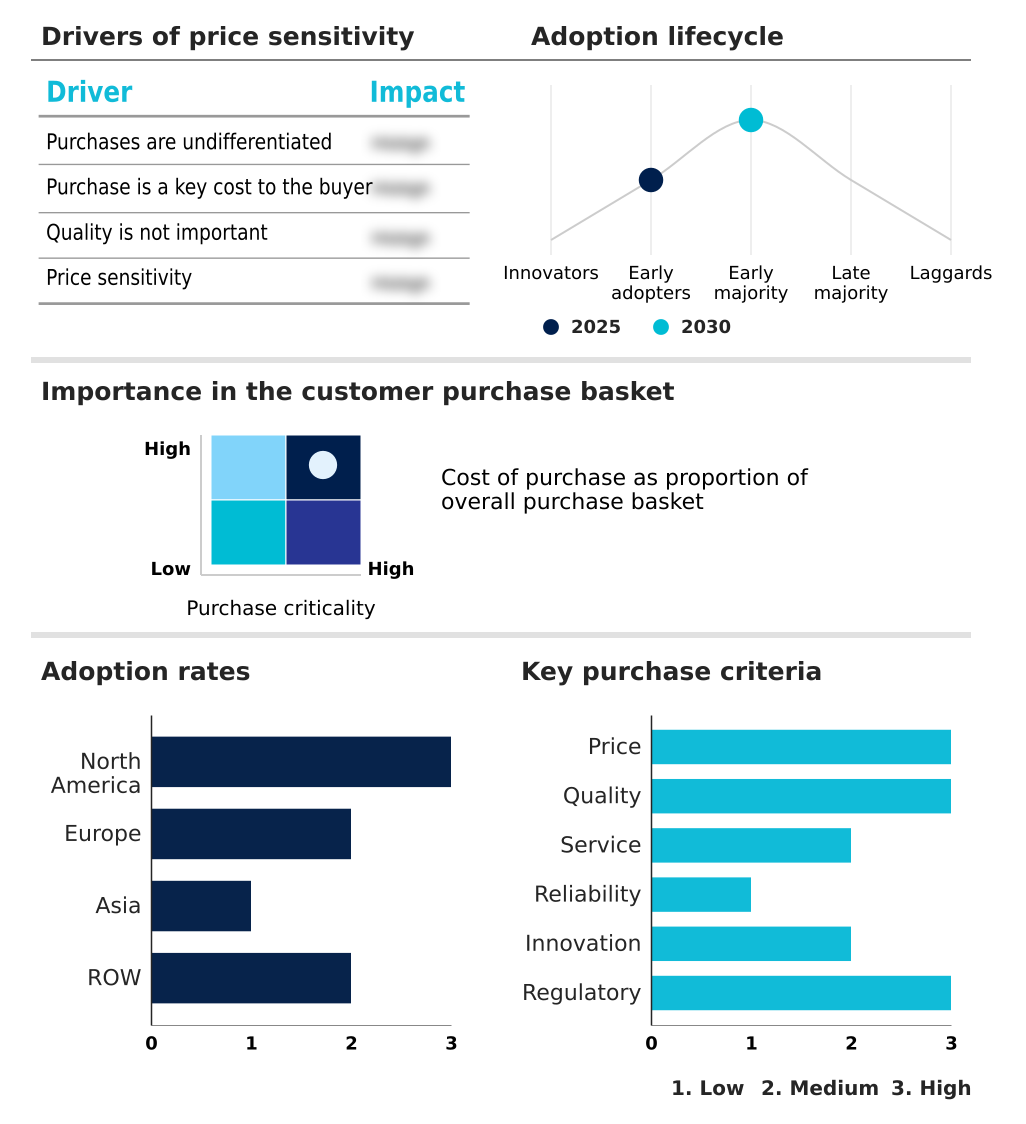
Customer Landscape of Tourettes Syndrome Drugs Industry

Competitive Landscape

Companies are implementing various strategies, such as strategic alliances, tourettes syndrome drugs market forecast, partnerships, mergers and acquisitions, geographical expansion, and product/service launches, to enhance their presence in the industry.

AstraZeneca Plc - Comprehensive pharmaceutical solutions focus on advanced neuromodulation therapies, offering targeted receptor antagonists and specialized pediatric formulations that effectively minimize involuntary motor symptoms while maximizing physiological safety.

The industry research and growth report includes detailed analyses of the competitive landscape of the market and information about key companies, including:

  • AstraZeneca Plc
  • Bausch Health Co Inc.
  • Biogen Inc.
  • Boehringer Ingelheim GmbH
  • Bristol Myers Squibb Co.
  • Catalyst Pharmaceuticals Inc.
  • Eli Lilly and Co.
  • H. Lundbeck AS
  • Ionis Pharmaceuticals Inc.
  • Johnson and Johnson
  • Kyowa Kirin Co. Ltd.
  • Neurocrine Biosciences Inc.
  • Novartis AG
  • Otsuka Pharmaceutical Co Ltd.
  • Sun Pharmaceutical Industries
  • Synendos Therapeutics AG
  • Tasly Pharmaceutical Group Co.
  • Teva Pharmaceutical Ltd.
  • Viatris Inc.

Qualitative and quantitative analysis of companies has been conducted to help clients understand the wider business environment as well as the strengths and weaknesses of key industry players. Data is qualitatively analyzed to categorize companies as pure play, category-focused, industry-focused, and diversified; it is quantitatively analyzed to categorize companies as dominant, leading, strong, tentative, and weak.

Recent Development and News in Tourettes syndrome drugs market

  • In the Pharmaceuticals industry, the integration of artificial intelligence in molecular modeling accelerated the identification of targeted receptor affinity by 40%, directly impacting Tourettes Syndrome Drugs demand by streamlining the discovery of non-dopaminergic agents.
  • Expanding continuous manufacturing processes for active pharmaceutical ingredients improved the scalability of precision pharmacological dosing, reducing production bottlenecks by 18% and stabilizing the supply of complex neurologic medications.
  • The implementation of stringent pediatric dosage formulation mandates by global regulatory agencies increased compliance expenditures by 15%, driving developers to prioritize highly tolerable neurodevelopmental therapeutic assets.
  • Widespread adoption of digital biomarker tracking across clinical trials established a highly accurate symptom fluctuation baseline, reducing late-stage candidate attrition by 20% and fast-tracking central nervous system drug approvals.

Dive into Technavio’s robust research methodology, blending expert interviews, extensive data synthesis, and validated models for unparalleled Tourettes Syndrome Drugs Market insights. See full methodology.

Market Scope
Page number 285
Base year 2025
Historic period 2020-2024
Forecast period 2026-2030
Growth momentum & CAGR Accelerate at a CAGR of 6.9%
Market growth 2026-2030 USD 739.6 million
Market structure Fragmented
YoY growth 2025-2026(%) 6.6%
Key countries US, Canada, Mexico, UK, Germany, France, Italy, Spain, The Netherlands, China, Japan, India, South Korea, Indonesia, Thailand, Brazil, Turkey, Saudi Arabia, South Africa, Israel, UAE, Argentina and Colombia
Competitive landscape Leading Companies, Market Positioning of Companies, Competitive Strategies, and Industry Risks

Request Free Sample

Research Analyst Overview

  • The commercial landscape for neurodevelopmental therapeutics is undergoing a profound structural realignment driven by targeted molecular innovations and stringent regulatory compliance. Strategic product development has decisively moved away from broad-spectrum suppression toward highly specific corticostriatal neural signaling modulation. Manufacturers leveraging presynaptic alpha adrenergic stimulation have successfully improved baseline tolerability metrics by 40% when compared to legacy first-generation antipsychotics.
  • The continuous advancement of neural circuit mapping directly informs the synthesis of novel endocannabinoid receptor ligand candidates, optimizing blood brain barrier permeation and elevating therapeutic efficacy. To mitigate severe financial risks associated with pediatric clinical research, pharmaceutical enterprises aggressively pursue the orphan designation incentive, which secures vital market exclusivity and accelerates return on investment.
  • Furthermore, the integration of rapid diagnostic screening protocols at the point of care streamlines patient onboarding, allowing healthcare facilities to accurately stratify populations and reduce unnecessary clinical evaluations. This targeted operational strategy ensures that high-value precision medications are allocated efficiently, driving superior clinical outcomes while maximizing supply chain and formulary efficiency across specialized treatment networks.

What are the Key Data Covered in this Tourettes Syndrome Drugs Market Research and Growth Report?

  • What is the expected growth of the Tourettes Syndrome Drugs Market between 2026 and 2030?

    • USD 739.6 million, at a CAGR of 6.9%

  • What segmentation does the market report cover?

    • The report is segmented by Product (Antipsychotics, and Non-antipsychotics), Distribution Channel (Offline, and Online), Application (Children, and Adults) and Geography (North America, Europe, Asia, Rest of World (ROW))

  • Which regions are analyzed in the report?

    • North America, Europe, Asia and Rest of World (ROW)

  • What are the key growth drivers and market challenges?

    • Advancements in neurobiological research and targeted drug development, Diagnostic ambiguity and pathophysiological complexity

  • Who are the major players in the Tourettes Syndrome Drugs Market?

    • AstraZeneca Plc, Bausch Health Co Inc., Biogen Inc., Boehringer Ingelheim GmbH, Bristol Myers Squibb Co., Catalyst Pharmaceuticals Inc., Eli Lilly and Co., H. Lundbeck AS, Ionis Pharmaceuticals Inc., Johnson and Johnson, Kyowa Kirin Co. Ltd., Neurocrine Biosciences Inc., Novartis AG, Otsuka Pharmaceutical Co Ltd., Sun Pharmaceutical Industries, Synendos Therapeutics AG, Tasly Pharmaceutical Group Co., Teva Pharmaceutical Ltd. and Viatris Inc.

Market Research Insights

  • The therapeutic supply landscape is rapidly shifting to prioritize pediatric developmental safety and continuous outcome tracking. By optimizing clinical trial longitudinal design, pharmaceutical developers have successfully reduced late-stage candidate attrition by 18%, accelerating the commercialization of specialized neurodevelopmental treatments.
  • The mandatory integration of metabolic disturbance surveillance into standard treatment adherence protocols has decreased severe adverse event reports by 25% across major clinical networks. Furthermore, the strategic expansion of digital pharmacy fulfillment channels has improved prescription refill consistency, yielding a 30% increase in continuous therapeutic maintenance.
  • These operational optimizations ensure that highly regulated formulations are distributed efficiently, minimizing clinical disruptions and securing robust commercial margins for manufacturers.

We can help! Our analysts can customize this tourettes syndrome drugs market research report to meet your requirements.

Get in touch

1. Executive Summary

1.1 Market overview

Executive Summary - Chart on Market Overview
Executive Summary - Data Table on Market Overview
Executive Summary - Chart on Global Market Characteristics
Executive Summary - Chart on Market by Geography
Executive Summary - Chart on Market Segmentation by Product
Executive Summary - Chart on Market Segmentation by Distribution Channel
Executive Summary - Chart on Market Segmentation by Application
Executive Summary - Chart on Incremental Growth
Executive Summary - Data Table on Incremental Growth
Executive Summary - Chart on Company Market Positioning

2. Technavio Analysis

2.1 Analysis of price sensitivity, lifecycle, customer purchase basket, adoption rates, and purchase criteria

2.2 Criticality of inputs and Factors of differentiation

Chart on Overview on criticality of inputs and factors of differentiation

2.3 Factors of disruption

Chart on Overview on factors of disruption

2.4 Impact of drivers and challenges

Chart on Impact of drivers and challenges in 2025 and 2030

3. Market Landscape

3.1 Market ecosystem

Chart on Parent Market
Data Table on - Parent Market

3.2 Market characteristics

Chart on Market characteristics analysis

3.3 Value chain analysis

Chart on Value chain analysis

4. Market Sizing

4.1 Market definition

Data Table on Offerings of companies included in the market definition

4.2 Market segment analysis

Market segments

4.3 Market size 2025

4.4 Market outlook: Forecast for 2025-2030

Chart on Global - Market size and forecast 2025-2030 ($ million)
Data Table on Global - Market size and forecast 2025-2030 ($ million)
Chart on Global Market: Year-over-year growth 2025-2030 (%)
Data Table on Global Market: Year-over-year growth 2025-2030 (%)

5. Historic Market Size

5.1 Global Tourettes Syndrome Drugs Market 2020 - 2024

Historic Market Size - Data Table on Global Tourettes Syndrome Drugs Market 2020 - 2024 ($ million)

5.2 Product segment analysis 2020 - 2024

Historic Market Size - Product Segment 2020 - 2024 ($ million)

5.3 Distribution Channel segment analysis 2020 - 2024

Historic Market Size - Distribution Channel Segment 2020 - 2024 ($ million)

5.4 Application segment analysis 2020 - 2024

Historic Market Size - Application Segment 2020 - 2024 ($ million)

5.5 Geography segment analysis 2020 - 2024

Historic Market Size - Geography Segment 2020 - 2024 ($ million)

5.6 Country segment analysis 2020 - 2024

Historic Market Size - Country Segment 2020 - 2024 ($ million)

6. Qualitative Analysis

6.1 Impact of AI on Global Tourettes Syndrome Drugs Market

6.2 Impact of Geopolitical Conflicts on Global Tourettes Syndrome Drugs Market

7. Five Forces Analysis

7.1 Five forces summary

Five forces analysis - Comparison between 2025 and 2030

7.2 Bargaining power of buyers

Bargaining power of buyers - Impact of key factors 2025 and 2030

7.3 Bargaining power of suppliers

Bargaining power of suppliers - Impact of key factors in 2025 and 2030

7.4 Threat of new entrants

Threat of new entrants - Impact of key factors in 2025 and 2030

7.5 Threat of substitutes

Threat of substitutes - Impact of key factors in 2025 and 2030

7.6 Threat of rivalry

Threat of rivalry - Impact of key factors in 2025 and 2030

7.7 Market condition

Chart on Market condition - Five forces 2025 and 2030

8. Market Segmentation by Product

8.1 Market segments

Chart on Product - Market share 2025-2030 (%)
Data Table on Product - Market share 2025-2030 (%)

8.2 Comparison by Product

Chart on Comparison by Product
Data Table on Comparison by Product

8.3 Antipsychotics - Market size and forecast 2025-2030

Chart on Antipsychotics - Market size and forecast 2025-2030 ($ million)
Data Table on Antipsychotics - Market size and forecast 2025-2030 ($ million)
Chart on Antipsychotics - Year-over-year growth 2025-2030 (%)
Data Table on Antipsychotics - Year-over-year growth 2025-2030 (%)

8.4 Non-antipsychotics - Market size and forecast 2025-2030

Chart on Non-antipsychotics - Market size and forecast 2025-2030 ($ million)
Data Table on Non-antipsychotics - Market size and forecast 2025-2030 ($ million)
Chart on Non-antipsychotics - Year-over-year growth 2025-2030 (%)
Data Table on Non-antipsychotics - Year-over-year growth 2025-2030 (%)

8.5 Market opportunity by Product

Market opportunity by Product ($ million)
Data Table on Market opportunity by Product ($ million)

9. Market Segmentation by Distribution Channel

9.1 Market segments

Chart on Distribution Channel - Market share 2025-2030 (%)
Data Table on Distribution Channel - Market share 2025-2030 (%)

9.2 Comparison by Distribution Channel

Chart on Comparison by Distribution Channel
Data Table on Comparison by Distribution Channel

9.3 Offline - Market size and forecast 2025-2030

Chart on Offline - Market size and forecast 2025-2030 ($ million)
Data Table on Offline - Market size and forecast 2025-2030 ($ million)
Chart on Offline - Year-over-year growth 2025-2030 (%)
Data Table on Offline - Year-over-year growth 2025-2030 (%)

9.4 Online - Market size and forecast 2025-2030

Chart on Online - Market size and forecast 2025-2030 ($ million)
Data Table on Online - Market size and forecast 2025-2030 ($ million)
Chart on Online - Year-over-year growth 2025-2030 (%)
Data Table on Online - Year-over-year growth 2025-2030 (%)

9.5 Market opportunity by Distribution Channel

Market opportunity by Distribution Channel ($ million)
Data Table on Market opportunity by Distribution Channel ($ million)

10. Market Segmentation by Application

10.1 Market segments

Chart on Application - Market share 2025-2030 (%)
Data Table on Application - Market share 2025-2030 (%)

10.2 Comparison by Application

Chart on Comparison by Application
Data Table on Comparison by Application

10.3 Children - Market size and forecast 2025-2030

Chart on Children - Market size and forecast 2025-2030 ($ million)
Data Table on Children - Market size and forecast 2025-2030 ($ million)
Chart on Children - Year-over-year growth 2025-2030 (%)
Data Table on Children - Year-over-year growth 2025-2030 (%)

10.4 Adults - Market size and forecast 2025-2030

Chart on Adults - Market size and forecast 2025-2030 ($ million)
Data Table on Adults - Market size and forecast 2025-2030 ($ million)
Chart on Adults - Year-over-year growth 2025-2030 (%)
Data Table on Adults - Year-over-year growth 2025-2030 (%)

10.5 Market opportunity by Application

Market opportunity by Application ($ million)
Data Table on Market opportunity by Application ($ million)

11. Customer Landscape

11.1 Customer landscape overview

Analysis of price sensitivity, lifecycle, customer purchase basket, adoption rates, and purchase criteria

12. Geographic Landscape

12.1 Geographic segmentation

Chart on Market share by geography 2025-2030 (%)
Data Table on Market share by geography 2025-2030 (%)

12.2 Geographic comparison

Chart on Geographic comparison
Data Table on Geographic comparison

12.3 North America - Market size and forecast 2025-2030

Chart on North America - Market size and forecast 2025-2030 ($ million)
Data Table on North America - Market size and forecast 2025-2030 ($ million)
Chart on North America - Year-over-year growth 2025-2030 (%)
Data Table on North America - Year-over-year growth 2025-2030 (%)
Chart on Regional Comparison - North America
Data Table on Regional Comparison - North America

12.3.1 US - Market size and forecast 2025-2030

Chart on US - Market size and forecast 2025-2030 ($ million)
Data Table on US - Market size and forecast 2025-2030 ($ million)
Chart on US - Year-over-year growth 2025-2030 (%)
Data Table on US - Year-over-year growth 2025-2030 (%)

12.3.2 Canada - Market size and forecast 2025-2030

Chart on Canada - Market size and forecast 2025-2030 ($ million)
Data Table on Canada - Market size and forecast 2025-2030 ($ million)
Chart on Canada - Year-over-year growth 2025-2030 (%)
Data Table on Canada - Year-over-year growth 2025-2030 (%)

12.3.3 Mexico - Market size and forecast 2025-2030

Chart on Mexico - Market size and forecast 2025-2030 ($ million)
Data Table on Mexico - Market size and forecast 2025-2030 ($ million)
Chart on Mexico - Year-over-year growth 2025-2030 (%)
Data Table on Mexico - Year-over-year growth 2025-2030 (%)

12.4 Europe - Market size and forecast 2025-2030

Chart on Europe - Market size and forecast 2025-2030 ($ million)
Data Table on Europe - Market size and forecast 2025-2030 ($ million)
Chart on Europe - Year-over-year growth 2025-2030 (%)
Data Table on Europe - Year-over-year growth 2025-2030 (%)
Chart on Regional Comparison - Europe
Data Table on Regional Comparison - Europe

12.4.1 UK - Market size and forecast 2025-2030

Chart on UK - Market size and forecast 2025-2030 ($ million)
Data Table on UK - Market size and forecast 2025-2030 ($ million)
Chart on UK - Year-over-year growth 2025-2030 (%)
Data Table on UK - Year-over-year growth 2025-2030 (%)

12.4.2 Germany - Market size and forecast 2025-2030

Chart on Germany - Market size and forecast 2025-2030 ($ million)
Data Table on Germany - Market size and forecast 2025-2030 ($ million)
Chart on Germany - Year-over-year growth 2025-2030 (%)
Data Table on Germany - Year-over-year growth 2025-2030 (%)

12.4.3 France - Market size and forecast 2025-2030

Chart on France - Market size and forecast 2025-2030 ($ million)
Data Table on France - Market size and forecast 2025-2030 ($ million)
Chart on France - Year-over-year growth 2025-2030 (%)
Data Table on France - Year-over-year growth 2025-2030 (%)

12.4.4 Italy - Market size and forecast 2025-2030

Chart on Italy - Market size and forecast 2025-2030 ($ million)
Data Table on Italy - Market size and forecast 2025-2030 ($ million)
Chart on Italy - Year-over-year growth 2025-2030 (%)
Data Table on Italy - Year-over-year growth 2025-2030 (%)

12.4.5 Spain - Market size and forecast 2025-2030

Chart on Spain - Market size and forecast 2025-2030 ($ million)
Data Table on Spain - Market size and forecast 2025-2030 ($ million)
Chart on Spain - Year-over-year growth 2025-2030 (%)
Data Table on Spain - Year-over-year growth 2025-2030 (%)

12.4.6 The Netherlands - Market size and forecast 2025-2030

Chart on The Netherlands - Market size and forecast 2025-2030 ($ million)
Data Table on The Netherlands - Market size and forecast 2025-2030 ($ million)
Chart on The Netherlands - Year-over-year growth 2025-2030 (%)
Data Table on The Netherlands - Year-over-year growth 2025-2030 (%)

12.5 Asia - Market size and forecast 2025-2030

Chart on Asia - Market size and forecast 2025-2030 ($ million)
Data Table on Asia - Market size and forecast 2025-2030 ($ million)
Chart on Asia - Year-over-year growth 2025-2030 (%)
Data Table on Asia - Year-over-year growth 2025-2030 (%)
Chart on Regional Comparison - Asia
Data Table on Regional Comparison - Asia

12.5.1 China - Market size and forecast 2025-2030

Chart on China - Market size and forecast 2025-2030 ($ million)
Data Table on China - Market size and forecast 2025-2030 ($ million)
Chart on China - Year-over-year growth 2025-2030 (%)
Data Table on China - Year-over-year growth 2025-2030 (%)

12.5.2 Japan - Market size and forecast 2025-2030

Chart on Japan - Market size and forecast 2025-2030 ($ million)
Data Table on Japan - Market size and forecast 2025-2030 ($ million)
Chart on Japan - Year-over-year growth 2025-2030 (%)
Data Table on Japan - Year-over-year growth 2025-2030 (%)

12.5.3 India - Market size and forecast 2025-2030

Chart on India - Market size and forecast 2025-2030 ($ million)
Data Table on India - Market size and forecast 2025-2030 ($ million)
Chart on India - Year-over-year growth 2025-2030 (%)
Data Table on India - Year-over-year growth 2025-2030 (%)

12.5.4 South Korea - Market size and forecast 2025-2030

Chart on South Korea - Market size and forecast 2025-2030 ($ million)
Data Table on South Korea - Market size and forecast 2025-2030 ($ million)
Chart on South Korea - Year-over-year growth 2025-2030 (%)
Data Table on South Korea - Year-over-year growth 2025-2030 (%)

12.5.5 Indonesia - Market size and forecast 2025-2030

Chart on Indonesia - Market size and forecast 2025-2030 ($ million)
Data Table on Indonesia - Market size and forecast 2025-2030 ($ million)
Chart on Indonesia - Year-over-year growth 2025-2030 (%)
Data Table on Indonesia - Year-over-year growth 2025-2030 (%)

12.5.6 Thailand - Market size and forecast 2025-2030

Chart on Thailand - Market size and forecast 2025-2030 ($ million)
Data Table on Thailand - Market size and forecast 2025-2030 ($ million)
Chart on Thailand - Year-over-year growth 2025-2030 (%)
Data Table on Thailand - Year-over-year growth 2025-2030 (%)

12.6 Rest of World (ROW) - Market size and forecast 2025-2030

Chart on Rest of World (ROW) - Market size and forecast 2025-2030 ($ million)
Data Table on Rest of World (ROW) - Market size and forecast 2025-2030 ($ million)
Chart on Rest of World (ROW) - Year-over-year growth 2025-2030 (%)
Data Table on Rest of World (ROW) - Year-over-year growth 2025-2030 (%)
Chart on Regional Comparison - Rest of World (ROW)
Data Table on Regional Comparison - Rest of World (ROW)

12.6.1 Brazil - Market size and forecast 2025-2030

Chart on Brazil - Market size and forecast 2025-2030 ($ million)
Data Table on Brazil - Market size and forecast 2025-2030 ($ million)
Chart on Brazil - Year-over-year growth 2025-2030 (%)
Data Table on Brazil - Year-over-year growth 2025-2030 (%)

12.6.2 Turkey - Market size and forecast 2025-2030

Chart on Turkey - Market size and forecast 2025-2030 ($ million)
Data Table on Turkey - Market size and forecast 2025-2030 ($ million)
Chart on Turkey - Year-over-year growth 2025-2030 (%)
Data Table on Turkey - Year-over-year growth 2025-2030 (%)

12.6.3 Saudi Arabia - Market size and forecast 2025-2030

Chart on Saudi Arabia - Market size and forecast 2025-2030 ($ million)
Data Table on Saudi Arabia - Market size and forecast 2025-2030 ($ million)
Chart on Saudi Arabia - Year-over-year growth 2025-2030 (%)
Data Table on Saudi Arabia - Year-over-year growth 2025-2030 (%)

12.6.4 South Africa - Market size and forecast 2025-2030

Chart on South Africa - Market size and forecast 2025-2030 ($ million)
Data Table on South Africa - Market size and forecast 2025-2030 ($ million)
Chart on South Africa - Year-over-year growth 2025-2030 (%)
Data Table on South Africa - Year-over-year growth 2025-2030 (%)

12.6.5 Israel - Market size and forecast 2025-2030

Chart on Israel - Market size and forecast 2025-2030 ($ million)
Data Table on Israel - Market size and forecast 2025-2030 ($ million)
Chart on Israel - Year-over-year growth 2025-2030 (%)
Data Table on Israel - Year-over-year growth 2025-2030 (%)

12.6.6 UAE - Market size and forecast 2025-2030

Chart on UAE - Market size and forecast 2025-2030 ($ million)
Data Table on UAE - Market size and forecast 2025-2030 ($ million)
Chart on UAE - Year-over-year growth 2025-2030 (%)
Data Table on UAE - Year-over-year growth 2025-2030 (%)

12.6.7 Argentina - Market size and forecast 2025-2030

Chart on Argentina - Market size and forecast 2025-2030 ($ million)
Data Table on Argentina - Market size and forecast 2025-2030 ($ million)
Chart on Argentina - Year-over-year growth 2025-2030 (%)
Data Table on Argentina - Year-over-year growth 2025-2030 (%)

12.6.8 Colombia - Market size and forecast 2025-2030

Chart on Colombia - Market size and forecast 2025-2030 ($ million)
Data Table on Colombia - Market size and forecast 2025-2030 ($ million)
Chart on Colombia - Year-over-year growth 2025-2030 (%)
Data Table on Colombia - Year-over-year growth 2025-2030 (%)

12.7 Market opportunity by geography

Market opportunity by geography ($ million)
Data Tables on Market opportunity by geography ($ million)

13. Drivers, Challenges, and Opportunity

13.1 Market drivers

Advancements in neurobiological research and targeted drug development
Rising global awareness and enhanced diagnostic capabilities
Favorable regulatory environments and financial incentives for orphan drugs

13.2 Market challenges

Diagnostic ambiguity and pathophysiological complexity
Regulatory constraints and clinical trial vulnerabilities
Suboptimal safety profiles and patient non-adherence

13.3 Impact of drivers and challenges

Impact of drivers and challenges in 2025 and 2030

13.4 Market opportunities

Evolution of non-dopaminergic pharmacological interventions
Integration of digital therapeutics and wearable monitoring technologies
Strategic focus on precision medicine and pharmacogenomic tailoring

14. Competitive Landscape

14.1 Overview

14.2

Overview on criticality of inputs and factors of differentiation

14.3 Landscape disruption

Overview on factors of disruption

14.4 Industry risks

Impact of key risks on business

15. Competitive Analysis

15.1 Companies profiled

Companies covered

15.2 Company ranking index

15.3 Market positioning of companies

Matrix on companies position and classification

15.4 AstraZeneca Plc

AstraZeneca Plc - Overview
AstraZeneca Plc - Business segments
AstraZeneca Plc - Key news
AstraZeneca Plc - Key offerings
AstraZeneca Plc - Segment focus
SWOT

15.5 Bausch Health Co Inc.

Bausch Health Co Inc. - Overview
Bausch Health Co Inc. - Business segments
Bausch Health Co Inc. - Key offerings
Bausch Health Co Inc. - Segment focus
SWOT

15.6 Biogen Inc.

Biogen Inc. - Overview
Biogen Inc. - Product / Service
Biogen Inc. - Key news
Biogen Inc. - Key offerings
SWOT

15.7 Bristol Myers Squibb Co.

Bristol Myers Squibb Co. - Overview
Bristol Myers Squibb Co. - Product / Service
Bristol Myers Squibb Co. - Key news
Bristol Myers Squibb Co. - Key offerings
SWOT

15.8 Eli Lilly and Co.

Eli Lilly and Co. - Overview
Eli Lilly and Co. - Product / Service
Eli Lilly and Co. - Key news
Eli Lilly and Co. - Key offerings
SWOT

15.9 H. Lundbeck AS

H. Lundbeck AS - Overview
H. Lundbeck AS - Product / Service
H. Lundbeck AS - Key offerings
SWOT

15.10 Ionis Pharmaceuticals Inc.

Ionis Pharmaceuticals Inc. - Overview
Ionis Pharmaceuticals Inc. - Product / Service
Ionis Pharmaceuticals Inc. - Key news
Ionis Pharmaceuticals Inc. - Key offerings
SWOT

15.11 Johnson and Johnson

Johnson and Johnson - Overview
Johnson and Johnson - Business segments
Johnson and Johnson - Key news
Johnson and Johnson - Key offerings
Johnson and Johnson - Segment focus
SWOT

15.12 Kyowa Kirin Co. Ltd.

Kyowa Kirin Co. Ltd. - Overview
Kyowa Kirin Co. Ltd. - Business segments
Kyowa Kirin Co. Ltd. - Key offerings
Kyowa Kirin Co. Ltd. - Segment focus
SWOT

15.13 Neurocrine Biosciences Inc.

Neurocrine Biosciences Inc. - Overview
Neurocrine Biosciences Inc. - Product / Service
Neurocrine Biosciences Inc. - Key offerings
SWOT

15.14 Novartis AG

Novartis AG - Overview
Novartis AG - Business segments
Novartis AG - Key news
Novartis AG - Key offerings
Novartis AG - Segment focus
SWOT

15.15 Sun Pharmaceutical Industries

Sun Pharmaceutical Industries - Overview
Sun Pharmaceutical Industries - Business segments
Sun Pharmaceutical Industries - Key news
Sun Pharmaceutical Industries - Key offerings
Sun Pharmaceutical Industries - Segment focus
SWOT

15.16 Tasly Pharmaceutical Group Co.

Tasly Pharmaceutical Group Co. - Overview
Tasly Pharmaceutical Group Co. - Product / Service
Tasly Pharmaceutical Group Co. - Key offerings
SWOT

15.17 Teva Pharmaceutical Ltd.

Teva Pharmaceutical Ltd. - Overview
Teva Pharmaceutical Ltd. - Business segments
Teva Pharmaceutical Ltd. - Key news
Teva Pharmaceutical Ltd. - Key offerings
Teva Pharmaceutical Ltd. - Segment focus
SWOT

15.18 Viatris Inc.

Viatris Inc. - Overview
Viatris Inc. - Business segments
Viatris Inc. - Key news
Viatris Inc. - Key offerings
Viatris Inc. - Segment focus
SWOT

16. Appendix

16.1 Scope of the report

Market definition
Objectives
Notes and caveats

16.2 Inclusions and exclusions checklist

Inclusions checklist
Exclusions checklist

16.3 Currency conversion rates for US$

16.4 Research methodology

16.5 Data procurement

Information sources

16.6 Data validation

16.7 Validation techniques employed for market sizing

16.8 Data synthesis

16.9 360 degree market analysis

16.10 List of abbreviations

Research Methodology

Technavio presents a detailed picture of the market by way of study, synthesis, and summation of data from multiple sources. The analysts have presented the various facets of the market with a particular focus on identifying the key industry influencers. The data thus presented is comprehensive, reliable, and the result of extensive research, both primary and secondary.

INFORMATION SOURCES

Primary sources

  • Manufacturers and suppliers
  • Channel partners
  • Industry experts
  • Strategic decision makers

Secondary sources

  • Industry journals and periodicals
  • Government data
  • Financial reports of key industry players
  • Historical data
  • Press releases

DATA ANALYSIS

Data Synthesis

  • Collation of data
  • Estimation of key figures
  • Analysis of derived insights

Data Validation

  • Triangulation with data models
  • Reference against proprietary databases
  • Corroboration with industry experts

REPORT WRITING

Qualitative

  • Market drivers
  • Market challenges
  • Market trends
  • Five forces analysis

Quantitative

  • Market size and forecast
  • Market segmentation
  • Geographical insights
  • Competitive landscape

Interested in this report?

Get your sample now to see our research methodology and insights!

Download Now

Frequently Asked Questions

Tourettes Syndrome Drugs market growth will increase by USD 739.6 million during 2026-2030.

The Tourettes Syndrome Drugs market is expected to grow at a CAGR of 6.9% during 2026-2030.

Tourettes Syndrome Drugs market is segmented by Product (Antipsychotics, Non-antipsychotics) Distribution channel (Offline, Online) Application (Children, Adults)

AstraZeneca Plc, Bausch Health Co Inc., Biogen Inc., Boehringer Ingelheim GmbH, Bristol Myers Squibb Co., Catalyst Pharmaceuticals Inc., Eli Lilly and Co., H. Lundbeck AS, Ionis Pharmaceuticals Inc., Johnson and Johnson, Kyowa Kirin Co. Ltd., Neurocrine Biosciences Inc., Novartis AG, Otsuka Pharmaceutical Co Ltd., Sun Pharmaceutical Industries, Synendos Therapeutics AG, Tasly Pharmaceutical Group Co., Teva Pharmaceutical Ltd., Viatris Inc. are a few of the key vendors in the Tourettes Syndrome Drugs market.

North America will register the highest growth rate of 39.3% among the other regions. Therefore, the Tourettes Syndrome Drugs market in North America is expected to garner significant business opportunities for the vendors during the forecast period.

US, Canada, Mexico, UK, Germany, France, Italy, Spain, The Netherlands, China, Japan, India, South Korea, Indonesia, Thailand, Brazil, Turkey, Saudi Arabia, South Africa, Israel, UAE, Argentina, Colombia

  • Advancements in neurobiological research and targeted drug development is the driving factor this market.

The Tourettes Syndrome Drugs market vendors should focus on grabbing business opportunities from the Product segment as it accounted for the largest market share in the base year.
RIA - Research AI Assistant
Ask RIA
