Traffic Safety Products Market Analysis, Size, and Forecast 2026-2030: APAC (China, India, and Japan), North America (US, Canada, and Mexico), Europe (Germany, UK, and France), Middle East and Africa (Saudi Arabia, UAE, and South Africa), South America (Brazil, Chile, and Argentina), and Rest of World (ROW)

Traffic Safety Products Market Analysis, Size, and Forecast 2026-2030:
APAC (China, India, and Japan), North America (US, Canada, and Mexico), Europe (Germany, UK, and France), Middle East and Africa (Saudi Arabia, UAE, and South Africa), South America (Brazil, Chile, and Argentina), and Rest of World (ROW)

Published: May 2026 302 Pages SKU: IRTNTR43255

Market Overview at a Glance

$1.57 B
Market Opportunity
7%
CAGR 2025 - 2030
31.4%
APAC Growth
$2.27 B
Traffic vests and rainwear segment 2024

Traffic Safety Products Market Size and Growth Forecast 2026-2030

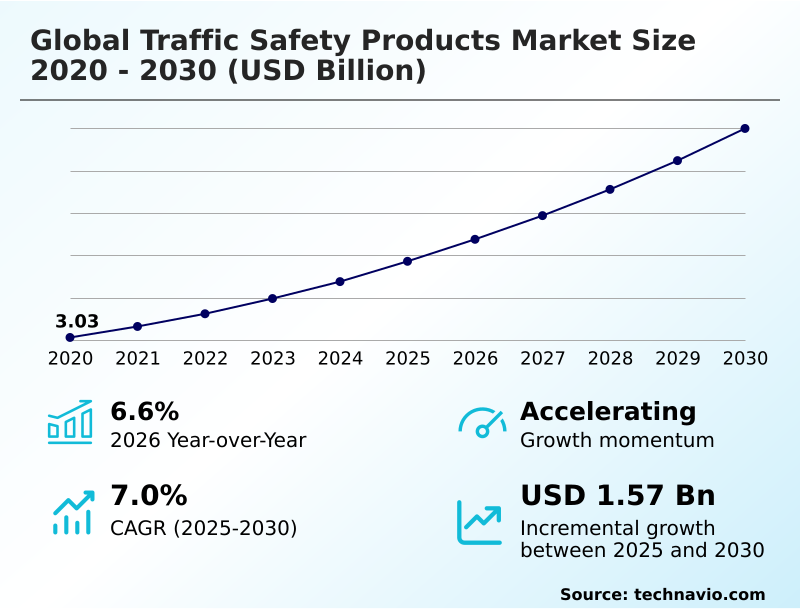
The Traffic Safety Products Market size was valued at USD 3.93 billion in 2025 growing at a CAGR of 7% during the forecast period 2026-2030.

APAC accounts for 31.4% of incremental growth during the forecast period. The Traffic vests and rainwear segment by Product was valued at USD 2.27 billion in 2024, while the Municipal segment holds the largest revenue share by End-user.

The market is projected to grow by USD 2.47 billion from 2020 to 2030, with USD 1.57 billion of the growth expected during the forecast period of 2025 to 2030.

Get Key Insights on Market Forecast (PDF) Request Free Sample

Traffic Safety Products Market Overview

The traffic safety products market is evolving from a focus on passive safety hardware to an ecosystem of intelligent, connected roadway safety infrastructure. This shift is driven by global Vision Zero initiatives and the integration of intelligent transportation systems (ITS) to mitigate human error. Advanced driver-assistance systems (ADAS) and vehicle-to-infrastructure (V2I) communication are compelling upgrades to physical infrastructure, including smart road markings and energy-absorbent barriers that are machine-readable. In a typical smart city integration, a municipality deploys a smart pedestrian crossing system using thermal sensors and AI-powered surveillance to adjust signal timing in real time, a measure that can reduce pedestrian incidents at high-risk intersections. As urban density increases, the demand for modular safety barriers and sophisticated traffic calming measures for vulnerable road user protection is accelerating, with the APAC region alone projected to contribute over 31% of the market's incremental growth.

Drivers, Trends, and Challenges in the Traffic Safety Products Market

Strategic decision-making in the traffic safety products market is increasingly complex, influenced by the total cost of ownership and evolving regulations. A cost-benefit analysis of smart crosswalks, for example, must now factor in long-term data management and cybersecurity for ITS, a consideration absent from traditional passive systems.

The lifecycle assessment of recycled plastic barricades is becoming a key vendor qualification criterion under new ESG mandates in procurement, with some municipalities requiring a minimum percentage of post-consumer content. A primary challenge in deploying automated enforcement is navigating data privacy rules under frameworks like GDPR, which affects the regulatory compliance for AI in traffic monitoring.

This has spurred innovation in edge computing in traffic safety to process data locally.

A state department of transportation evaluating new highway barriers may find that while the upfront cost of a MASH-compliant hardware system is higher than a conventional concrete barrier, its superior energy absorption and reduced repair time lead to lower lifecycle costs, demonstrating the effectiveness of different traffic calming designs.

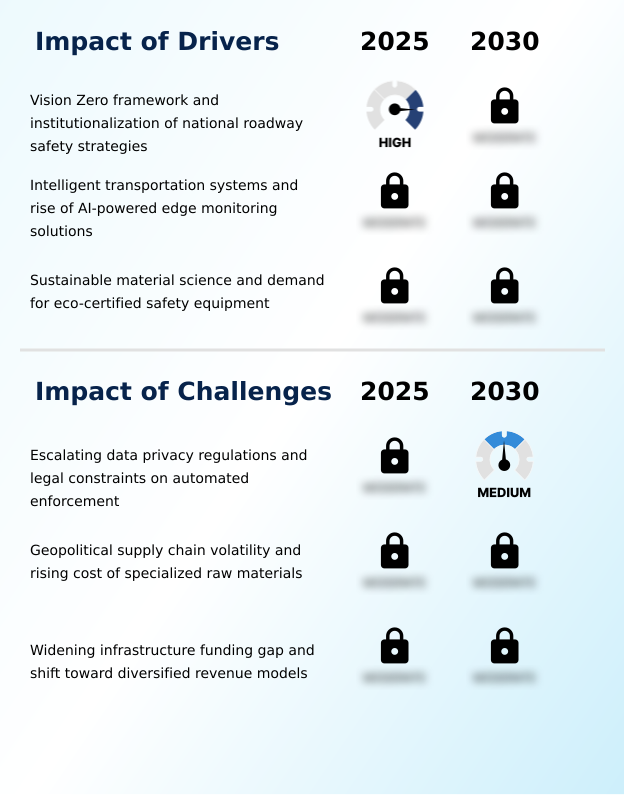
Primary Growth Driver: The adoption of the Vision Zero framework, coupled with the institutionalization of national roadway safety strategies, serves as a primary driver for the market.

Market growth is primarily propelled by three core drivers. First, the global adoption of Vision Zero initiatives is creating sustained, policy-driven demand for proven roadway safety infrastructure and energy-absorbent barriers.

Second, the rapid integration of intelligent transportation systems (ITS), including AI-powered surveillance and V2I communication, is transforming traditional hardware into high-performance data nodes for real-time incident detection.

This is particularly prevalent in North America, which accounts for a significant share of the market.

Third, a strong push towards sustainable material science, driven by ESG mandates, is fueling demand for eco-certified equipment like traffic cones and barricades made from recycled plastics and bio-based polymers, establishing environmental credentials as a key competitive differentiator.

Emerging Market Trend: A key market trend is the proliferation of autonomous road maintenance and infrastructure monitoring systems. This involves integrating unmanned aerial vehicles and robotic service units for hazardous tasks like bridge inspections and deploying temporary safety markers.

Key market trends are centered on the integration of automation and intelligence into roadway infrastructure. The proliferation of autonomous maintenance systems, using drones and robotics for inspections, is reducing human exposure to hazardous work zones. Concurrently, advancements in active safety systems are prioritizing vulnerable road user protection through enhanced sensor fusion in vehicles.

A critical trend is the strategic expansion of smart road markings and digital-ready infrastructure, where thermoplastic pavement markings are engineered for machine readability by advanced driver-assistance systems (ADAS). This ensures that physical safety products remain compatible with the future of automated transport, creating a standardized environment for both human drivers and intelligent vehicle systems.

This move is instrumental in making roadways safer and more efficient.

Key Industry Challenge: Escalating data privacy regulations and associated legal constraints on automated enforcement technologies present a significant challenge to market growth.

The market faces significant structural challenges that could temper growth. Escalating data privacy regulations, such as the EU's GDPR, impose stringent legal constraints on the use of automated enforcement solutions and AI-powered surveillance, increasing compliance costs and slowing deployment.

Geopolitical volatility creates supply chain fragility, leading to rising costs for specialized raw materials like high-impact polymers and retroreflective sheeting, which are essential for high-visibility apparel and other products. Furthermore, a widening infrastructure funding gap in mature markets like North America, where declining fuel tax revenues threaten road maintenance budgets, is a critical issue.

This fiscal pressure can lead to deferred safety upgrades and a preference for low-cost, less durable products over long-term, high-performance solutions.

Explore Full Market Dynamics Analysis Request Free Sample

Traffic Safety Products Market Segmentation

The traffic safety products industry research report provides comprehensive data including region-wise segment analysis, with forecasts and analysis for the period 2026-2030, as well as historical data from 2020-2024 for the following segments.

Market Segment by Product
  • Traffic vests and rainwear
  • Tube delineators
  • Traffic cones
  • Traffic barricades
  • Others
Market Segment by End-user
  • Municipal
  • Industrial and commercial
Market Segment by Application
  • Highways and expressways
  • Urban roads and streets
  • Pedestrian zones
  • Parking and industrial areas
Market Segment by Geography
APAC
China, India, Japan, South Korea, Australia, Indonesia
North America
US, Canada, Mexico
Europe
Germany, UK, France, Italy, Spain, The Netherlands
Middle East and Africa
Saudi Arabia, UAE, South Africa, Turkey, Israel
South America
Brazil, Chile, Argentina

Product Segment Analysis

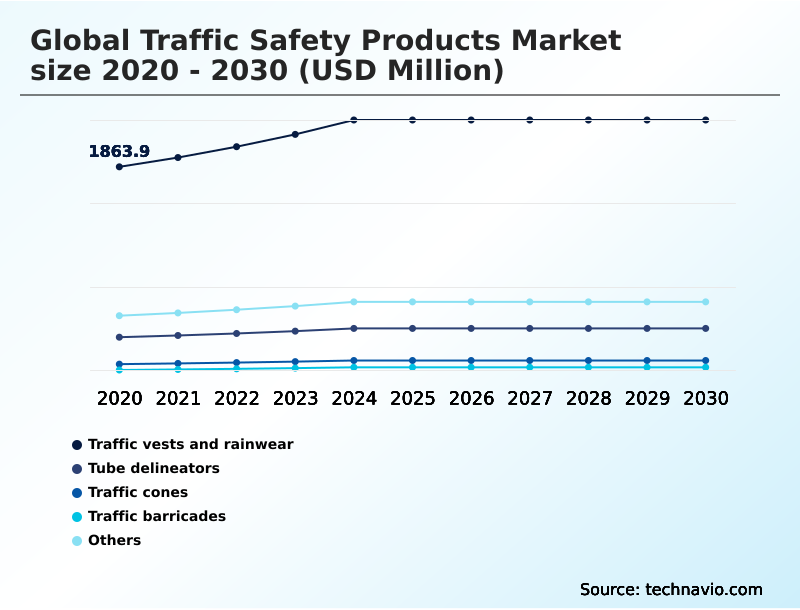
The traffic vests and rainwear segment is estimated to witness significant growth during the forecast period.

The traffic vests and rainwear segment is foundational to the traffic safety products market, driven by stringent occupational safety regulations such as OSHA and ANSI/ISEA 107.

Procurement decisions in this segment, which accounts for a substantial portion of the market, are increasingly influenced by advancements in sustainable material science, with a shift toward high-performance fabrics made from recycled polyesters.

These materials must maintain specified levels of retroreflectivity and fluorescence for high-visibility apparel after prolonged UV exposure and industrial laundering.

The integration of smart textiles with haptic feedback for proximity warnings represents a key innovation area, moving beyond passive safety hardware to active worker protection in high-risk environments like roadway construction and emergency response.

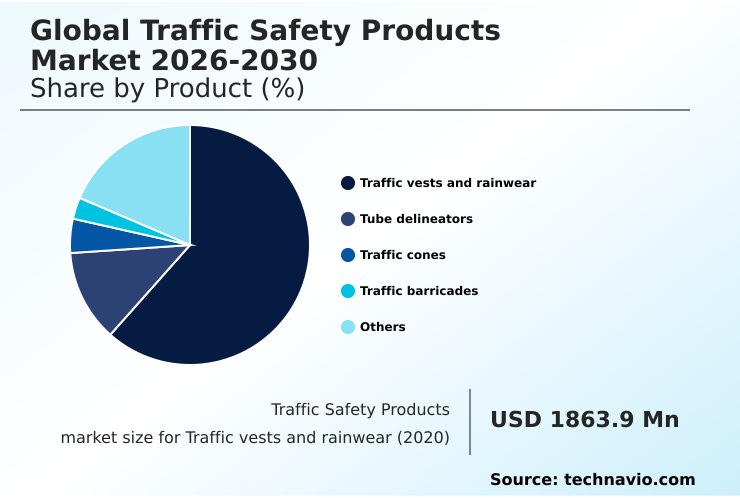
The Traffic vests and rainwear segment was valued at USD 2.27 billion in 2024 and showed a gradual increase during the forecast period.

Traffic Safety Products Market by Region: APAC Leads with 31.4% Growth Share

APAC is estimated to contribute 31.4% to the growth of the global market during the forecast period.

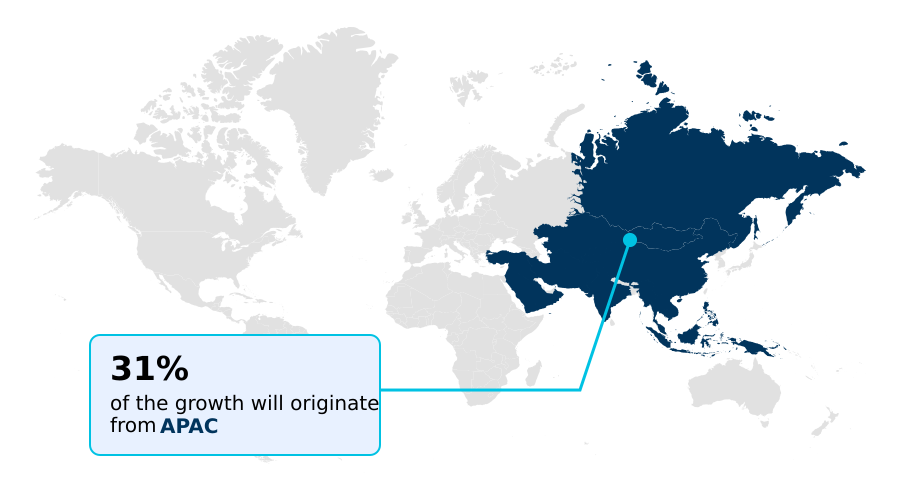
The geographic landscape of the traffic safety products market is characterized by varied regional priorities and growth rates. APAC is the fastest-growing region, contributing approximately 31.4% of the market's growth, driven by massive infrastructure projects in China and India.

This region has a high demand for solutions addressing dense urban traffic and two-wheeler safety.

In contrast, North America and Europe are mature markets focusing on upgrading existing roadway safety infrastructure with advanced technology like AI-powered surveillance and V2I communication to support Vision Zero initiatives.

These regions lead in the adoption of MASH-compliant hardware and sustainable materials. The Middle East is investing heavily in smart city integration for prestige projects, while South America focuses on modernizing highways with durable, cost-effective passive safety hardware.

Customer Landscape Analysis for the Traffic Safety Products Market

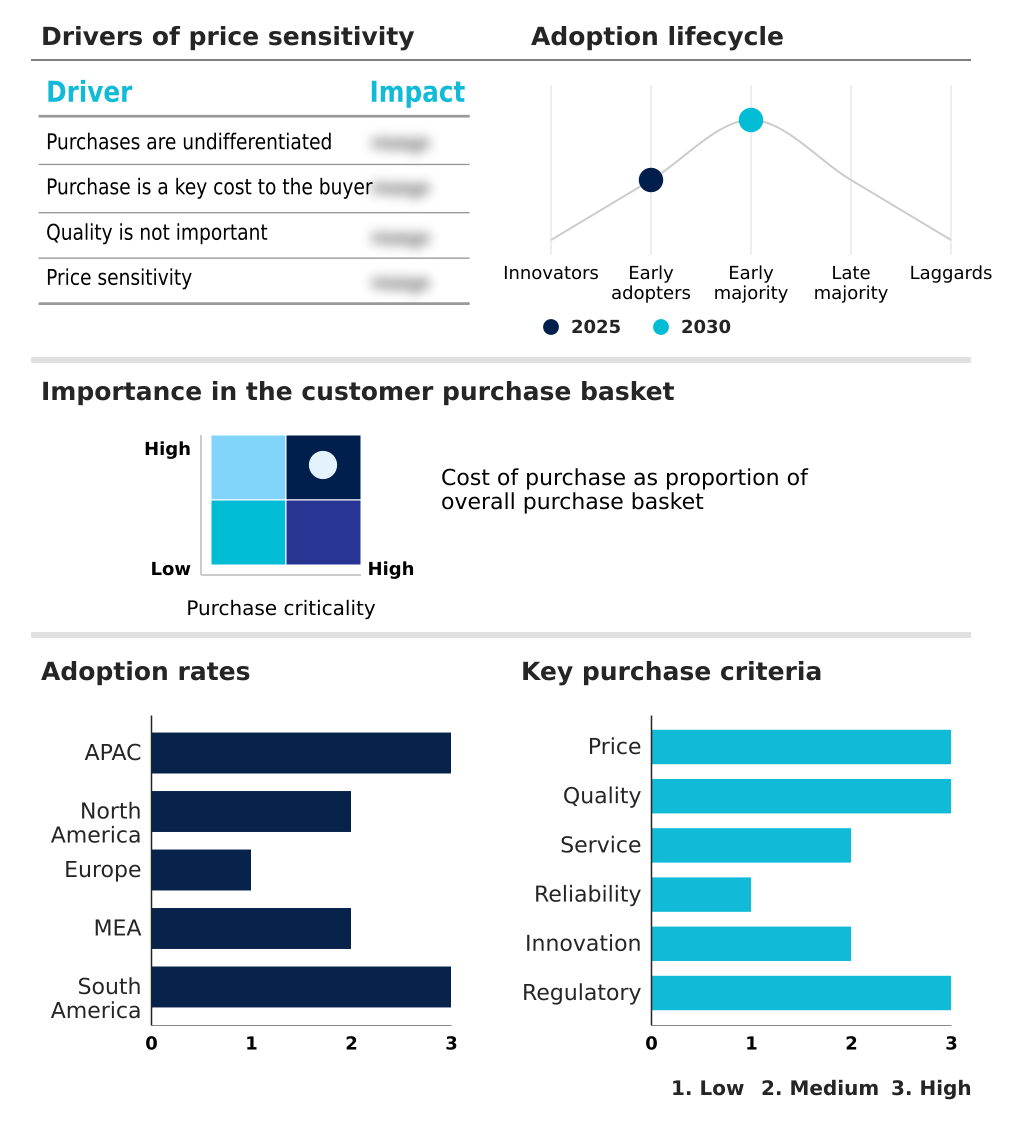
The traffic safety products market forecasting report includes the adoption lifecycle of the market, covering from the innovator’s stage to the laggard’s stage. It focuses on adoption rates in different regions based on penetration. Furthermore, the traffic safety products market report also includes key purchase criteria and drivers of price sensitivity to help companies evaluate and develop their market growth analysis strategies.

Competitive Landscape of the Traffic Safety Products Market

Companies are implementing various strategies, such as strategic alliances, partnerships, mergers and acquisitions, geographical expansion, and product/service launches, to enhance their presence in the traffic safety products market industry.

3M Co. - Offerings include advanced materials for enhanced visibility, such as reflective films and vehicle conspicuity solutions for transportation and industrial safety applications.

The industry research and growth report includes detailed analyses of the competitive landscape of the market and information about key companies, including:

  • 3M Co.
  • Arcosa Inc.
  • Avery Dennison Corp.
  • Brite Line Inc.
  • Hill and Smith Inc.
  • Horizon Signal Technologies Inc.
  • JSP Ltd.
  • Lindsay Corp.
  • Melba Swintex
  • Nippon Carbide Industries Co. Ltd.
  • ORAFOL Europe GmbH
  • Oxford Plastic Systems Ltd.
  • PEXCO
  • Plasticade
  • Solar Technology
  • SWARCO AG
  • TrafFix Devices Inc.
  • Valmont Industries Inc.
  • Ver Mac
  • Wanco Inc.

Qualitative and quantitative analysis of companies has been conducted to help clients understand the wider business environment as well as the strengths and weaknesses of key industry players. Data is qualitatively analyzed to categorize companies as pure play, category-focused, industry-focused, and diversified; it is quantitatively analyzed to categorize companies as dominant, leading, strong, tentative, and weak.

Recent Developments in the Traffic Safety Products Market

  • In May 2025, the New South Wales government commenced a USD 720 million upgrade to Richmond Road in Western Sydney, incorporating smart civil engineering with dedicated cyclist paths and the installation of modern roadway safety infrastructure.
  • In March 2025, Lindsay Corporation launched its AlphaGuard Channelizing Device, a next-generation modular safety barrier made from impact-resistant polyethylene, designed for rapid deployment in construction zones and featuring an interlocking, water-ballasted design for stability.
  • In January 2025, Avery Dennison began advocating for the use of Digital Product Passports to track material provenance, helping contractors comply with American-made material requirements for federally funded infrastructure projects.
  • In November 2024, Hill and Smith Inc. appointed a new Vice President of Sales and Marketing to scale its resilient infrastructure projects and integrated traffic solutions across North America.

Research Analyst Overview: Traffic Safety Products Market

The traffic safety products market is undergoing a structural transformation as digital-ready infrastructure becomes a primary focus. Boardroom decisions are now centered on R&D investment in vehicle-to-infrastructure (V2I) communication and active safety systems, moving beyond the traditional manufacturing of passive safety hardware.

The institutionalization of Vision Zero initiatives compels municipalities to adopt a systemic approach, driving demand for intelligent transportation systems (ITS) and advanced driver-assistance systems (ADAS). For instance, deploying AI-powered surveillance for automated enforcement solutions requires significant capital, but it aligns with federal mandates tied to infrastructure funding.

The market is defined by a pivot towards technology-enabled assets like crash cushions with integrated sensors and smart road markings readable by autonomous vehicles. With the municipal segment representing the largest end-user base, vendors are aligning product roadmaps with smart city integration and vulnerable road user protection protocols, which are becoming standard in public tenders.

Dive into Technavio’s robust research methodology, blending expert interviews, extensive data synthesis, and validated models for unparalleled Traffic Safety Products Market insights. See full methodology.

Request Free Sample

Market Scope
Page number 302
Base year 2025
Historic period 2020-2024
Forecast period 2026-2030
Growth momentum & CAGR Accelerate at a CAGR of 7%
Market growth 2026-2030 USD 1571.5 million
Market structure Fragmented
YoY growth 2025-2026(%) 6.6%
Key countries China, India, Japan, South Korea, Australia, Indonesia, US, Canada, Mexico, Germany, UK, France, Italy, Spain, The Netherlands, Saudi Arabia, UAE, South Africa, Turkey, Israel, Brazil, Chile and Argentina
Competitive landscape Leading Companies, Market Positioning of Companies, Competitive Strategies, and Industry Risks

Traffic Safety Products Market: Key Questions Answered in This Report

  • What is the expected growth of the Traffic Safety Products Market between 2026 and 2030?

    • The Traffic Safety Products Market is expected to grow by USD 1.57 billion during 2026-2030, registering a CAGR of 7%. Year-over-year growth in 2026 is estimated at 6.6%%. This acceleration is shaped by vision zero framework and institutionalization of national roadway safety strategies, which is intensifying demand across multiple end-use verticals covered in the report.

  • What segmentation does the market report cover?

    • The report is segmented by Product (Traffic vests and rainwear, Tube delineators, Traffic cones, Traffic barricades, and Others), End-user (Municipal, and Industrial and commercial), Application (Highways and expressways, Urban roads and streets, Pedestrian zones, and Parking and industrial areas) and Geography (APAC, North America, Europe, Middle East and Africa, South America). Among these, the Traffic vests and rainwear segment is estimated to witness significant growth during the forecast period, driven by rising adoption across key application areas. Each segment includes detailed qualitative and quantitative analysis, along with historical data from 2020-2024 and forecasts through 2030 with year-over-year growth rates.

  • Which regions are analyzed in the report?

    • The report covers APAC, North America, Europe, Middle East and Africa and South America. APAC is estimated to contribute 31.4% to market growth during the forecast period. Country-level analysis includes China, India, Japan, South Korea, Australia, Indonesia, US, Canada, Mexico, Germany, UK, France, Italy, Spain, The Netherlands, Saudi Arabia, UAE, South Africa, Turkey, Israel, Brazil, Chile and Argentina, with dedicated market size tables and year-over-year growth for each.

  • What are the key growth drivers and market challenges?

    • The primary driver is vision zero framework and institutionalization of national roadway safety strategies, which is accelerating investment and industry demand. The main challenge is escalating data privacy regulations and legal constraints on automated enforcement, creating operational barriers for key market participants. The report quantifies the impact of each driver and challenge across 2026 and 2030 with comparative analysis.

  • Who are the major players in the Traffic Safety Products Market?

    • Key vendors include 3M Co., Arcosa Inc., Avery Dennison Corp., Brite Line Inc., Hill and Smith Inc., Horizon Signal Technologies Inc., JSP Ltd., Lindsay Corp., Melba Swintex, Nippon Carbide Industries Co. Ltd., ORAFOL Europe GmbH, Oxford Plastic Systems Ltd., PEXCO, Plasticade, Solar Technology, SWARCO AG, TrafFix Devices Inc., Valmont Industries Inc., Ver Mac and Wanco Inc.. The report provides qualitative and quantitative analysis categorizing companies as dominant, leading, strong, tentative, and weak based on their market positioning. Company profiles include business segment analysis, SWOT assessment, key offerings, and recent strategic developments.

Traffic Safety Products Market Research Insights

Market dynamics are increasingly shaped by the convergence of technology and regulatory pressure. The push for smart city integration is driving demand for IoT-enabled traffic management and real-time incident detection, moving beyond traditional traffic control.

For instance, municipal end-users, who constitute the largest segment, are prioritizing ESG mandates in procurement, favoring solar-powered LED signage and products aligned with circular economy principles. This contrasts with the industrial and commercial sector's focus on durable, MASH-compliant hardware for work zone safety.

Compliance with data privacy frameworks like GDPR now dictates the design of automated enforcement solutions, requiring features such as edge computing to process sensitive data locally. This complex interplay of factors is compelling vendors to offer integrated, data-driven safety ecosystems.

We can help! Our analysts can customize this traffic safety products market research report to meet your requirements.

Get in touch

1. Executive Summary

1.1 Market overview

Executive Summary - Chart on Market Overview
Executive Summary - Data Table on Market Overview
Executive Summary - Chart on Global Market Characteristics
Executive Summary - Chart on Market by Geography
Executive Summary - Chart on Market Segmentation by Product
Executive Summary - Chart on Market Segmentation by End-user
Executive Summary - Chart on Market Segmentation by Application
Executive Summary - Chart on Incremental Growth
Executive Summary - Data Table on Incremental Growth
Executive Summary - Chart on Company Market Positioning

2. Technavio Analysis

2.1 Analysis of price sensitivity, lifecycle, customer purchase basket, adoption rates, and purchase criteria

2.2 Criticality of inputs and Factors of differentiation

Chart on Overview on criticality of inputs and factors of differentiation

2.3 Factors of disruption

Chart on Overview on factors of disruption

2.4 Impact of drivers and challenges

Chart on Impact of drivers and challenges in 2025 and 2030

3. Market Landscape

3.1 Market ecosystem

Chart on Parent Market
Data Table on - Parent Market

3.2 Market characteristics

Chart on Market characteristics analysis

3.3 Value chain analysis

Chart on Value chain analysis

4. Market Sizing

4.1 Market definition

Data Table on Offerings of companies included in the market definition

4.2 Market segment analysis

Market segments

4.3 Market size 2025

4.4 Market outlook: Forecast for 2025-2030

Chart on Global - Market size and forecast 2025-2030 ($ million)
Data Table on Global - Market size and forecast 2025-2030 ($ million)
Chart on Global Market: Year-over-year growth 2025-2030 (%)
Data Table on Global Market: Year-over-year growth 2025-2030 (%)

5. Historic Market Size

5.1 Global Traffic Safety Products Market 2020 - 2024

Historic Market Size - Data Table on Global Traffic Safety Products Market 2020 - 2024 ($ million)

5.2 Product segment analysis 2020 - 2024

Historic Market Size - Product Segment 2020 - 2024 ($ million)

5.3 End-user segment analysis 2020 - 2024

Historic Market Size - End-user Segment 2020 - 2024 ($ million)

5.4 Application segment analysis 2020 - 2024

Historic Market Size - Application Segment 2020 - 2024 ($ million)

5.5 Geography segment analysis 2020 - 2024

Historic Market Size - Geography Segment 2020 - 2024 ($ million)

5.6 Country segment analysis 2020 - 2024

Historic Market Size - Country Segment 2020 - 2024 ($ million)

6. Qualitative Analysis

6.1 Impact of AI in global traffic safety products market

7. Five Forces Analysis

7.1 Five forces summary

Five forces analysis - Comparison between 2025 and 2030

7.2 Bargaining power of buyers

Bargaining power of buyers - Impact of key factors 2025 and 2030

7.3 Bargaining power of suppliers

Bargaining power of suppliers - Impact of key factors in 2025 and 2030

7.4 Threat of new entrants

Threat of new entrants - Impact of key factors in 2025 and 2030

7.5 Threat of substitutes

Threat of substitutes - Impact of key factors in 2025 and 2030

7.6 Threat of rivalry

Threat of rivalry - Impact of key factors in 2025 and 2030

7.7 Market condition

Chart on Market condition - Five forces 2025 and 2030

8. Market Segmentation by Product

8.1 Market segments

Chart on Product - Market share 2025-2030 (%)
Data Table on Product - Market share 2025-2030 (%)

8.2 Comparison by Product

Chart on Comparison by Product
Data Table on Comparison by Product

8.3 Traffic vests and rainwear - Market size and forecast 2025-2030

Chart on Traffic vests and rainwear - Market size and forecast 2025-2030 ($ million)
Data Table on Traffic vests and rainwear - Market size and forecast 2025-2030 ($ million)
Chart on Traffic vests and rainwear - Year-over-year growth 2025-2030 (%)
Data Table on Traffic vests and rainwear - Year-over-year growth 2025-2030 (%)

8.4 Tube delineators - Market size and forecast 2025-2030

Chart on Tube delineators - Market size and forecast 2025-2030 ($ million)
Data Table on Tube delineators - Market size and forecast 2025-2030 ($ million)
Chart on Tube delineators - Year-over-year growth 2025-2030 (%)
Data Table on Tube delineators - Year-over-year growth 2025-2030 (%)

8.5 Traffic cones - Market size and forecast 2025-2030

Chart on Traffic cones - Market size and forecast 2025-2030 ($ million)
Data Table on Traffic cones - Market size and forecast 2025-2030 ($ million)
Chart on Traffic cones - Year-over-year growth 2025-2030 (%)
Data Table on Traffic cones - Year-over-year growth 2025-2030 (%)

8.6 Traffic barricades - Market size and forecast 2025-2030

Chart on Traffic barricades - Market size and forecast 2025-2030 ($ million)
Data Table on Traffic barricades - Market size and forecast 2025-2030 ($ million)
Chart on Traffic barricades - Year-over-year growth 2025-2030 (%)
Data Table on Traffic barricades - Year-over-year growth 2025-2030 (%)

8.7 Others - Market size and forecast 2025-2030

Chart on Others - Market size and forecast 2025-2030 ($ million)
Data Table on Others - Market size and forecast 2025-2030 ($ million)
Chart on Others - Year-over-year growth 2025-2030 (%)
Data Table on Others - Year-over-year growth 2025-2030 (%)

8.8 Market opportunity by Product

Market opportunity by Product ($ million)
Data Table on Market opportunity by Product ($ million)

9. Market Segmentation by End-user

9.1 Market segments

Chart on End-user - Market share 2025-2030 (%)
Data Table on End-user - Market share 2025-2030 (%)

9.2 Comparison by End-user

Chart on Comparison by End-user
Data Table on Comparison by End-user

9.3 Municipal - Market size and forecast 2025-2030

Chart on Municipal - Market size and forecast 2025-2030 ($ million)
Data Table on Municipal - Market size and forecast 2025-2030 ($ million)
Chart on Municipal - Year-over-year growth 2025-2030 (%)
Data Table on Municipal - Year-over-year growth 2025-2030 (%)

9.4 Industrial and commercial - Market size and forecast 2025-2030

Chart on Industrial and commercial - Market size and forecast 2025-2030 ($ million)
Data Table on Industrial and commercial - Market size and forecast 2025-2030 ($ million)
Chart on Industrial and commercial - Year-over-year growth 2025-2030 (%)
Data Table on Industrial and commercial - Year-over-year growth 2025-2030 (%)

9.5 Market opportunity by End-user

Market opportunity by End-user ($ million)
Data Table on Market opportunity by End-user ($ million)

10. Market Segmentation by Application

10.1 Market segments

Chart on Application - Market share 2025-2030 (%)
Data Table on Application - Market share 2025-2030 (%)

10.2 Comparison by Application

Chart on Comparison by Application
Data Table on Comparison by Application

10.3 Highways and expressways - Market size and forecast 2025-2030

Chart on Highways and expressways - Market size and forecast 2025-2030 ($ million)
Data Table on Highways and expressways - Market size and forecast 2025-2030 ($ million)
Chart on Highways and expressways - Year-over-year growth 2025-2030 (%)
Data Table on Highways and expressways - Year-over-year growth 2025-2030 (%)

10.4 Urban roads and streets - Market size and forecast 2025-2030

Chart on Urban roads and streets - Market size and forecast 2025-2030 ($ million)
Data Table on Urban roads and streets - Market size and forecast 2025-2030 ($ million)
Chart on Urban roads and streets - Year-over-year growth 2025-2030 (%)
Data Table on Urban roads and streets - Year-over-year growth 2025-2030 (%)

10.5 Pedestrian zones - Market size and forecast 2025-2030

Chart on Pedestrian zones - Market size and forecast 2025-2030 ($ million)
Data Table on Pedestrian zones - Market size and forecast 2025-2030 ($ million)
Chart on Pedestrian zones - Year-over-year growth 2025-2030 (%)
Data Table on Pedestrian zones - Year-over-year growth 2025-2030 (%)

10.6 Parking and industrial areas - Market size and forecast 2025-2030

Chart on Parking and industrial areas - Market size and forecast 2025-2030 ($ million)
Data Table on Parking and industrial areas - Market size and forecast 2025-2030 ($ million)
Chart on Parking and industrial areas - Year-over-year growth 2025-2030 (%)
Data Table on Parking and industrial areas - Year-over-year growth 2025-2030 (%)

10.7 Market opportunity by Application

Market opportunity by Application ($ million)
Data Table on Market opportunity by Application ($ million)

11. Customer Landscape

11.1 Customer landscape overview

Analysis of price sensitivity, lifecycle, customer purchase basket, adoption rates, and purchase criteria

12. Geographic Landscape

12.1 Geographic segmentation

Chart on Market share by geography 2025-2030 (%)
Data Table on Market share by geography 2025-2030 (%)

12.2 Geographic comparison

Chart on Geographic comparison
Data Table on Geographic comparison

12.3 APAC - Market size and forecast 2025-2030

Chart on APAC - Market size and forecast 2025-2030 ($ million)
Data Table on APAC - Market size and forecast 2025-2030 ($ million)
Chart on APAC - Year-over-year growth 2025-2030 (%)
Data Table on APAC - Year-over-year growth 2025-2030 (%)
Chart on Regional Comparison - APAC
Data Table on Regional Comparison - APAC

12.3.1 China - Market size and forecast 2025-2030

Chart on China - Market size and forecast 2025-2030 ($ million)
Data Table on China - Market size and forecast 2025-2030 ($ million)
Chart on China - Year-over-year growth 2025-2030 (%)
Data Table on China - Year-over-year growth 2025-2030 (%)

12.3.2 India - Market size and forecast 2025-2030

Chart on India - Market size and forecast 2025-2030 ($ million)
Data Table on India - Market size and forecast 2025-2030 ($ million)
Chart on India - Year-over-year growth 2025-2030 (%)
Data Table on India - Year-over-year growth 2025-2030 (%)

12.3.3 Japan - Market size and forecast 2025-2030

Chart on Japan - Market size and forecast 2025-2030 ($ million)
Data Table on Japan - Market size and forecast 2025-2030 ($ million)
Chart on Japan - Year-over-year growth 2025-2030 (%)
Data Table on Japan - Year-over-year growth 2025-2030 (%)

12.3.4 South Korea - Market size and forecast 2025-2030

Chart on South Korea - Market size and forecast 2025-2030 ($ million)
Data Table on South Korea - Market size and forecast 2025-2030 ($ million)
Chart on South Korea - Year-over-year growth 2025-2030 (%)
Data Table on South Korea - Year-over-year growth 2025-2030 (%)

12.3.5 Australia - Market size and forecast 2025-2030

Chart on Australia - Market size and forecast 2025-2030 ($ million)
Data Table on Australia - Market size and forecast 2025-2030 ($ million)
Chart on Australia - Year-over-year growth 2025-2030 (%)
Data Table on Australia - Year-over-year growth 2025-2030 (%)

12.3.6 Indonesia - Market size and forecast 2025-2030

Chart on Indonesia - Market size and forecast 2025-2030 ($ million)
Data Table on Indonesia - Market size and forecast 2025-2030 ($ million)
Chart on Indonesia - Year-over-year growth 2025-2030 (%)
Data Table on Indonesia - Year-over-year growth 2025-2030 (%)

12.4 North America - Market size and forecast 2025-2030

Chart on North America - Market size and forecast 2025-2030 ($ million)
Data Table on North America - Market size and forecast 2025-2030 ($ million)
Chart on North America - Year-over-year growth 2025-2030 (%)
Data Table on North America - Year-over-year growth 2025-2030 (%)
Chart on Regional Comparison - North America
Data Table on Regional Comparison - North America

12.4.1 US - Market size and forecast 2025-2030

Chart on US - Market size and forecast 2025-2030 ($ million)
Data Table on US - Market size and forecast 2025-2030 ($ million)
Chart on US - Year-over-year growth 2025-2030 (%)
Data Table on US - Year-over-year growth 2025-2030 (%)

12.4.2 Canada - Market size and forecast 2025-2030

Chart on Canada - Market size and forecast 2025-2030 ($ million)
Data Table on Canada - Market size and forecast 2025-2030 ($ million)
Chart on Canada - Year-over-year growth 2025-2030 (%)
Data Table on Canada - Year-over-year growth 2025-2030 (%)

12.4.3 Mexico - Market size and forecast 2025-2030

Chart on Mexico - Market size and forecast 2025-2030 ($ million)
Data Table on Mexico - Market size and forecast 2025-2030 ($ million)
Chart on Mexico - Year-over-year growth 2025-2030 (%)
Data Table on Mexico - Year-over-year growth 2025-2030 (%)

12.5 Europe - Market size and forecast 2025-2030

Chart on Europe - Market size and forecast 2025-2030 ($ million)
Data Table on Europe - Market size and forecast 2025-2030 ($ million)
Chart on Europe - Year-over-year growth 2025-2030 (%)
Data Table on Europe - Year-over-year growth 2025-2030 (%)
Chart on Regional Comparison - Europe
Data Table on Regional Comparison - Europe

12.5.1 Germany - Market size and forecast 2025-2030

Chart on Germany - Market size and forecast 2025-2030 ($ million)
Data Table on Germany - Market size and forecast 2025-2030 ($ million)
Chart on Germany - Year-over-year growth 2025-2030 (%)
Data Table on Germany - Year-over-year growth 2025-2030 (%)

12.5.2 UK - Market size and forecast 2025-2030

Chart on UK - Market size and forecast 2025-2030 ($ million)
Data Table on UK - Market size and forecast 2025-2030 ($ million)
Chart on UK - Year-over-year growth 2025-2030 (%)
Data Table on UK - Year-over-year growth 2025-2030 (%)

12.5.3 France - Market size and forecast 2025-2030

Chart on France - Market size and forecast 2025-2030 ($ million)
Data Table on France - Market size and forecast 2025-2030 ($ million)
Chart on France - Year-over-year growth 2025-2030 (%)
Data Table on France - Year-over-year growth 2025-2030 (%)

12.5.4 Italy - Market size and forecast 2025-2030

Chart on Italy - Market size and forecast 2025-2030 ($ million)
Data Table on Italy - Market size and forecast 2025-2030 ($ million)
Chart on Italy - Year-over-year growth 2025-2030 (%)
Data Table on Italy - Year-over-year growth 2025-2030 (%)

12.5.5 Spain - Market size and forecast 2025-2030

Chart on Spain - Market size and forecast 2025-2030 ($ million)
Data Table on Spain - Market size and forecast 2025-2030 ($ million)
Chart on Spain - Year-over-year growth 2025-2030 (%)
Data Table on Spain - Year-over-year growth 2025-2030 (%)

12.5.6 The Netherlands - Market size and forecast 2025-2030

Chart on The Netherlands - Market size and forecast 2025-2030 ($ million)
Data Table on The Netherlands - Market size and forecast 2025-2030 ($ million)
Chart on The Netherlands - Year-over-year growth 2025-2030 (%)
Data Table on The Netherlands - Year-over-year growth 2025-2030 (%)

12.6 Middle East and Africa - Market size and forecast 2025-2030

Chart on Middle East and Africa - Market size and forecast 2025-2030 ($ million)
Data Table on Middle East and Africa - Market size and forecast 2025-2030 ($ million)
Chart on Middle East and Africa - Year-over-year growth 2025-2030 (%)
Data Table on Middle East and Africa - Year-over-year growth 2025-2030 (%)
Chart on Regional Comparison - Middle East and Africa
Data Table on Regional Comparison - Middle East and Africa

12.6.1 Saudi Arabia - Market size and forecast 2025-2030

Chart on Saudi Arabia - Market size and forecast 2025-2030 ($ million)
Data Table on Saudi Arabia - Market size and forecast 2025-2030 ($ million)
Chart on Saudi Arabia - Year-over-year growth 2025-2030 (%)
Data Table on Saudi Arabia - Year-over-year growth 2025-2030 (%)

12.6.2 UAE - Market size and forecast 2025-2030

Chart on UAE - Market size and forecast 2025-2030 ($ million)
Data Table on UAE - Market size and forecast 2025-2030 ($ million)
Chart on UAE - Year-over-year growth 2025-2030 (%)
Data Table on UAE - Year-over-year growth 2025-2030 (%)

12.6.3 South Africa - Market size and forecast 2025-2030

Chart on South Africa - Market size and forecast 2025-2030 ($ million)
Data Table on South Africa - Market size and forecast 2025-2030 ($ million)
Chart on South Africa - Year-over-year growth 2025-2030 (%)
Data Table on South Africa - Year-over-year growth 2025-2030 (%)

12.6.4 Turkey - Market size and forecast 2025-2030

Chart on Turkey - Market size and forecast 2025-2030 ($ million)
Data Table on Turkey - Market size and forecast 2025-2030 ($ million)
Chart on Turkey - Year-over-year growth 2025-2030 (%)
Data Table on Turkey - Year-over-year growth 2025-2030 (%)

12.6.5 Israel - Market size and forecast 2025-2030

Chart on Israel - Market size and forecast 2025-2030 ($ million)
Data Table on Israel - Market size and forecast 2025-2030 ($ million)
Chart on Israel - Year-over-year growth 2025-2030 (%)
Data Table on Israel - Year-over-year growth 2025-2030 (%)

12.7 South America - Market size and forecast 2025-2030

Chart on South America - Market size and forecast 2025-2030 ($ million)
Data Table on South America - Market size and forecast 2025-2030 ($ million)
Chart on South America - Year-over-year growth 2025-2030 (%)
Data Table on South America - Year-over-year growth 2025-2030 (%)
Chart on Regional Comparison - South America
Data Table on Regional Comparison - South America

12.7.1 Brazil - Market size and forecast 2025-2030

Chart on Brazil - Market size and forecast 2025-2030 ($ million)
Data Table on Brazil - Market size and forecast 2025-2030 ($ million)
Chart on Brazil - Year-over-year growth 2025-2030 (%)
Data Table on Brazil - Year-over-year growth 2025-2030 (%)

12.7.2 Chile - Market size and forecast 2025-2030

Chart on Chile - Market size and forecast 2025-2030 ($ million)
Data Table on Chile - Market size and forecast 2025-2030 ($ million)
Chart on Chile - Year-over-year growth 2025-2030 (%)
Data Table on Chile - Year-over-year growth 2025-2030 (%)

12.7.3 Argentina - Market size and forecast 2025-2030

Chart on Argentina - Market size and forecast 2025-2030 ($ million)
Data Table on Argentina - Market size and forecast 2025-2030 ($ million)
Chart on Argentina - Year-over-year growth 2025-2030 (%)
Data Table on Argentina - Year-over-year growth 2025-2030 (%)

12.8 Market opportunity by geography

Market opportunity by geography ($ million)
Data Tables on Market opportunity by geography ($ million)

13. Drivers, Challenges, and Opportunity

13.1 Market drivers

Vision Zero framework and institutionalization of national roadway safety strategies
Intelligent transportation systems and rise of AI-powered edge monitoring solutions
Sustainable material science and demand for eco-certified safety equipment

13.2 Market challenges

Escalating data privacy regulations and legal constraints on automated enforcement
Geopolitical supply chain volatility and rising cost of specialized raw materials
Widening infrastructure funding gap and shift toward diversified revenue models

13.3 Impact of drivers and challenges

Impact of drivers and challenges in 2025 and 2030

13.4 Market opportunities

Proliferation of autonomous road maintenance and infrastructure monitoring systems
Advancement of next-generation active safety and occupant protection protocols
Strategic expansion of smart road markings and digital-ready infrastructure

14. Competitive Landscape

14.1 Overview

14.2

Overview on criticality of inputs and factors of differentiation

14.3 Landscape disruption

Overview on factors of disruption

14.4 Industry risks

Impact of key risks on business

15. Competitive Analysis

15.1 Companies profiled

Companies covered

15.2 Company ranking index

15.3 Market positioning of companies

Matrix on companies position and classification

15.4 3M Co.

3M Co. - Overview
3M Co. - Business segments
3M Co. - Key news
3M Co. - Key offerings
3M Co. - Segment focus
SWOT

15.5 Arcosa Inc.

Arcosa Inc. - Overview
Arcosa Inc. - Business segments
Arcosa Inc. - Key offerings
Arcosa Inc. - Segment focus
SWOT

15.6 Avery Dennison Corp.

Avery Dennison Corp. - Overview
Avery Dennison Corp. - Business segments
Avery Dennison Corp. - Key news
Avery Dennison Corp. - Key offerings
Avery Dennison Corp. - Segment focus
SWOT

15.7 Brite Line Inc.

Brite Line Inc. - Overview
Brite Line Inc. - Product / Service
Brite Line Inc. - Key offerings
SWOT

15.8 Hill and Smith Inc.

Hill and Smith Inc. - Overview
Hill and Smith Inc. - Product / Service
Hill and Smith Inc. - Key offerings
SWOT

15.9 Horizon Signal Technologies Inc.

Horizon Signal Technologies Inc. - Overview
Horizon Signal Technologies Inc. - Product / Service
Horizon Signal Technologies Inc. - Key offerings
SWOT

15.10 JSP Ltd.

JSP Ltd. - Overview
JSP Ltd. - Product / Service
JSP Ltd. - Key offerings
SWOT

15.11 Lindsay Corp.

Lindsay Corp. - Overview
Lindsay Corp. - Business segments
Lindsay Corp. - Key offerings
Lindsay Corp. - Segment focus
SWOT

15.12 Nippon Carbide Industries Co. Ltd.

Nippon Carbide Industries Co. Ltd. - Overview
Nippon Carbide Industries Co. Ltd. - Business segments
Nippon Carbide Industries Co. Ltd. - Key offerings
Nippon Carbide Industries Co. Ltd. - Segment focus
SWOT

15.13 ORAFOL Europe GmbH

ORAFOL Europe GmbH - Overview
ORAFOL Europe GmbH - Product / Service
ORAFOL Europe GmbH - Key offerings
SWOT

15.14 Oxford Plastic Systems Ltd.

Oxford Plastic Systems Ltd. - Overview
Oxford Plastic Systems Ltd. - Product / Service
Oxford Plastic Systems Ltd. - Key offerings
SWOT

15.15 SWARCO AG

SWARCO AG - Overview
SWARCO AG - Product / Service
SWARCO AG - Key offerings
SWOT

15.16 TrafFix Devices Inc.

TrafFix Devices Inc. - Overview
TrafFix Devices Inc. - Product / Service
TrafFix Devices Inc. - Key offerings
SWOT

15.17 Valmont Industries Inc.

Valmont Industries Inc. - Overview
Valmont Industries Inc. - Business segments
Valmont Industries Inc. - Key offerings
Valmont Industries Inc. - Segment focus
SWOT

15.18 Wanco Inc.

Wanco Inc. - Overview
Wanco Inc. - Product / Service
Wanco Inc. - Key offerings
SWOT

16. Appendix

16.1 Scope of the report

Market definition
Objectives
Notes and caveats

16.2 Inclusions and exclusions checklist

Inclusions checklist
Exclusions checklist

16.3 Currency conversion rates for US$

16.4 Research methodology

16.5 Data procurement

Information sources

16.6 Data validation

16.7 Validation techniques employed for market sizing

16.8 Data synthesis

16.9 360 degree market analysis

16.10 List of abbreviations

Research Methodology

Technavio presents a detailed picture of the market by way of study, synthesis, and summation of data from multiple sources. The analysts have presented the various facets of the market with a particular focus on identifying the key industry influencers. The data thus presented is comprehensive, reliable, and the result of extensive research, both primary and secondary.

INFORMATION SOURCES

Primary sources

  • Manufacturers and suppliers
  • Channel partners
  • Industry experts
  • Strategic decision makers

Secondary sources

  • Industry journals and periodicals
  • Government data
  • Financial reports of key industry players
  • Historical data
  • Press releases

DATA ANALYSIS

Data Synthesis

  • Collation of data
  • Estimation of key figures
  • Analysis of derived insights

Data Validation

  • Triangulation with data models
  • Reference against proprietary databases
  • Corroboration with industry experts

REPORT WRITING

Qualitative

  • Market drivers
  • Market challenges
  • Market trends
  • Five forces analysis

Quantitative

  • Market size and forecast
  • Market segmentation
  • Geographical insights
  • Competitive landscape

Interested in this report?

Get your sample now to see our research methodology and insights!

Download Now

Frequently Asked Questions

Traffic Safety Products market growth will increase by USD 1571.5 million during 2026-2030.

The Traffic Safety Products market is expected to grow at a CAGR of 7% during 2026-2030.

Traffic Safety Products market is segmented by Product (Traffic vests and rainwear, Tube delineators, Traffic cones, Traffic barricades, Others) End-user (Municipal, Industrial and commercial) Application (Highways and expressways, Urban roads and streets, Pedestrian zones, Parking and industrial areas)

3M Co., Arcosa Inc., Avery Dennison Corp., Brite Line Inc., Hill and Smith Inc., Horizon Signal Technologies Inc., JSP Ltd., Lindsay Corp., Melba Swintex, Nippon Carbide Industries Co. Ltd., ORAFOL Europe GmbH, Oxford Plastic Systems Ltd., PEXCO, Plasticade, Solar Technology, SWARCO AG, TrafFix Devices Inc., Valmont Industries Inc., Ver Mac, Wanco Inc. are a few of the key vendors in the Traffic Safety Products market.

APAC will register the highest growth rate of 31.4% among the other regions. Therefore, the Traffic Safety Products market in APAC is expected to garner significant business opportunities for the vendors during the forecast period.

China, India, Japan, South Korea, Australia, Indonesia, US, Canada, Mexico, Germany, UK, France, Italy, Spain, The Netherlands, Saudi Arabia, UAE, South Africa, Turkey, Israel, Brazil, Chile, Argentina

  • Vision Zero framework and institutionalization of national roadway safety strategies is the driving factor this market.

The Traffic Safety Products market vendors should focus on grabbing business opportunities from the Product segment as it accounted for the largest market share in the base year.
RIA - Research AI Assistant
Ask RIA