Traffic Sensors Market Analysis North America, Europe, APAC, South America, Middle East and Africa - US, Japan, China, UK, Germany - Size and Forecast 2024-2028

Traffic Sensors Market Analysis North America, Europe, APAC, South America, Middle East and Africa - US, Japan, China, UK, Germany - Size and Forecast 2024-2028

Published: Jul 2024 141 Pages SKU: IRTNTR72544

Market Overview at a Glance

$235.9 Mn
Market Opportunity
10.03%
CAGR
8.89
YoY growth 2023-2024(%)

Traffic Sensors Market Size 2024-2028 

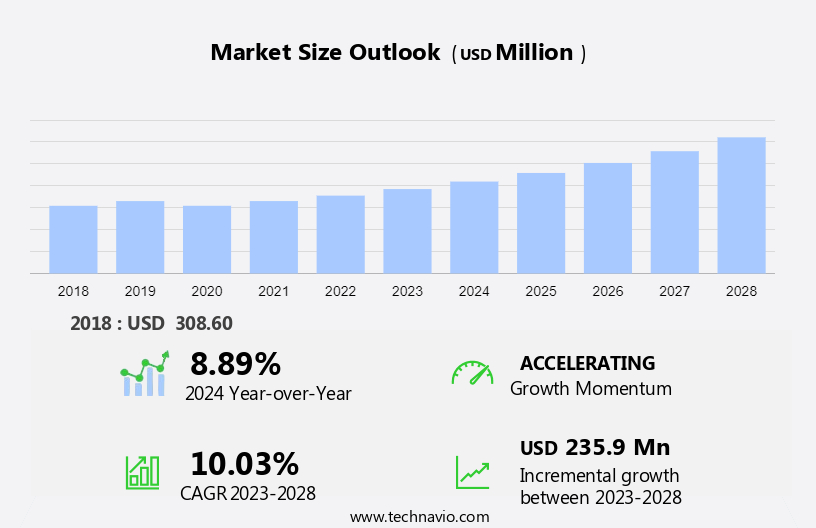
The traffic sensors market size is forecast to increase by USD 235.9 million at a CAGR of 10.03% between 2023 and 2028. The market is experiencing notable growth due to the expanding transport infrastructure and the rising focus on enhancing cycling infrastructure. Bicycle counting sensors are gaining popularity as part of intelligent transportation systems, which utilize IoT technology for smart traffic management. The increasing urban population and the integration of autonomous vehicles into transportation systems are further driving market growth. Additionally, the rise in e-commerce and postal and logistics industries is leading to an increased demand for efficient traffic management solutions. However, the high costs of installation and maintenance remain a significant challenge for market growth. In summary, the market is experiencing significant expansion due to urbanization, road safety norms, and the integration of technology into transportation systems, despite the challenges posed by high installation and maintenance costs.

What will be the Size of the Market During the Forecast Period?

Traffic Sensors Market Size

 Request Free Sample

The market witnessing significant growth due to the increasing demand for advanced traffic control solutions and the integration of IoT technology in transport infrastructure. These sensors play a crucial role in managing and optimizing traffic flow, ensuring road safety, and improving the overall efficiency of transportation systems. Traffic sensors come in various types, including infrared sensors, magnetic sensors, acoustic sensors, bending plate sensors, and imaging sensors. Infrared sensors, for instance, are used for detecting the presence and movement of vehicles, while magnetic sensors are employed for detecting the weight and size of vehicles.

Acoustic sensors, on the other hand, are utilized for detecting the sound of approaching vehicles, and bending plate sensors are designed to detect the weight and axle count of vehicles. Imaging sensors, a more advanced technology, can identify vehicles, bicycles, and even pedestrians, providing valuable data for smart traffic management and cycling infrastructure. The integration of artificial intelligence and edge computing in traffic sensors is revolutionizing the industry. AI algorithms enable real-time analysis of traffic data, allowing for quicker response times and more efficient traffic management. Edge computing, on the other hand, enables data processing at the source, reducing latency and improving overall system performance.

Market Segmentation

The market research report provides comprehensive data (region-wise segment analysis), with forecasts and estimates in "USD million" for the period 2024-2028, as well as historical data from 2018-2022 for the following segments.

  • Application
    • Vehicle measurement and profiling
    • Traffic monitoring
    • Weigh in motion
    • Automated tolling
  • Geography
    • North America
      • US
    • Europe
      • Germany
      • UK
    • APAC
      • China
      • Japan
    • South America
    • Middle East and Africa

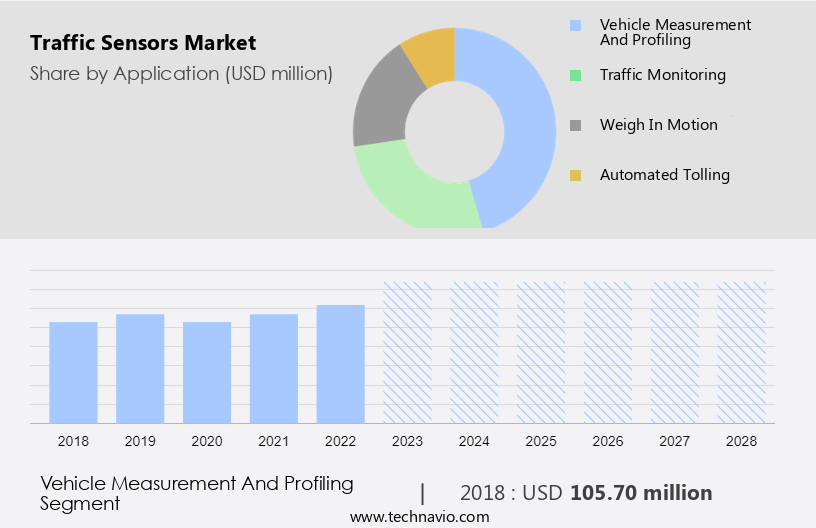
By Application Insights

The vehicle measurement and profiling segment is estimated to witness significant growth during the forecast period. Traffic sensors play a crucial role in the development of advanced transport infrastructure, including cycling infrastructure, by providing real-time data for intelligent transportation systems. The integration of IoT technology and smart traffic management systems enables the efficient monitoring of urban populations and the seamless integration of autonomous vehicles into transportation networks. Vehicle measurement and profiling is an essential component of this infrastructure, used for toll systems, bridge height alerts, and highway weigh stations. With the expansion of transport infrastructure, particularly in the context of surging logistics activities and the growth of e-commerce, the demand for vehicle measurement and profiling systems is expected to increase significantly.

Traffic Sensors Market Size

Get a glance at the market share of various segments Request Free Sample

The vehicle measurement and profiling segment accounted for USD 105.70 million in 2018 and showed a gradual increase during the forecast period.
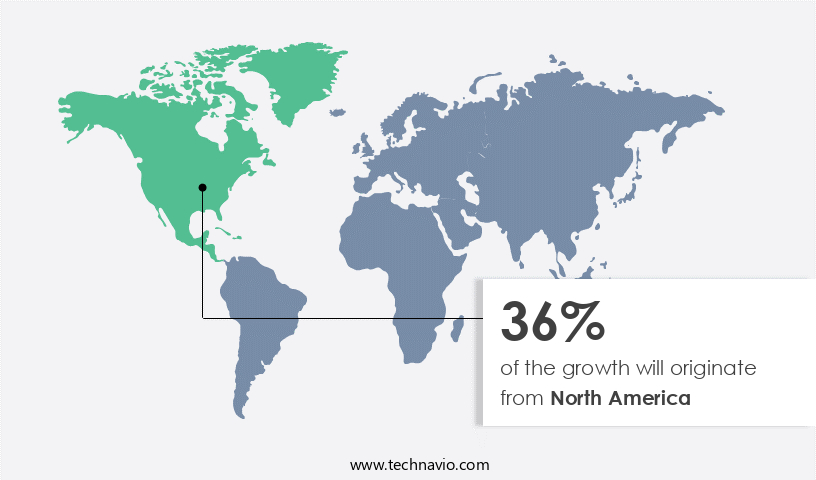
Regional Insights

North America is estimated to contribute 36% to the growth of the global market during the forecast period. Technavio's analysts have elaborately explained the regional trends and drivers that shape the market during the forecast period.

Traffic Sensors Market Share by Geography

For more insights on the market share of various regions Request Free Sample

In North America, traffic sensors hold a significant market share due to the high population density in urban areas, with approximately 80% of the population residing in cities in the US and Canada. The pressing need to manage traffic efficiently in these densely populated regions has led to the increased adoption of advanced traffic management systems. These systems incorporate various types of sensors, including Inductive Loop Sensors, Magnetic Sensors, Radar Sensors, Lidar Sensors, Thermal Sensors, and 3D Sensors, to monitor and manage traffic flow. Moreover, the US and Canadian governments are actively engaged in internal and external research and development to innovate new traffic sensors, enhancing the functionality, ease of use, safety, and dependability of existing sensors.

Key technologies like RFID, GSM, Weigh in Motion, and 3D Sensors are being explored to expand the applications of traffic sensors and improve overall traffic management.

Our researchers analyzed the data with 2023 as the base year, along with the key drivers, trends, and challenges. A holistic analysis of drivers will help companies refine their marketing strategies to gain a competitive advantage.

Market Driver

Rapid urbanization and increasing emphasis on road safety norms is the key driver of the market. The urban population in the United States and globally is experiencing substantial growth, with an increasing number of people moving into cities. According to data from the United Nations, the urban population in the US and worldwide stood at 51.3% and 56.1%, respectively, in 2021, up from 46.72% and 46.72%, respectively, in 2000. This demographic shift poses significant challenges in managing traffic flow, particularly in major cities. Traffic congestion is a growing concern in urban areas, impacting both private and professional mobility. The increasing urbanization and population density have led to higher traffic volumes, making commuting more challenging for residents.

Moreover, the expansion of businesses within cities and their partnerships with external entities is expected to boost transportation volumes further. To address these challenges, municipalities and private entities are turning to advanced technologies such as Automated Tolling, Traffic management, and Traffic flow optimization. These solutions enable efficient Congestion management, enhance Road safety, and improve Emergency response times. Additionally, Digital twin applications and Edge computing are gaining traction in Smart city projects to monitor and manage traffic in real-time. In conclusion, the growing urban population necessitates the adoption of advanced traffic management solutions to ensure seamless mobility, enhance public safety, and optimize transportation systems.

Market Trends

Traffic monitoring to witness significant growth is the upcoming trend in the market. Traffic sensors play a crucial role in monitoring and analyzing vehicle movement and interactions within traffic systems in the United States. This data is essential for optimizing traffic management and reducing congestion. With the growing number of commercial vehicles on the road, there is a heightened demand for advanced traffic control solutions. Innovative traffic monitoring systems are being developed and tested using cutting-edge technologies.

For example, researchers at the Indian Institute of Technology (IIT) Mandi have created a smart road monitoring system designed to minimize the risk of road accidents. This system employs various sensors, including infrared sensors, non-intrusive bicycle counting beams, and 3D technology. By analyzing this data, traffic authorities can make informed decisions to improve traffic flow and ensure road safety. These advanced systems will continue to evolve as technology advances, providing even more efficient and effective traffic management solutions.

Market Challenge

High costs of installation and maintenance is a key challenge affecting the market growth. Traffic sensors play a crucial role in managing and monitoring road traffic efficiently. These systems utilize advanced software and various hardware components, such as imaging sensors, bending plates, inductive loops, magnetic sensors, and infrared sensors, to gather real-time data. Edge devices and IoT solutions facilitate seamless communication and data processing. However, the high cost of installing and maintaining these systems, including the sensors, communication devices, and control systems, poses a challenge to the market expansion.

Nonintrusive sensors, like imaging sensors, microwave sensors, and acoustic sensors, have minimal impact on road traffic but may raise safety concerns. Their effectiveness depends on the mounting location and facing angles, as they require significant vertical and horizontal clearances. Despite these challenges, the market continues to grow due to the increasing demand for intelligent transportation systems and the need for real-time traffic monitoring and management.

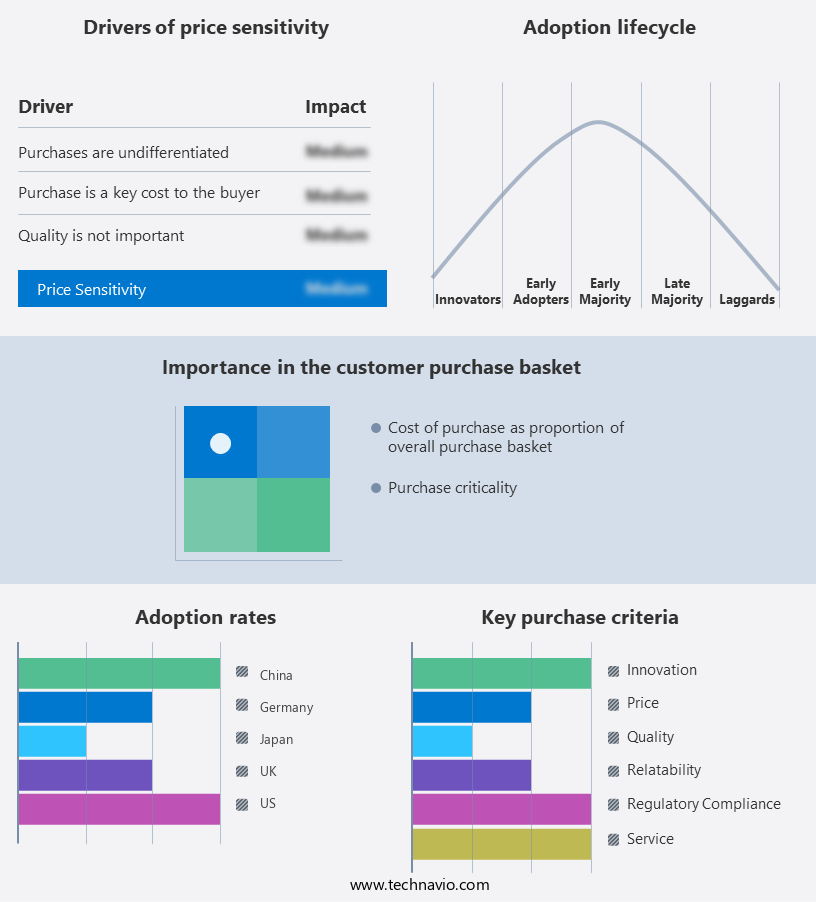
Exclusive Customer Landscape

The market forecasting report includes the adoption lifecycle of the market, covering from the innovator's stage to the laggard's stage. It focuses on adoption rates in different regions based on penetration. Furthermore, the report also includes key purchase criteria and drivers of price sensitivity to help companies evaluate and develop their market growth analysis strategies.

Traffic Sensors Market Share by Geography

 Customer Landscape

Key Companies & Market Insights

Companies are implementing various strategies, such as strategic alliances, partnerships, mergers and acquisitions, geographical expansion, and product/service launches, to enhance their presence in the market.

AGD Systems Ltd. - The company provides traffic management software solutions, encompassing design, provision, installation, and operation.

The market research and growth report includes detailed analyses of the competitive landscape of the market and information about key companies, including:

  • Axis Communications AB
  • CROSS Zlin AS
  • EFKON GmbH
  • Kapsch TrafficCom AG
  • Kistler Group
  • LeddarTech Inc.
  • Q Free ASA
  • Qaurterhill Inc.
  • RTX Corp.
  • S.m.s Smart Microwave Sensors GmbH
  • Sensys Networks Inc.
  • SICK AG
  • Siemens AG
  • Smats Traffic Solutions Inc.
  • SWARCO AG
  • TE Connectivity Ltd.
  • Teledyne Technologies Inc.
  • Traffic Sensor Corp.
  • TransCore

Qualitative and quantitative analysis of companies has been conducted to help clients understand the wider business environment as well as the strengths and weaknesses of key market players. Data is qualitatively analyzed to categorize companies as pure play, category-focused, industry-focused, and diversified; it is quantitatively analyzed to categorize companies as dominant, leading, strong, tentative, and weak.

Research Analyst Overview

Traffic sensors play a crucial role in managing and optimizing transport infrastructure for various industries, including intelligent transportation systems, e-commerce, postal and logistics, restaurant aggregators, and food delivery companies. These sensors utilize advanced technologies such as non-intrusive sensors, infrared sensors, induction loops, AI, 3D technology, IoT technology, and smart traffic management solutions to monitor and manage traffic flow, reduce congestion, enhance road safety, and improve emergency response times. Bicycle counting sensors, using technologies like bicycle counting beams and 2D or 3D sensors, help municipalities and urban areas better understand cycling infrastructure usage and optimize it accordingly.

Further, various sensor types, including image sensors, microwave sensors, acoustic sensors, piezoelectric sensors, bending plate sensors, inductive loop sensors, magnetic sensors, radar sensors, Lidar sensors, thermal sensors, and RFID, are employed to cater to diverse traffic monitoring needs. Edge computing and imaging sensors enable real-time data processing, ensuring efficient traffic flow optimization and congestion management. These sensors contribute significantly to the digital twin applications of transport infrastructure, enhancing the overall performance and safety of the system.

Market Scope

Report Coverage

Details

Page number

141

Base year

2023

Historic period

2018-2022

Forecast period

2024-2028

Growth momentum & CAGR

Accelerate at a CAGR of 10.03%

Market Growth 2024-2028

USD 235.9 million

Market structure

Fragmented

YoY growth 2023-2024(%)

8.89

Regional analysis

North America, Europe, APAC, South America, and Middle East and Africa

Performing market contribution

North America at 36%

Key countries

US, Japan, China, UK, and Germany

Competitive landscape

Leading Companies, Market Positioning of Companies, Competitive Strategies, and Industry Risks

Key companies profiled

AGD Systems Ltd., Axis Communications AB, CROSS Zlin AS, EFKON GmbH, Kapsch TrafficCom AG, Kistler Group, LeddarTech Inc., Q Free ASA, Qaurterhill Inc., RTX Corp., S.m.s Smart Microwave Sensors GmbH, Sensys Networks Inc., SICK AG, Siemens AG, Smats Traffic Solutions Inc., SWARCO AG, TE Connectivity Ltd., Teledyne Technologies Inc., Traffic Sensor Corp., and TransCore

Market dynamics

Parent market analysis, market growth inducers and obstacles, market forecast, fast-growing and slow-growing segment analysis, COVID-19 impact and recovery analysis and future consumer dynamics, market condition analysis for the forecast period

Customization purview

If our market report has not included the data that you are looking for, you can reach out to our analysts and get segments customized.

Request Free Sample

What are the Key Data Covered in this Market Research and Growth Report?

  • CAGR of the market during the forecast period
  • Detailed information on factors that will drive the market growth and forecasting between 2024 and 2028
  • Precise estimation of the size of the market  and its contribution of the market in focus to the parent market
  • Accurate predictions about upcoming market growth and trends and changes in consumer behaviour
  • Growth of the market across North America, Europe, APAC, South America, and Middle East and Africa
  • Thorough analysis of the market's competitive landscape and detailed information about companies
  • Comprehensive analysis of factors that will challenge the growth of market companies

We can help! Our analysts can customize this market research report to meet your requirements.

Get in touch

1 Executive Summary

  • 1.1 Market overview
    • Executive Summary - Chart on Market Overview
    • Executive Summary - Data Table on Market Overview
    • Executive Summary - Chart on Global Market Characteristics
    • Executive Summary - Chart on Market by Geography
    • Executive Summary - Chart on Market Segmentation by Application
    • Executive Summary - Chart on Incremental Growth
    • Executive Summary - Data Table on Incremental Growth
    • Executive Summary - Chart on Company Market Positioning

2 Market Landscape

  • 2.1 Market ecosystem
    • Parent Market
    • Data Table on - Parent Market
  • 2.2 Market characteristics
    • Market characteristics analysis
  • 2.3 Value chain analysis
    • Value Chain Analysis

3 Market Sizing

  • 3.1 Market definition
    • Offerings of companies included in the market definition
  • 3.2 Market segment analysis
    • Market segments
  • 3.3 Market size 2023
    • 3.4 Market outlook: Forecast for 2023-2028
      • Chart on Global - Market size and forecast 2023-2028 ($ million)
      • Data Table on Global - Market size and forecast 2023-2028 ($ million)
      • Chart on Global Market: Year-over-year growth 2023-2028 (%)
      • Data Table on Global Market: Year-over-year growth 2023-2028 (%)

    4 Historic Market Size

    • 4.1 Global Traffic Sensors Market 2018 - 2022
      • Historic Market Size - Data Table on Global Traffic Sensors Market 2018 - 2022 ($ million)
    • 4.2 Application segment analysis 2018 - 2022
      • Historic Market Size - Application Segment 2018 - 2022 ($ million)
    • 4.3 Geography segment analysis 2018 - 2022
      • Historic Market Size - Geography Segment 2018 - 2022 ($ million)
    • 4.4 Country segment analysis 2018 - 2022
      • Historic Market Size - Country Segment 2018 - 2022 ($ million)

    5 Five Forces Analysis

    • 5.1 Five forces summary
      • Five forces analysis - Comparison between 2023 and 2028
    • 5.2 Bargaining power of buyers
      • Bargaining power of buyers - Impact of key factors 2023 and 2028
    • 5.3 Bargaining power of suppliers
      • Bargaining power of suppliers - Impact of key factors in 2023 and 2028
    • 5.4 Threat of new entrants
      • Threat of new entrants - Impact of key factors in 2023 and 2028
    • 5.5 Threat of substitutes
      • Threat of substitutes - Impact of key factors in 2023 and 2028
    • 5.6 Threat of rivalry
      • Threat of rivalry - Impact of key factors in 2023 and 2028
    • 5.7 Market condition
      • Chart on Market condition - Five forces 2023 and 2028

    6 Market Segmentation by Application

    • 6.1 Market segments
      • Chart on Application - Market share 2023-2028 (%)
      • Data Table on Application - Market share 2023-2028 (%)
    • 6.2 Comparison by Application
      • Chart on Comparison by Application
      • Data Table on Comparison by Application
    • 6.3 Vehicle measurement and profiling - Market size and forecast 2023-2028
      • Chart on Vehicle measurement and profiling - Market size and forecast 2023-2028 ($ million)
      • Data Table on Vehicle measurement and profiling - Market size and forecast 2023-2028 ($ million)
      • Chart on Vehicle measurement and profiling - Year-over-year growth 2023-2028 (%)
      • Data Table on Vehicle measurement and profiling - Year-over-year growth 2023-2028 (%)
    • 6.4 Traffic monitoring - Market size and forecast 2023-2028
      • Chart on Traffic monitoring - Market size and forecast 2023-2028 ($ million)
      • Data Table on Traffic monitoring - Market size and forecast 2023-2028 ($ million)
      • Chart on Traffic monitoring - Year-over-year growth 2023-2028 (%)
      • Data Table on Traffic monitoring - Year-over-year growth 2023-2028 (%)
    • 6.5 Weigh in motion - Market size and forecast 2023-2028
      • Chart on Weigh in motion - Market size and forecast 2023-2028 ($ million)
      • Data Table on Weigh in motion - Market size and forecast 2023-2028 ($ million)
      • Chart on Weigh in motion - Year-over-year growth 2023-2028 (%)
      • Data Table on Weigh in motion - Year-over-year growth 2023-2028 (%)
    • 6.6 Automated tolling - Market size and forecast 2023-2028
      • Chart on Automated tolling - Market size and forecast 2023-2028 ($ million)
      • Data Table on Automated tolling - Market size and forecast 2023-2028 ($ million)
      • Chart on Automated tolling - Year-over-year growth 2023-2028 (%)
      • Data Table on Automated tolling - Year-over-year growth 2023-2028 (%)
    • 6.7 Market opportunity by Application
      • Market opportunity by Application ($ million)
      • Data Table on Market opportunity by Application ($ million)

    7 Customer Landscape

    • 7.1 Customer landscape overview
      • Analysis of price sensitivity, lifecycle, customer purchase basket, adoption rates, and purchase criteria

    8 Geographic Landscape

    • 8.1 Geographic segmentation
      • Chart on Market share by geography 2023-2028 (%)
      • Data Table on Market share by geography 2023-2028 (%)
    • 8.2 Geographic comparison
      • Chart on Geographic comparison
      • Data Table on Geographic comparison
    • 8.3 North America - Market size and forecast 2023-2028
      • Chart on North America - Market size and forecast 2023-2028 ($ million)
      • Data Table on North America - Market size and forecast 2023-2028 ($ million)
      • Chart on North America - Year-over-year growth 2023-2028 (%)
      • Data Table on North America - Year-over-year growth 2023-2028 (%)
    • 8.4 Europe - Market size and forecast 2023-2028
      • Chart on Europe - Market size and forecast 2023-2028 ($ million)
      • Data Table on Europe - Market size and forecast 2023-2028 ($ million)
      • Chart on Europe - Year-over-year growth 2023-2028 (%)
      • Data Table on Europe - Year-over-year growth 2023-2028 (%)
    • 8.5 APAC - Market size and forecast 2023-2028
      • Chart on APAC - Market size and forecast 2023-2028 ($ million)
      • Data Table on APAC - Market size and forecast 2023-2028 ($ million)
      • Chart on APAC - Year-over-year growth 2023-2028 (%)
      • Data Table on APAC - Year-over-year growth 2023-2028 (%)
    • 8.6 South America - Market size and forecast 2023-2028
      • Chart on South America - Market size and forecast 2023-2028 ($ million)
      • Data Table on South America - Market size and forecast 2023-2028 ($ million)
      • Chart on South America - Year-over-year growth 2023-2028 (%)
      • Data Table on South America - Year-over-year growth 2023-2028 (%)
    • 8.7 Middle East and Africa - Market size and forecast 2023-2028
      • Chart on Middle East and Africa - Market size and forecast 2023-2028 ($ million)
      • Data Table on Middle East and Africa - Market size and forecast 2023-2028 ($ million)
      • Chart on Middle East and Africa - Year-over-year growth 2023-2028 (%)
      • Data Table on Middle East and Africa - Year-over-year growth 2023-2028 (%)
    • 8.8 US - Market size and forecast 2023-2028
      • Chart on US - Market size and forecast 2023-2028 ($ million)
      • Data Table on US - Market size and forecast 2023-2028 ($ million)
      • Chart on US - Year-over-year growth 2023-2028 (%)
      • Data Table on US - Year-over-year growth 2023-2028 (%)
    • 8.9 Japan - Market size and forecast 2023-2028
      • Chart on Japan - Market size and forecast 2023-2028 ($ million)
      • Data Table on Japan - Market size and forecast 2023-2028 ($ million)
      • Chart on Japan - Year-over-year growth 2023-2028 (%)
      • Data Table on Japan - Year-over-year growth 2023-2028 (%)
    • 8.10 China - Market size and forecast 2023-2028
      • Chart on China - Market size and forecast 2023-2028 ($ million)
      • Data Table on China - Market size and forecast 2023-2028 ($ million)
      • Chart on China - Year-over-year growth 2023-2028 (%)
      • Data Table on China - Year-over-year growth 2023-2028 (%)
    • 8.11 UK - Market size and forecast 2023-2028
      • Chart on UK - Market size and forecast 2023-2028 ($ million)
      • Data Table on UK - Market size and forecast 2023-2028 ($ million)
      • Chart on UK - Year-over-year growth 2023-2028 (%)
      • Data Table on UK - Year-over-year growth 2023-2028 (%)
    • 8.12 Germany - Market size and forecast 2023-2028
      • Chart on Germany - Market size and forecast 2023-2028 ($ million)
      • Data Table on Germany - Market size and forecast 2023-2028 ($ million)
      • Chart on Germany - Year-over-year growth 2023-2028 (%)
      • Data Table on Germany - Year-over-year growth 2023-2028 (%)
    • 8.13 Market opportunity by geography
      • Market opportunity by geography ($ million)
      • Data Tables on Market opportunity by geography ($ million)

    9 Drivers, Challenges, and Opportunity/Restraints

    • 9.1 Market drivers
      • 9.2 Market challenges
        • 9.3 Impact of drivers and challenges
          • Impact of drivers and challenges in 2023 and 2028
        • 9.4 Market opportunities/restraints

          10 Competitive Landscape

          • 10.1 Overview
            • 10.2 Competitive Landscape
              • Overview on criticality of inputs and factors of differentiation
            • 10.3 Landscape disruption
              • Overview on factors of disruption
            • 10.4 Industry risks
              • Impact of key risks on business

            11 Competitive Analysis

            • 11.1 Companies profiled
              • Companies covered
            • 11.2 Market positioning of companies
              • Matrix on companies position and classification
            • 11.3 Kapsch TrafficCom AG
              • Kapsch TrafficCom AG - Overview
              • Kapsch TrafficCom AG - Business segments
              • Kapsch TrafficCom AG - Key news
              • Kapsch TrafficCom AG - Key offerings
              • Kapsch TrafficCom AG - Segment focus
            • 11.4 Kistler Group
              • Kistler Group - Overview
              • Kistler Group - Product / Service
              • Kistler Group - Key offerings
            • 11.5 Q Free ASA
              • Q Free ASA - Overview
              • Q Free ASA - Product / Service
              • Q Free ASA - Key offerings
            • 11.6 Qaurterhill Inc.
              • Qaurterhill Inc. - Overview
              • Qaurterhill Inc. - Product / Service
              • Qaurterhill Inc. - Key offerings
            • 11.7 RTX Corp.
              • RTX Corp. - Overview
              • RTX Corp. - Business segments
              • RTX Corp. - Key news
              • RTX Corp. - Key offerings
              • RTX Corp. - Segment focus
            • 11.8 SICK AG
              • SICK AG - Overview
              • SICK AG - Product / Service
              • SICK AG - Key offerings
            • 11.9 Siemens AG
              • Siemens AG - Overview
              • Siemens AG - Business segments
              • Siemens AG - Key news
              • Siemens AG - Key offerings
              • Siemens AG - Segment focus
            • 11.10 SWARCO AG
              • SWARCO AG - Overview
              • SWARCO AG - Product / Service
              • SWARCO AG - Key offerings
            • 11.11 TE Connectivity Ltd.
              • TE Connectivity Ltd. - Overview
              • TE Connectivity Ltd. - Business segments
              • TE Connectivity Ltd. - Key news
              • TE Connectivity Ltd. - Key offerings
              • TE Connectivity Ltd. - Segment focus
            • 11.12 Teledyne Technologies Inc.
              • Teledyne Technologies Inc. - Overview
              • Teledyne Technologies Inc. - Business segments
              • Teledyne Technologies Inc. - Key news
              • Teledyne Technologies Inc. - Key offerings
              • Teledyne Technologies Inc. - Segment focus

            12 Appendix

            • 12.1 Scope of the report
              • 12.2 Inclusions and exclusions checklist
                • Inclusions checklist
                • Exclusions checklist
              • 12.3 Currency conversion rates for US$
                • Currency conversion rates for US$
              • 12.4 Research methodology
                • Research methodology
              • 12.5 Data procurement
                • Information sources
              • 12.6 Data validation
                • Data validation
              • 12.7 Validation techniques employed for market sizing
                • Validation techniques employed for market sizing
              • 12.8 Data synthesis
                • Data synthesis
              • 12.9 360 degree market analysis
                • 360 degree market analysis
              • 12.10 List of abbreviations
                • List of abbreviations

              Research Methodology

              Technavio presents a detailed picture of the market by way of study, synthesis, and summation of data from multiple sources. The analysts have presented the various facets of the market with a particular focus on identifying the key industry influencers. The data thus presented is comprehensive, reliable, and the result of extensive research, both primary and secondary.

              INFORMATION SOURCES

              Primary sources

              • Manufacturers and suppliers
              • Channel partners
              • Industry experts
              • Strategic decision makers

              Secondary sources

              • Industry journals and periodicals
              • Government data
              • Financial reports of key industry players
              • Historical data
              • Press releases

              DATA ANALYSIS

              Data Synthesis

              • Collation of data
              • Estimation of key figures
              • Analysis of derived insights

              Data Validation

              • Triangulation with data models
              • Reference against proprietary databases
              • Corroboration with industry experts

              REPORT WRITING

              Qualitative

              • Market drivers
              • Market challenges
              • Market trends
              • Five forces analysis

              Quantitative

              • Market size and forecast
              • Market segmentation
              • Geographical insights
              • Competitive landscape

              Interested in this report?

              Get your sample now to see our research methodology and insights!

              Download Now

              Frequently Asked Questions

              Traffic Sensors market growth will increase by $ 235.9 mn during 2024-2028 .

              The Traffic Sensors market is expected to grow at a CAGR of 10.03% during 2024-2028 .

              Traffic Sensors market is segmented by Application( Vehicle measurement and profiling, Traffic monitoring, Weigh in motion, Automated tolling)

              AGD Systems Ltd., Axis Communications AB, CROSS Zlin AS, EFKON GmbH, Kapsch TrafficCom AG, Kistler Group, LeddarTech Inc., Q Free ASA, Qaurterhill Inc., RTX Corp., S.m.s Smart Microwave Sensors GmbH, Sensys Networks Inc., SICK AG, Siemens AG, Smats Traffic Solutions Inc., SWARCO AG, TE Connectivity Ltd., Teledyne Technologies Inc., Traffic Sensor Corp., TransCore are a few of the key vendors in the Traffic Sensors market.

              North America will register the highest growth rate of 36% among the other regions. Therefore, the Traffic Sensors market in North America is expected to garner significant business opportunities for the vendors during the forecast period.

              US, Japan, China, UK, Germany

              • Rapid urbanization and increasing emphasis on road safety normsThe proportion of the urban population is surging considerably every day. This is causing traffic congestion is the driving factor this market.
              • especially in the tier I cities of the world. In 2000 is the driving factor this market.
              • only 46.72% of the world's population lived in cities is the driving factor this market.
              • which increased to 56.14% in 2021. Private and professional mobility presents significant challenges in urban areas. Thus is the driving factor this market.
              • the increasing urbanization and population have been escalating the traffic density levels is the driving factor this market.
              • making commuting tough for the common population. Furthermore is the driving factor this market.
              • as the urban population is growing significantly is the driving factor this market.
              • the volume of business within cities and with business partners outside of cities will also grow significantly. A higher urban population tends to increase the volume of transportation as the business grows. For instance is the driving factor this market.
              • as cities' populations grow is the driving factor this market.
              • so will traffic as businesses such as e-commerce is the driving factor this market.
              • postal and logistics is the driving factor this market.
              • and restaurant aggregator and food delivery companies expand their operations. This will significantly increase the traffic on the road and will require a proper traffic management system to manage the urban traffic. Thus is the driving factor this market.
              • this will drive market growth during the forecast period. is the driving factor this market.

              The Traffic Sensors market vendors should focus on grabbing business opportunities from the Vehicle measurement and profiling segment as it accounted for the largest market share in the base year.