
Transfection Technologies Market Size 2025-2029
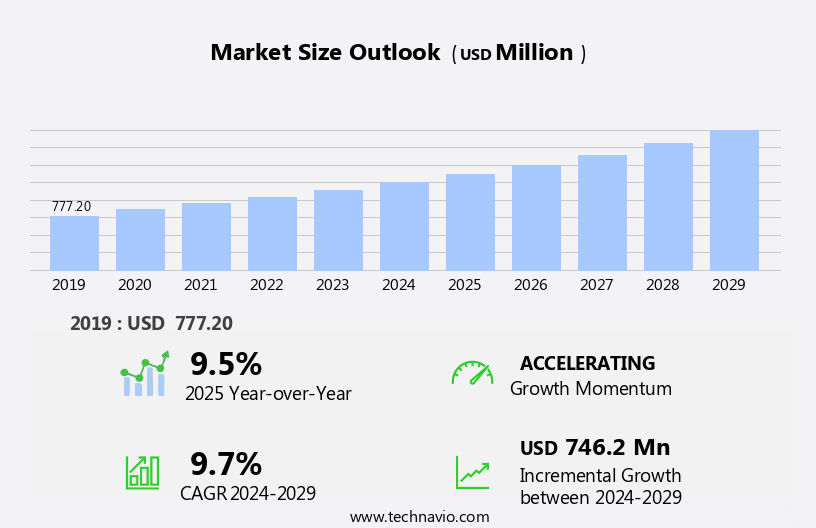
The transfection technologies market size is forecast to increase by USD 746.2 million, at a CAGR of 9.7% between 2024 and 2029.
- The market is experiencing significant growth, driven by the increasing demand for monoclonal antibodies in various applications, including research, diagnostics, and therapeutics. This trend is fueled by the growing importance of personalized medicine and the need for more precise and effective treatments. Another key driver is the increased use of dual-reporter assays and co-transfection experiments, which require efficient and reliable transfection methods. However, challenges persist in the market, primarily related to the efficiency of transfection. Efficiency remains a critical concern, as transfection success rates can vary significantly depending on the cell type and transfection method used. Transfection technologies have gained significant traction in the life sciences industry due to the rising demand for monoclonal antibodies and advanced applications in areas such as gene therapy, cell therapy, diagnostic imaging, and protein production.
- Companies that can effectively navigate these challenges and deliver efficient, reliable, and cost-effective solutions will be well-positioned to succeed in this dynamic and evolving market.
What will be the Size of the Transfection Technologies Market during the forecast period?
Explore in-depth regional segment analysis with market size data - historical 2019-2023 and forecasts 2025-2029 - in the full report.
Request Free Sample
The market continues to evolve, driven by advancements in various sectors including stem cell research, drug delivery, immunology, and gene therapy. Transient transfection, utilizing lipid nanoparticles (LNPs) and polyethyleneimine (PEI), remains a popular choice for delivering DNA constructs into cells for transgene expression and RNA interference (RNAi). In vitro diagnostics and cell culture applications also benefit from these technologies. Regulatory compliance plays a significant role in market dynamics, with stringent requirements for gene therapy and genome editing applications. Stable transfection, achieved through calcium phosphate precipitation and viral vectors like lentiviral and adenoviral, enables long-term gene expression. Cell lines, primary cells, and stem cells are key targets for transfection, with applications in cancer research, immunology, and drug discovery.
Western blot and flow cytometry are essential techniques for monitoring transfection efficiency and cell viability. Cationic polymers and viral vectors like AAV vectors are integral to viral transduction, while reporter genes and target genes are crucial components of gene expression studies. The market's continuous unfolding is reflected in the ongoing development of new transfection reagents and applications, ensuring a vibrant and dynamic landscape.
How is this Transfection Technologies Industry segmented?
The transfection technologies industry research report provides comprehensive data (region-wise segment analysis), with forecasts and estimates in "USD million" for the period 2025-2029, as well as historical data from 2019-2023 for the following segments.
- Type
- Viral-vector
- Physical transfection
- Biochemical based transfection
- End-user
- Pharmaceutical and biotechnology companies
- Contract research organizations
- Academic and research institutes
- Product Type
- Kits and reagents
- Equipment
- Others
- Application
- Biomedical Research
- Therapeutic Delivery
- Protein Production
- Gene Editing
- Cell Line Development
- Geography
- North America
- US
- Canada
- Europe
- France
- Germany
- Italy
- UK
- Middle East and Africa
- Egypt
- KSA
- Oman
- UAE
- APAC
- China
- India
- Japan
- South America
- Argentina
- Brazil
- Rest of World (ROW)
- North America
By Type Insights
The viral-vector segment is estimated to witness significant growth during the forecast period.
In the realm of molecular biology, viral vector-based transfection technologies continue to dominate the landscape due to their high transfection efficiency and versatility. These methods employ viral vectors, including lentivirus, adenovirus, adeno-associated virus (AAV), and retrovirus, to deliver nucleic acids into target cells. The use of viral vectors enables stable and long-term transgene expression, making them indispensable in various research and clinical applications. Lentiviral vectors, for instance, are renowned for their ability to transduce both dividing and non-dividing cells, rendering them ideal for gene therapy and stem cell research. Adenoviral vectors, on the other hand, offer the advantage of high transduction efficiency and broad host range, making them popular choices for vaccine development and gene delivery in primary cells.
AAV vectors, with their low immunogenicity and ability to integrate into the host genome, are extensively used in gene therapy and gene editing applications. Moreover, viral vectors facilitate the delivery of various nucleic acid-based therapeutics, such as RNA interference (RNAi) and CRISPR-Cas9 systems, for genome editing and silencing of target genes. These advancements have significantly expanded the scope of viral vector-based transfection technologies in fields like cancer research, immunology, and drug delivery. Regulatory compliance is a critical aspect of viral vector-based transfection technologies, as they are subject to stringent regulatory requirements. Transfection reagents, such as polyethyleneimine (PEI) and calcium phosphate precipitation, are often used in conjunction with viral vectors to enhance transfection efficiency.
However, viral vectors offer more consistent and reliable results, particularly in applications requiring long-term transgene expression or stable integration into the host genome. Fluorescence microscopy, flow cytometry, Western blot, and other analytical techniques are employed to assess transfection efficiency and monitor transgene expression. In vitro diagnostics and gene gun technologies further expand the applications of viral vector-based transfection methods. Overall, the market for viral vector-based transfection technologies continues to evolve, driven by advancements in viral vector engineering, regulatory compliance, and expanding applications in various fields of research and medicine.
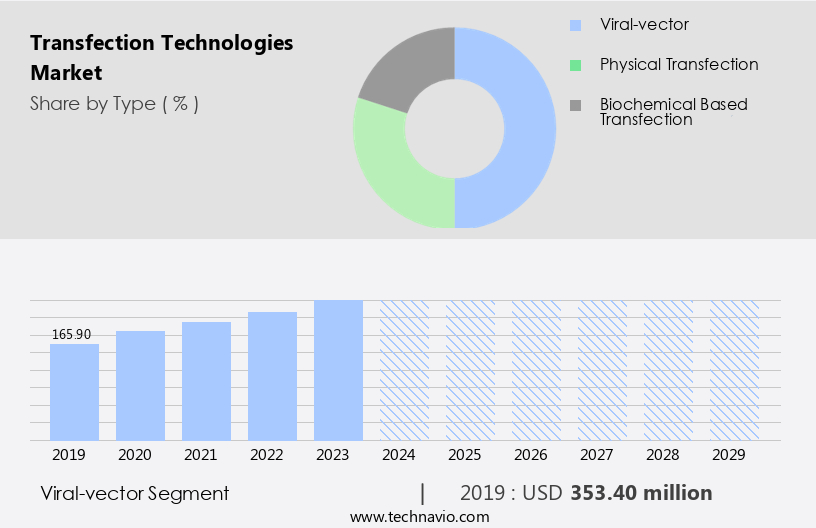
The Viral-vector segment was valued at USD 353.40 million in 2019 and showed a gradual increase during the forecast period.
Regional Analysis
North America is estimated to contribute 46% to the growth of the global market during the forecast period.Technavio's analysts have elaborately explained the regional trends and drivers that shape the market during the forecast period.

The market in North America is experiencing significant growth, driven by advancements in various research fields. In the US and Canada, this market holds a prominent position, fueled by investments from major players such as Bio Rad Laboratories Inc., Promega Inc., and Thermo Fisher Scientific Inc. These companies are expanding their facilities with bioprocessing units and specialized equipment for cell line development and cell culture. Transfection is a crucial process in cell line development, employing techniques like transient and stable methods using lipid nanoparticles (lnp), calcium phosphate precipitation, and polyethyleneimine (pei). Transient transfection, which offers high transfection efficiency, is widely used in stem cell research, fluorescence microscopy, drug delivery, immunology research, and RNA interference (RNAi).
Stable transfection, on the other hand, is essential for gene therapy, gene editing, and transgene expression in cell lines. Cell culture plays a vital role in these processes, and companies are focusing on improving cell viability and quality control. Technologies like flow cytometry and Western blot are employed for monitoring cellular processes and ensuring regulatory compliance. In vitro diagnostics and gene gun are other applications of transfection technologies, contributing to their expanding reach. In cancer research, viral vectors like adenoviral vectors, lentiviral vectors, and AAV vectors are utilized for viral transduction. Cationic polymers are also employed for gene delivery, while RNAi is used for target gene silencing.
These advancements are propelling the market forward, with potential applications in various industries, including pharmaceuticals and biotechnology.
Market Dynamics
The global transfection technologies market is experiencing significant expansion, driven by its critical role in gene therapy and cell therapy advancements. These technologies are fundamental for drug discovery & development and efficient protein production. The market's growth, reflected in the expanding transfection technologies market size and dynamic transfection technologies market trends, is fueled by continuous innovations. Key methods include electroporation and lipofection, utilizing various transfection reagents. The development and delivery of viral vectors and increasingly popular non-viral transfection methods are crucial for precise gene editing, especially with CRISPR/Cas9 delivery systems. Essential transfection instruments and a deeper understanding of both physical transfection methods and biochemical transfection methods are propelling biomedical research, vaccine development, and efficient cell line development.
Our researchers analyzed the data with 2024 as the base year, along with the key drivers, trends, and challenges. A holistic analysis of drivers will help companies refine their marketing strategies to gain a competitive advantage.
What are the key market drivers leading to the rise in the adoption of Transfection Technologies Industry?
- The surge in demand for monoclonal antibodies serves as the primary driving force for the market's growth. Monoclonal antibodies, a type of protein used in various medical applications, including diagnostics and therapeutics, are experiencing increasing demand due to their efficacy and specificity in recognizing and binding to specific antigens. This trend is expected to continue, fueling market expansion in the healthcare industry.
- Monoconal antibodies, as identical immune cells, are in high demand in the pharmaceutical industry due to their applications in various fields, including biology, diagnostic imaging, medicine, and biochemistry. Medical applications span across conditions like cancer, multiple sclerosis, rheumatoid arthritis, cardiovascular diseases, Crohn's disease, psoriasis, and ulcerative colitis. The escalating demand for monoconal antibodies necessitates the development of advanced production technologies. The prevalence of chronic diseases and the need for antibiotic treatments further fuel this demand. Major manufacturers have established large-scale facilities, equipped with multiple cell culture bioreactors, to produce antibodies efficiently. In the realm of gene technology, cell culture plays a crucial role in genome editing, DNA constructs, and RNA interference (RNAi) techniques.
- Flow cytometry, a cell sorting technique, is extensively used in research and diagnostics. Stable transfection, a method for introducing DNA into cells, is critical for various applications, including cancer research. Calcium phosphate precipitation is a popular transfection method, while RNAi offers a novel approach to gene silencing. Primary cells, obtained from various sources, are essential for research and drug development. These technologies continue to evolve, contributing significantly to scientific advancements.
What are the market trends shaping the Transfection Technologies Industry?
- Dual-reporter assays and co-transfection experiments are gaining popularity in the scientific community due to their ability to provide more comprehensive data on gene interactions. The increasing use of these techniques is a notable market trend in molecular biology research.
- In the realm of gene therapy and transgene expression research, transfection reagents play a pivotal role in delivering genetic material into cell lines for subsequent analysis. The use of dual-reporter systems, such as the Nano-Glo Dual-Luciferase Reporter (NanoDLR) Assay System from Promega Corp, has gained traction due to their ability to normalize gene expression for cell number and transfection efficiency. This system allows researchers to distinguish between the effects of the treatment on cells and the response from the experimental reporter, ensuring regulatory compliance and enhancing the quality of research. The NanoDLR Assay System employs firefly luciferase and NanoLuc luciferase, enabling the detection of both activities in a single sample through Western blot analysis.
- Maintaining cell viability during the transfection process is crucial for accurate results, and adenoviral vectors are commonly used due to their high transfection efficiency and stability. Quality control measures, such as cell viability assays and optimization of transfection conditions, are essential to ensure the success of the experiment and the validity of the data obtained.
What challenges does the Transfection Technologies Industry face during its growth?
- The efficiency of transfection, which is a critical process in the biotechnology industry, poses a significant challenge and directly impacts industry growth.
- Transfection, a process used to introduce exogenous DNA into cells, is essential for gene therapy, in vitro diagnostics, and stem cell research. However, challenges exist in delivering the DNA efficiently across the cell membrane, which is negatively charged. The DNA must be free of contaminants, including proteins, RNA, chemicals, and microbes, to ensure successful transfection. The choice of transfection method depends on the type of cells and the target genes. Viral vectors, such as adenoviral and AAV vectors, and viral transduction using a gene gun, are commonly used for gene delivery. Alternatively, cationic polymers can be used for non-viral transfection.
- Cell culture conditions are crucial for successful transfection. Cells should be grown in an appropriate medium and supplemented with growth factors as needed. Contaminated cells should be discarded and replaced with uncontaminated stocks to maintain cell health and prevent compromised growth. Reporter genes, such as luciferase or green fluorescent protein, are often used to monitor transfection efficiency. The use of these genes enables researchers to assess the level of gene expression and optimize transfection conditions. In conclusion, transfection is a critical technique for gene delivery and research applications. The success of the process depends on the quality of the DNA, appropriate cell culture conditions, and efficient delivery methods.
- Ensuring the purity and integrity of the DNA and maintaining optimal cell culture conditions are essential for successful transfection.
Exclusive Customer Landscape
The transfection technologies market forecasting report includes the adoption lifecycle of the market, covering from the innovator's stage to the laggard's stage. It focuses on adoption rates in different regions based on penetration. Furthermore, the transfection technologies market report also includes key purchase criteria and drivers of price sensitivity to help companies evaluate and develop their market growth analysis strategies.

Customer Landscape
Key Companies & Market Insights
Companies are implementing various strategies, such as strategic alliances, transfection technologies market forecast, partnerships, mergers and acquisitions, geographical expansion, and product/service launches, to enhance their presence in the industry.
Altogen Biosystems - The company specializes in providing advanced transfection technologies, including AltoFect Transfection Reagent, specifically engineered for challenging cell lines and primary cell types, enhancing gene transfer efficiency.
The industry research and growth report includes detailed analyses of the competitive landscape of the market and information about key companies, including:
- Altogen Biosystems
- Bio Rad Laboratories Inc.
- Danaher Corp.
- F. Hoffmann La Roche Ltd.
- GENLANTIS
- ibidi GmbH
- Inovio Pharmaceuticals Inc.
- Kytopen Corp.
- Life Technologies India Pvt Ltd.
- Lonza Group Ltd.
- MaxCyte Inc.
- Merck KGaA
- Mirus Bio LLC
- OZ Biosciences
- Promega Corp.
- QIAGEN N.V.
- RJH BIOSCIENCES
- Sartorius AG
- SignaGen Laboratories
- STEMCELL Technologies Inc.
- Takara Holdings Inc.
- Thermo Fisher Scientific Inc.
Qualitative and quantitative analysis of companies has been conducted to help clients understand the wider business environment as well as the strengths and weaknesses of key industry players. Data is qualitatively analyzed to categorize companies as pure play, category-focused, industry-focused, and diversified; it is quantitatively analyzed to categorize companies as dominant, leading, strong, tentative, and weak.
Recent Development and News in Transfection Technologies Market
- In January 2024, Bio-Techne Corporation, a leading life sciences research reagents and tools provider, announced the launch of its new Transfection Kit, QUALITYTransfect, designed to improve transfection efficiency and reduce variability in gene expression studies (Bio-Techne Corporation Press Release).
- In March 2024, Thermo Fisher Scientific, a global biotechnology product development and manufacturing company, entered into a strategic partnership with GeneCure Biotechnology, a gene therapy company, to provide Thermo Fisher's electroporation transfection systems for GeneCure's gene therapy product development (Thermo Fisher Scientific Press Release).
- In May 2024, 4D Molecular Therapeutics, a gene therapy company, raised USD120 million in a Series C funding round, led by new investor OrbiMed, to advance its pipeline of gene therapies using its proprietary 4D-101 plasmid vector technology (4D Molecular Therapeutics Press Release).
- In April 2025, Merck KGaA, a leading science and technology company, received approval from the European Commission for its Transfection Agent, TransFectin, for use in gene therapy applications, expanding its reach in the growing gene therapy market (Merck KGaA Press Release).
Research Analyst Overview
- The market encompasses various techniques for introducing foreign genetic material into cells, with MRNA transfection and non-viral transfection being prominent methods. Image analysis plays a crucial role in process validation and optimization, ensuring efficient delivery systems and minimizing toxicity. Clinical trials and regulatory approvals are pivotal in the product lifecycle management of transfection technologies, with long-term stability and commercialization strategy being essential considerations. Automated transfection and high-throughput screening (HTS) enable large-scale formulation development and data analysis. Intellectual property protection and pricing strategy are key factors in the competitive landscape.
- Gene silencing, gene editing tools, viral packaging, and bioreactor systems are integral to the market's evolution. Titration assays and toxicity tests are essential for process optimization and ensuring safety. Regulatory approvals and scale-up processes are critical for commercial success. Data analysis software and regulatory compliance are essential components of the market's growth trajectory.
Dive into Technavio's robust research methodology, blending expert interviews, extensive data synthesis, and validated models for unparalleled Transfection Technologies Market insights. See full methodology.
|
Market Scope |
|
|
Report Coverage |
Details |
|
Page number |
219 |
|
Base year |
2024 |
|
Historic period |
2019-2023 |
|
Forecast period |
2025-2029 |
|
Growth momentum & CAGR |
Accelerate at a CAGR of 9.7% |
|
Market growth 2025-2029 |
USD 746.2 million |
|
Market structure |
Fragmented |
|
YoY growth 2024-2025(%) |
9.5 |
|
Key countries |
US, Canada, Germany, UK, Italy, France, China, India, Japan, Brazil, Egypt, UAE, Oman, Argentina, KSA, UAE, Brazil, and Rest of World (ROW) |
|
Competitive landscape |
Leading Companies, Market Positioning of Companies, Competitive Strategies, and Industry Risks |
What are the Key Data Covered in this Transfection Technologies Market Research and Growth Report?
- CAGR of the Transfection Technologies industry during the forecast period
- Detailed information on factors that will drive the growth and forecasting between 2025 and 2029
- Precise estimation of the size of the market and its contribution of the industry in focus to the parent market
- Accurate predictions about upcoming growth and trends and changes in consumer behaviour
- Growth of the market across North America, Europe, Asia, and Rest of World (ROW)
- Thorough analysis of the market's competitive landscape and detailed information about companies
- Comprehensive analysis of factors that will challenge the transfection technologies market growth of industry companies
We can help! Our analysts can customize this transfection technologies market research report to meet your requirements.
 RIA -
RIA - 
