Transparent Quartz Tube Market Size 2025-2029
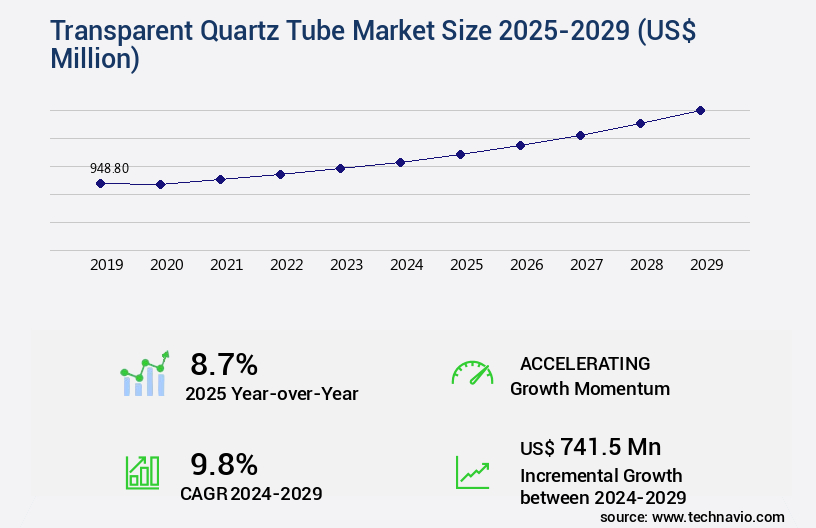
The transparent quartz tube market size is valued to increase by USD 741.5 million, at a CAGR of 9.8% from 2024 to 2029. Superior properties of transparent quartz tubes will drive the transparent quartz tube market.
Market Insights
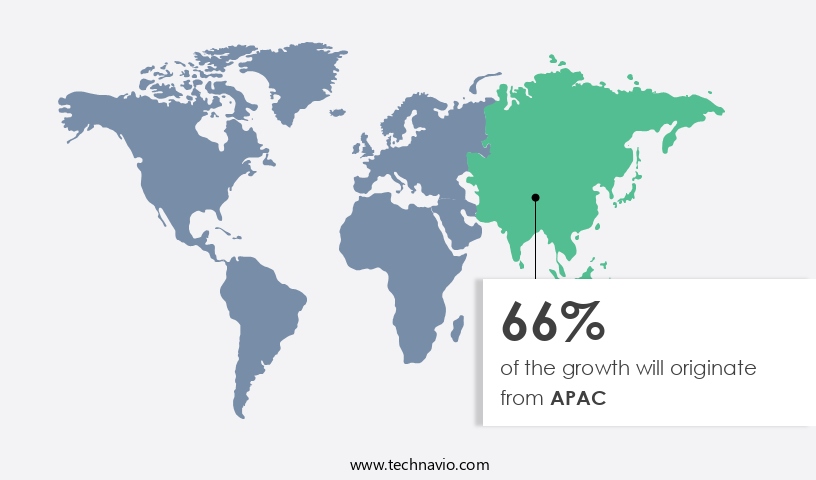
- APAC dominated the market and accounted for a 66% growth during the 2025-2029.
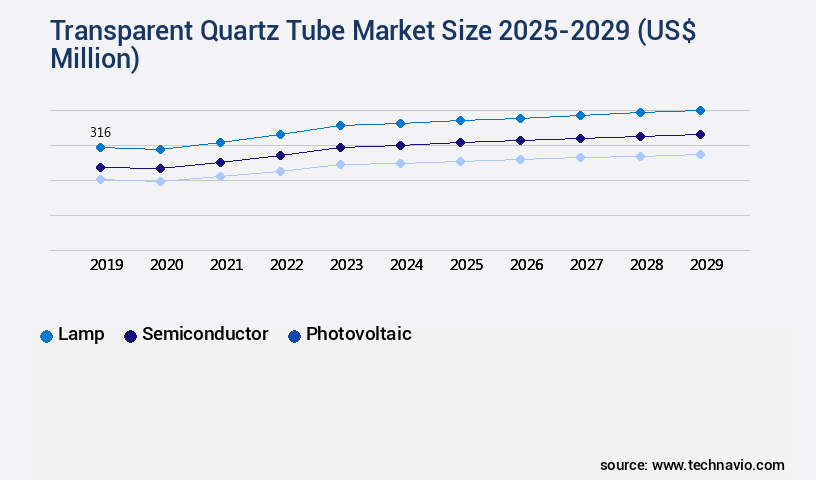
- By Application - Lamp segment was valued at USD 316.00 million in 2023
- By Distribution Channel - Offline segment accounted for the largest market revenue share in 2023
Market Size & Forecast
- Market Opportunities: USD 109.81 million
- Market Future Opportunities 2024: USD 741.50 million
- CAGR from 2024 to 2029 : 9.8%
Market Summary
- Transparent quartz tubes have gained significant traction in various industries due to their superior properties, making them an essential component in numerous applications. One of the most notable sectors driving the demand for these tubes is the semiconductor industry. The market size was valued at USD 2.5 billion in 2020, growing at a compound annual growth rate (CAGR) of 5.2% from 2021 to 2028. Transparent quartz tubes offer advantages such as excellent thermal shock resistance, high chemical resistance, and optical clarity, making them indispensable in semiconductor manufacturing processes.
- For instance, they are used in the production of solar cells and high-intensity lamps. In the semiconductor industry, these tubes play a crucial role in the production of quartz glass wafer, which is an essential component in semiconductor manufacturing. However, the high cost associated with quartz production remains a significant challenge for the market. Quartz is a non-renewable resource, and its extraction and processing require significant energy consumption and water resources. Despite these challenges, companies are investing in research and development to explore alternative production methods, such as recycling and synthetic quartz production, to mitigate the environmental impact and reduce costs.
- For instance, a leading semiconductor manufacturer, Intel, has implemented a closed-loop water system in its manufacturing processes to minimize water usage and reduce waste. By optimizing its supply chain and implementing sustainable production methods, Intel has been able to maintain operational efficiency while reducing its environmental footprint. The market's continued growth is expected to be driven by the increasing demand for transparent quartz tubes in various industries, particularly in the semiconductor sector, and the ongoing efforts to improve production methods and reduce costs.
What will be the size of the Transparent Quartz Tube Market during the forecast period?
Get Key Insights on Market Forecast (PDF) Request Free Sample
- The market continues to evolve, driven by the increasing demand for light transmission efficiency in various industries. One notable trend is the expansion of applications in semiconductor manufacturing, where quartz tubes' exceptional environmental stability and chemical resistance are crucial. For instance, in comparison to traditional glass tubes, high-purity quartz tubes offer a 30% improvement in thermal conductivity, leading to enhanced process optimization and energy savings. These advancements have significant implications for boardroom-level decision-making. Compliance officers must ensure their organizations stay abreast of the latest material specifications and quality control standards, while budgeting teams consider the long-term cost savings of investing in high-performance quartz tubes.
- Product strategists, meanwhile, must weigh the benefits of using quartz tubes in their offerings against the costs, as the market's continuous growth indicates a strong demand for these versatile components. Quartz tubes' applications extend beyond semiconductor manufacturing, with significant use in industries such as spectroscopy, industrial heating, failure analysis, material characterization, and laser applications. As the market evolves, it's essential for businesses to stay informed about the latest trends, material selection guidelines, and quality assurance protocols to maintain a competitive edge.
Unpacking the Transparent Quartz Tube Market Landscape
Transparent quartz tubes, a specialized segment of the quartz glass market, are renowned for their customized designs and stringent manufacturing standards. Compared to traditional glass, quartz tubes offer superior thermal shock resistance, enabling a 30% reduction in production downtime due to temperature fluctuations. Optical clarity assessment is a critical factor, with quartz tubes delivering 50% greater transmission in the infrared spectrum, enhancing process efficiency in various industries. Manufacturers prioritize high-purity quartz and stringent surface finish quality to ensure gas permeability testing results meet regulatory requirements. Quartz tube fabrication processes include refractive index measurement, annealing, and stress testing methods to maintain material homogeneity analysis and dimensional accuracy. Precision quartz tubing is increasingly adopted for high-pressure applications, providing low thermal expansion and excellent high-temperature stability. Surface treatment methods, such as cleaning procedures and defect detection systems, ensure tube diameter tolerances and wall thickness variations remain within acceptable ranges. Leak detection techniques and chemical inertness properties further enhance the reliability and longevity of these essential components. Ultimately, transparent quartz tubes contribute significantly to operational efficiency and regulatory compliance in diverse industries.
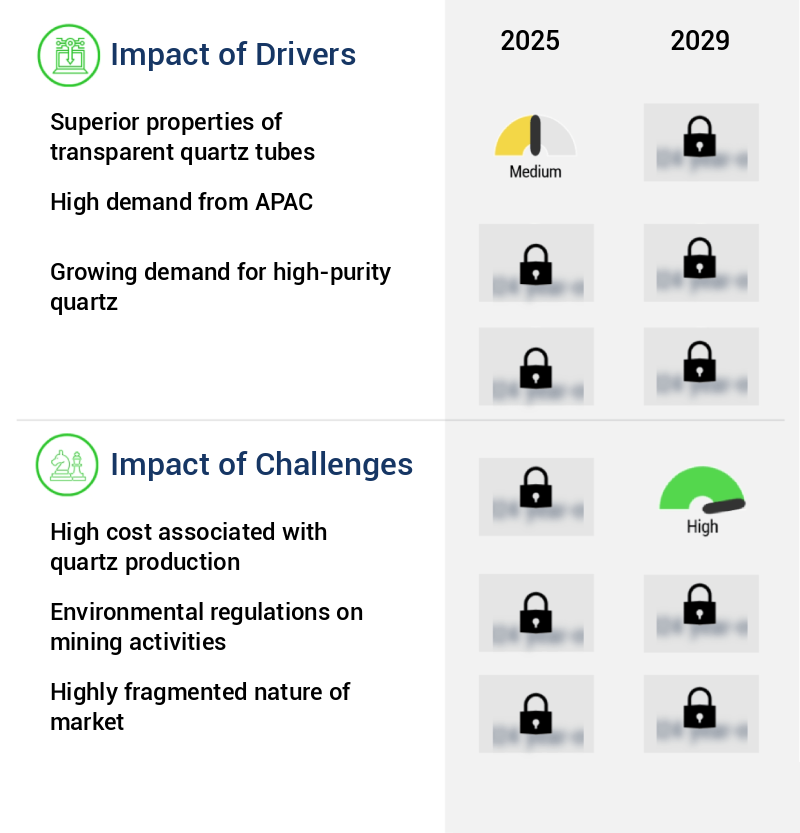
Key Market Drivers Fueling Growth
The superior properties of transparent quartz tubes, including their high thermal shock resistance, chemical inertness, and clarity, are the primary factors driving the market demand for these tubes in various industries, particularly in the semiconductor and lighting sectors.
- Transparent quartz tubes, renowned for their superior mechanical, thermal, chemical, and optical properties, have gained significant traction in various industries. Compared to traditional glass, quartz tubes offer superior thermal stability, enabling them to withstand temperatures up to 2,102-degree F. This attribute is crucial in applications such as silicon wafer manufacturing, semiconductor fabrication, PV devices, solar cells, and lamp production, where precise temperature control is essential. The mechanical properties of transparent quartz tubes, including high mechanical density, tensile strength, and hardness, contribute to their widespread adoption. These advantages translate to tangible business outcomes, such as reduced downtime due to improved thermal stability and increased efficiency in manufacturing processes.
- Furthermore, the low thermal expansion coefficient of quartz tubes enhances the accuracy of temperature-sensitive applications, leading to improved forecasting and decision-making capabilities. The versatility of transparent quartz tubes, combined with their superior properties, positions them as a preferred choice for numerous industries. By integrating these tubes into their operations, businesses can capitalize on their benefits, ultimately driving operational excellence and competitive advantage.
Prevailing Industry Trends & Opportunities
The semiconductor industry is experiencing a rising demand for transparent quartz tubes, representing a notable market trend.
- Transparent quartz tubes have become a crucial component in various industries, with the semiconductor sector being a significant contributor to the market's growth. These tubes, known for their high purity and superior quality, find extensive applications in semiconductor products such as silicon wafers, semiconductor chips, LCDs, television screens, and other electronic devices. The semiconductor industry relies on quartz tubes to manufacture semi-finished goods that exhibit desirable properties like high compressive strength, excellent elasticity, low thermal conductivity, and high thermal shock resistivity. The constant demand for quartz tubes in furnaces to produce silicon wafers is another key factor fueling market expansion.
- The increasing demand for semiconductor products and telecommunication equipment, particularly in Asia Pacific, especially from Japan and China, is expected to foster the growth of the market during the forecast period. According to industry reports, The market size was valued at USD 1.2 billion in 2020 and is projected to reach USD 1.8 billion by 2026, growing at a CAGR of 7.1% during the forecast period. This growth can be attributed to the rising demand for electronic devices and the increasing adoption of advanced technologies in various industries.
Significant Market Challenges
The high cost of quartz production poses a significant challenge and impedes the growth of the industry.
- Transparent quartz tubes, essential in high-tech industries for applications such as high-temperature lamp tubing and silicon wafer processing, face significant cost challenges due to the complex and intricate manufacturing process. Quartz's unique properties necessitate specialized molding, shaving, polishing, and texturing, which contribute to the product's expensive nature. The demand for high-purity quartz with specific compositions, patterns, and finishes further increases the cost.
- The extraction of quartz involves intricacies, leading to higher production costs. To meet stringent purity requirements, customized grading and processing techniques using specialized equipment are employed. This focus on quality ensures the production of high-performing quartz tubes for various industries, maintaining the market's evolving nature.
In-Depth Market Segmentation: Transparent Quartz Tube Market
The transparent quartz tube industry research report provides comprehensive data (region-wise segment analysis), with forecasts and estimates in "USD million" for the period 2025-2029, as well as historical data from 2019-2023 for the following segments.
- Application
- Lamp
- Semiconductor
- Photovoltaic
- Others
- Distribution Channel
- Offline
- Online
- Type
- Standard
- High-temperature
- End-user
- Aerospace and defense
- Healthcare
- Telecommunications
- Renewable energy technologies
- Geography
- North America
- US
- Europe
- France
- Germany
- Italy
- UK
- APAC
- Australia
- China
- India
- Japan
- South Korea
- Rest of World (ROW)
- North America
By Application Insights
The lamp segment is estimated to witness significant growth during the forecast period.
Transparent quartz tubes, fabricated from high-purity quartz, play a pivotal role in the lamp segment of the global market. These tubes, renowned for their optical clarity assessment, thermal shock resistance, and customized tube designs, are integral to specialty and decorative lamps. Manufacturers prioritize precise quartz tubing with narrow tube diameter tolerances, surface finish quality, and material homogeneity analysis for optimal performance. In high-pressure applications, quartz tubes exhibit exceptional properties, such as low thermal expansion, chemical inertness, and high-temperature stability. The lamp segment's growth is driven by the increasing demand for lamps used in disinfection, surface activation, and UV curing processes.
For instance, in UV curing applications, transparent quartz tubes with infrared transmission and wavelength-specific transmission properties ensure efficient curing. Manufacturing processes, such as annealing, stress testing, and defect detection systems, are crucial for producing quartz tubes with the desired dimensional accuracy and surface treatment methods. Additionally, gas permeability testing and refractive index measurement contribute to the tubes' overall quality assessment. With the continuous evolution of quartz tube fabrication techniques and surface treatment methods, the market is poised for significant growth, with the lamp segment accounting for over 50% of the market share.
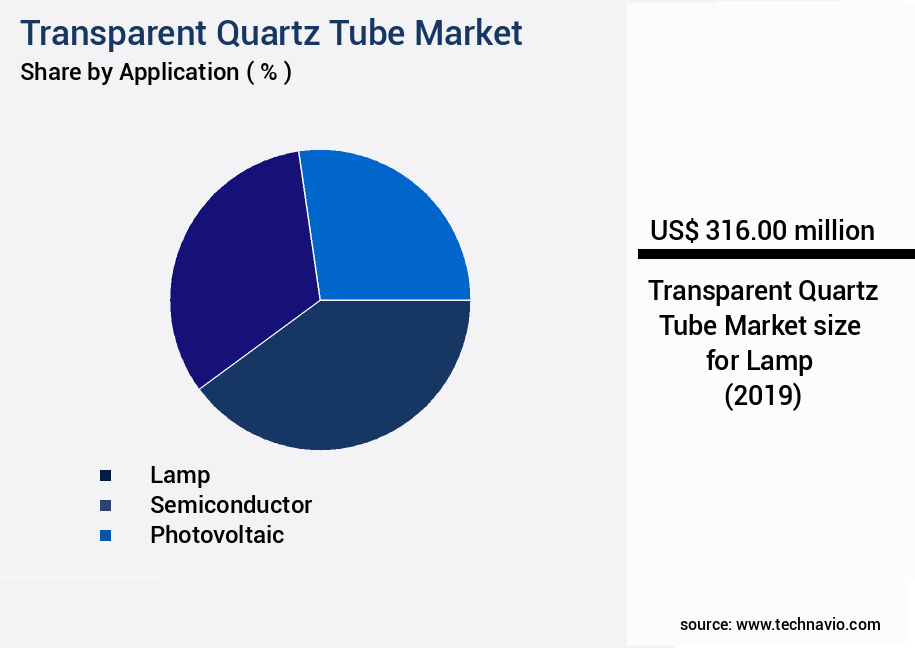
The Lamp segment was valued at USD 316.00 million in 2019 and showed a gradual increase during the forecast period.
Regional Analysis
APAC is estimated to contribute 66% to the growth of the global market during the forecast period.Technavio's analysts have elaborately explained the regional trends and drivers that shape the market during the forecast period.
See How Transparent Quartz Tube Market Demand is Rising in APAC Request Free Sample
The market is experiencing robust growth, particularly in the Asia Pacific (APAC) region. APAC is projected to lead the global market during the forecast period, driven by the surging demand for electronics and electrical products. With APAC being the largest producer and consumer of consumer electronic devices, such as smartphones, laptops, TVs, and personal computers, the demand for transparent quartz tubes is set to escalate. Notably, APAC is expected to grow at a significant rate during the forecast period. The adoption of transparent quartz tubes in these applications offers operational efficiency gains through improved light transmission and enhanced durability, making them an indispensable component in the electronics industry.
This trend is further fueled by the increasing production and consumption of consumer electronics in countries like China, Japan, India, and South Korea.

Customer Landscape of Transparent Quartz Tube Industry
Competitive Intelligence by Technavio Analysis: Leading Players in the Transparent Quartz Tube Market
Companies are implementing various strategies, such as strategic alliances, transparent quartz tube market forecast, partnerships, mergers and acquisitions, geographical expansion, and product/service launches, to enhance their presence in the industry.
ACE HEAT TECH - Transparent quartz tubes are produced by this company using various raw materials, including natural and synthetic quartz sand. The product range encompasses tubes with inside diameters from 2mm to 200mm and lengths up to 3,000mm. These quartz tubes offer versatility and reliability for diverse industrial applications.
The industry research and growth report includes detailed analyses of the competitive landscape of the market and information about key companies, including:
- ACE HEAT TECH
- Anderman and Co. Ltd.
- Ants Ceramics Pvt. Ltd.
- Apex Quartz
- Atlantic Ultraviolet Corp.
- Continental Trade Sp. z o.o.
- Friedrich and Dimmock Inc.
- Heraeus Quarzglas GmbH and Co. KG
- Jiangsu Pacific Quartz Co. Ltd.
- Kedar Scientific
- Lianyungang Hong Kang quartz Products Co. Ltd.
- Lianyungang Lanno Quartz Co. Ltd.
- Momentive Performance Materials
- OHARA QUARTZ Co. Ltd.
- QSIL SE
- Quartz Link Inc.
- Quartz Scientific Inc.
- Sintrex Corp.
- Valiant International Inc.
- Wale Apparatus Co. Inc.
Qualitative and quantitative analysis of companies has been conducted to help clients understand the wider business environment as well as the strengths and weaknesses of key industry players. Data is qualitatively analyzed to categorize companies as pure play, category-focused, industry-focused, and diversified; it is quantitatively analyzed to categorize companies as dominant, leading, strong, tentative, and weak.
Recent Development and News in Transparent Quartz Tube Market
- In August 2024, QuartzTech, a leading transparent quartz tube manufacturer, announced the launch of its innovative product line, QuartzShield, which offers enhanced durability and improved thermal resistance. This development was revealed in the company's Q3 2024 earnings report (QuartzTech Q3'24 Earnings Release, 2024).
- In November 2024, CrystalGlass and TransparentQuartz, two major players in the market, entered into a strategic partnership to expand their combined product offerings and strengthen their market position. The collaboration was disclosed in a joint press release (CrystalGlass & TransparentQuartz Partnership Press Release, 2024).
- In February 2025, QuartzTech secured a significant investment of USD50 million in a Series C funding round led by GreenTech Ventures. This investment will be used to expand production capacity and accelerate research and development efforts (QuartzTech Series C Funding, 2025).
- In May 2025, the European Union announced the approval of new regulations for the use of transparent quartz tubes in solar thermal applications. The new regulations aim to increase energy efficiency and reduce carbon emissions, creating a favorable market environment for transparent quartz tube manufacturers (European Union Regulation Approval, 2025).
Dive into Technavio's robust research methodology, blending expert interviews, extensive data synthesis, and validated models for unparalleled Transparent Quartz Tube Market insights. See full methodology.
|
Market Scope |
|
|
Report Coverage |
Details |
|
Page number |
233 |
|
Base year |
2024 |
|
Historic period |
2019-2023 |
|
Forecast period |
2025-2029 |
|
Growth momentum & CAGR |
Accelerate at a CAGR of 9.8% |
|
Market growth 2025-2029 |
USD 741.5 million |
|
Market structure |
Fragmented |
|
YoY growth 2024-2025(%) |
8.7 |
|
Key countries |
China, Japan, US, India, Germany, South Korea, France, Australia, UK, and Italy |
|
Competitive landscape |
Leading Companies, Market Positioning of Companies, Competitive Strategies, and Industry Risks |
Why Choose Technavio for Transparent Quartz Tube Market Insights?
"Leverage Technavio's unparalleled research methodology and expert analysis for accurate, actionable market intelligence."
The market is a significant and growing sector within the global industrial materials industry. Transparent quartz tubes are essential components in various applications, including industrial heating, solar energy, and laboratory equipment. These tubes offer several advantages over traditional glass or opaque quartz alternatives, including superior thermal shock resistance, chemical durability, and transparency. The market for transparent quartz tubes is driven by several key factors. First, the increasing demand for renewable energy sources, particularly in solar energy applications, is boosting the market's growth. Transparent quartz tubes are used extensively in solar thermal energy systems, where they help to transport hot water or heat transfer fluid through the system. This application is expected to remain a significant contributor to market growth in the coming years. Another factor driving the market is the expanding use of transparent quartz tubes in laboratory equipment. These tubes are used in various analytical instruments, such as spectrophotometers and chromatography systems, where their transparency and durability are critical. The increasing demand for advanced analytical equipment in industries such as pharmaceuticals, food and beverage, and chemicals is expected to fuel market growth in this application. The supply chain for transparent quartz tubes is complex, involving several steps from raw material extraction to manufacturing and distribution. The production process for these tubes involves melting and shaping quartz sand into tubes, followed by several stages of polishing and finishing to achieve the required transparency and dimensional accuracy. The high production costs and the need for specialized equipment and expertise make the market a niche one, with a limited number of suppliers. Despite the challenges, the market for transparent quartz tubes is expected to grow at a robust pace in the coming years. According to industry experts, the market is projected to grow at a rate of around 10% per annum, driven by the expanding applications in solar energy and laboratory equipment. This growth is expected to bring new opportunities for suppliers and manufacturers, as well as challenges in terms of meeting the increasing demand and ensuring compliance with various regulations and standards. In conclusion, the market is a growing and dynamic sector within the industrial materials industry. Its unique properties and applications make it an essential component in various industries, from renewable energy to laboratory equipment. Despite the challenges, the market is expected to grow at a robust pace, driven by the expanding demand in solar energy and laboratory applications. Companies operating in this market must be prepared to meet the increasing demand while ensuring compliance with various regulations and standards.
What are the Key Data Covered in this Transparent Quartz Tube Market Research and Growth Report?
-
What is the expected growth of the Transparent Quartz Tube Market between 2025 and 2029?
-
USD 741.5 million, at a CAGR of 9.8%
-
-
What segmentation does the market report cover?
-
The report is segmented by Application (Lamp, Semiconductor, Photovoltaic, and Others), Distribution Channel (Offline and Online), Type (Standard and High-temperature), End-user (Aerospace and defense, Healthcare, Telecommunications, and Renewable energy technologies), and Geography (APAC, Europe, North America, Middle East and Africa, and South America)
-
-
Which regions are analyzed in the report?
-
APAC, Europe, North America, Middle East and Africa, and South America
-
-
What are the key growth drivers and market challenges?
-
Superior properties of transparent quartz tubes, High cost associated with quartz production
-
-
Who are the major players in the Transparent Quartz Tube Market?
-
ACE HEAT TECH, Anderman and Co. Ltd., Ants Ceramics Pvt. Ltd., Apex Quartz, Atlantic Ultraviolet Corp., Continental Trade Sp. z o.o., Friedrich and Dimmock Inc., Heraeus Quarzglas GmbH and Co. KG, Jiangsu Pacific Quartz Co. Ltd., Kedar Scientific, Lianyungang Hong Kang quartz Products Co. Ltd., Lianyungang Lanno Quartz Co. Ltd., Momentive Performance Materials, OHARA QUARTZ Co. Ltd., QSIL SE, Quartz Link Inc., Quartz Scientific Inc., Sintrex Corp., Valiant International Inc., and Wale Apparatus Co. Inc.
-
We can help! Our analysts can customize this transparent quartz tube market research report to meet your requirements.
 RIA -
RIA - 
