Travel And Expense Management Software Market Analysis, Size, and Forecast 2026-2030: North America (US, Canada, and Mexico), Europe (Germany, UK, and France), APAC (China, Japan, and India), South America (Brazil and Argentina), Middle East and Africa (UAE, Saudi Arabia, and South Africa), and Rest of World (ROW)

Travel And Expense Management Software Market Analysis, Size, and Forecast 2026-2030:
North America (US, Canada, and Mexico), Europe (Germany, UK, and France), APAC (China, Japan, and India), South America (Brazil and Argentina), Middle East and Africa (UAE, Saudi Arabia, and South Africa), and Rest of World (ROW)

Published: Mar 2026 298 Pages SKU: IRTNTR41551

Market Overview at a Glance

$3.27 B
Market Opportunity
10.4%
CAGR 2025 - 2030
29.4%
North America Growth
$4.25 B
On-premises segment 2024

Travel And Expense Management Software Market Size 2026-2030

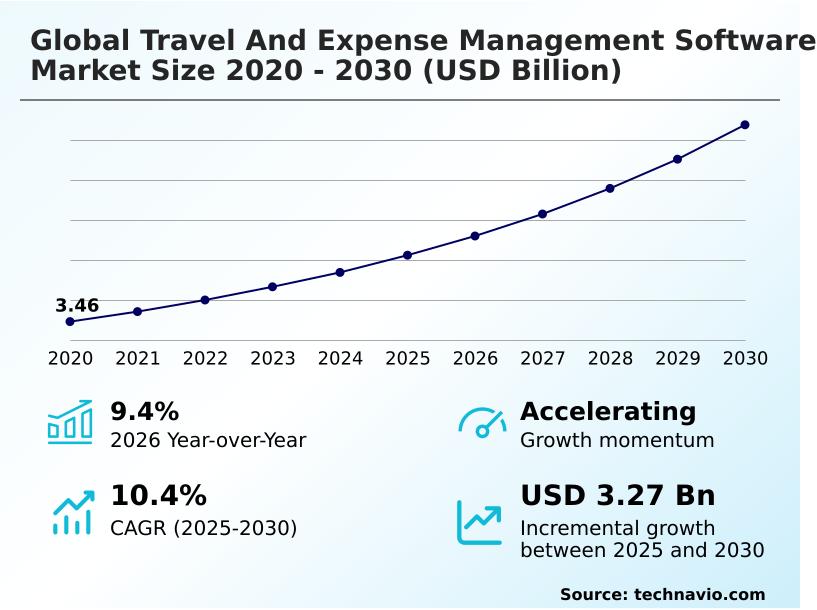
The travel and expense management software market size is valued to increase by USD 3.27 billion, at a CAGR of 10.4% from 2025 to 2030. Strategic integration of AI and automated data extraction will drive the travel and expense management software market.

Major Market Trends & Insights

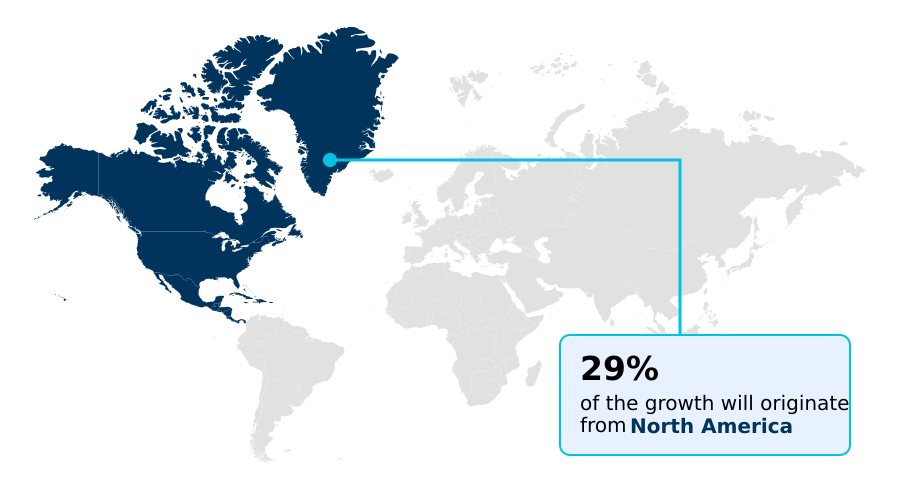
  • North America dominated the market and accounted for a 29.4% growth during the forecast period.
  • By Deployment - On-premises segment was valued at USD 4.25 billion in 2024
  • By Application - Transportation and logistics segment accounted for the largest market revenue share in 2024

Market Size & Forecast

  • Market Opportunities: USD 4.93 billion
  • Market Future Opportunities: USD 3.27 billion
  • CAGR from 2025 to 2030 : 10.4%

Market Summary

  • The travel and expense management software market is undergoing a significant transformation, moving from manual, error-prone administrative tools to intelligent, automated platforms. This evolution is driven by the strategic integration of generative artificial intelligence and machine learning models, which enable proactive financial governance and operational efficiency.
  • The market is defined by a trend toward unified ecosystems that combine travel booking, expense reporting, and payment processing into a single, seamless workflow. This consolidation provides real-time spend visibility and enhances policy compliance.
  • For instance, a multinational logistics firm can leverage these integrated platforms to automate mileage tracking and expense capture for its fleet, ensuring adherence to corporate policy and local tax regulations across different regions. However, the industry faces challenges related to legacy ERP integration and ensuring data privacy across multiple jurisdictions.
  • The emphasis on user experience, mobile-first accessibility, and automated fraud detection continues to shape the competitive landscape, as organizations seek solutions that reduce administrative burden while providing robust financial control.

What will be the Size of the Travel And Expense Management Software Market during the forecast period?

Get Key Insights on Market Forecast (PDF) Request Free Sample

How is the Travel And Expense Management Software Market Segmented?

The travel and expense management software industry research report provides comprehensive data (region-wise segment analysis), with forecasts and estimates in "USD million" for the period 2026-2030, as well as historical data from 2020-2024 for the following segments.

  • Deployment
    • On-premises
    • SaaS-based
  • Application
    • Transportation and logistics
    • Government and defense
    • Energy and utilities
    • Healthcare
    • Others
  • Sector
    • Large enterprises
    • SMEs
  • Geography
    • North America
      • US
      • Canada
      • Mexico
    • Europe
      • Germany
      • UK
      • France
    • APAC
      • China
      • Japan
      • India
    • South America
      • Brazil
      • Argentina
    • Middle East and Africa
      • UAE
      • Saudi Arabia
      • South Africa
    • Rest of World (ROW)

By Deployment Insights

The on-premises segment is estimated to witness significant growth during the forecast period.

The on-premises segment of the travel and expense management software market remains critical for organizations prioritizing absolute data sovereignty, particularly in sectors like government and defense.

This deployment model ensures compliance with stringent internal security protocols by keeping all financial information behind a corporate firewall.

Such solutions provide the deep customization needed for seamless legacy ERP integration and offer a high-speed, low-latency environment that enables complex back-end reconciliation.

The implementation of localized machine learning models within this framework facilitates the identification of anomalous expenses through digital transaction analysis.

This allows for proactive financial governance and has been shown to reduce manual audit tasks by up to 30%, aligning with a capital expenditure model favored by large enterprises with existing data center investments and a need for immutable expenditure trails.

Request Free Sample

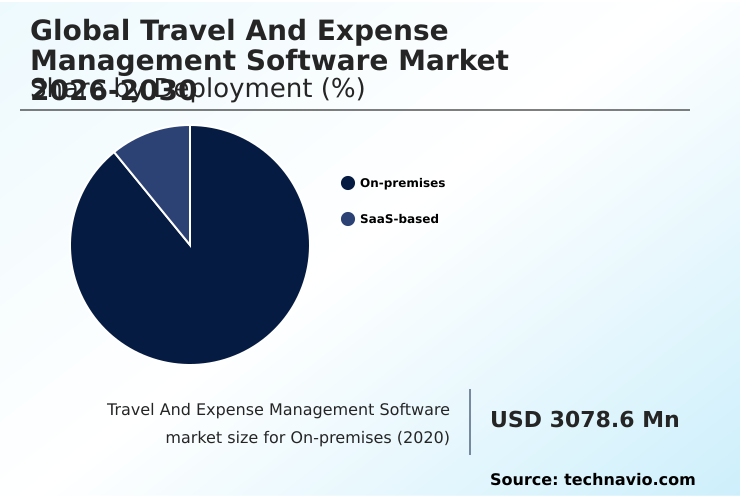
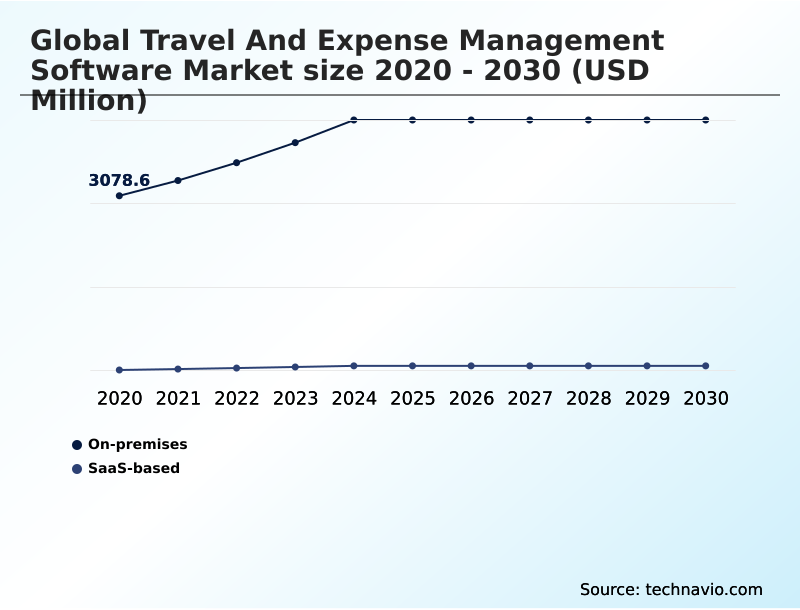
The On-premises segment was valued at USD 4.25 billion in 2024 and showed a gradual increase during the forecast period.

Request Free Sample

Regional Analysis

North America is estimated to contribute 29.4% to the growth of the global market during the forecast period.Technavio’s analysts have elaborately explained the regional trends and drivers that shape the market during the forecast period.

See How Travel And Expense Management Software Market Demand is Rising in North America Request Free Sample

The market's geographic dynamics are characterized by mature adoption in North America and rapid growth in the APAC region.

North America accounts for over 29% of the incremental growth opportunity, driven by a focus on AI-driven auditing and fraud detection algorithms.

Meanwhile, the high smartphone penetration in APAC has accelerated the adoption of mobile-first expense reporting, which improves submission times by over 50%.

European organizations are prioritizing solutions with robust local tax engines and multi-currency support to manage value-added tax recovery and comply with regional labor laws.

Across all regions, the demand for platforms that provide a single source of truth and automate back-end reconciliation is universal. This global push for efficiency and compliance is reshaping how enterprises approach corporate spend management and proactive financial governance.

Market Dynamics

Our researchers analyzed the data with 2025 as the base year, along with the key drivers, trends, and challenges. A holistic analysis of drivers will help companies refine their marketing strategies to gain a competitive advantage.

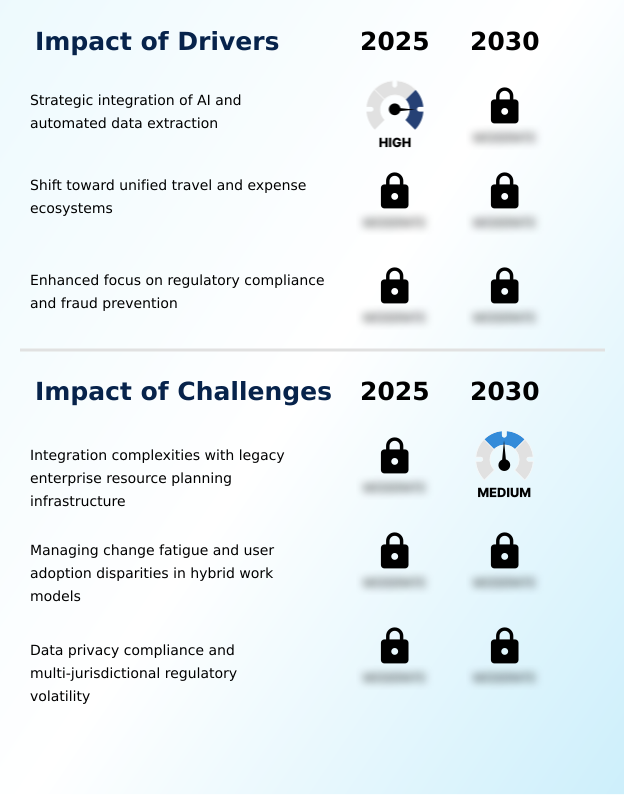
  • The strategic evolution of the travel and expense management software market hinges on integrating AI for automated expense auditing, which elevates platforms beyond simple reporting tools. This capability is most effective within unified travel and expense reporting platforms that consolidate disparate financial data streams.
  • A key enabler of this consolidation is mobile receipt capture for real-time submission, a feature that significantly improves both data accuracy and user experience. To further enhance financial control, organizations are automating policy compliance with virtual cards, which enforce spending rules at the point of sale. This shift toward proactive spend control with embedded finance is redefining corporate budgeting.
  • Concurrently, managing multi-jurisdictional tax compliance software has become a critical function, alongside ensuring GDPR compliance in expense management to avoid regulatory penalties. Advanced platforms are also focused on mitigating fraud with ML-based algorithms that identify anomalies traditional audits might miss. However, successful deployment still depends on overcoming legacy ERP integration for expense software and improving user adoption of T&E software.
  • Organizations that master these elements report reimbursement cycles that are twice as fast as those relying on manual processes.

What are the key market drivers leading to the rise in the adoption of Travel And Expense Management Software Industry?

  • The strategic integration of artificial intelligence for automating data extraction and processing is a key driver of market growth.

  • Market growth is significantly driven by the adoption of generative artificial intelligence and automated data extraction, which underpin the shift toward a unified travel and expense ecosystem.
  • These technologies enable proactive financial governance and provide predictive travel insights, helping organizations optimize budgets. The move to a single source of truth for all travel data has improved data integrity by over 95% in many firms.
  • Furthermore, advanced machine learning models facilitate natural language interaction with software platforms, reducing manual data entry.
  • This automation streamlines back-end reconciliation and supports a more efficient end-to-end travel experience, directly addressing the need for enhanced operational oversight and strategic financial planning.

What are the market trends shaping the Travel And Expense Management Software Industry?

  • The market is increasingly shaped by the emergence of embedded finance and native virtual card solutions. These innovations are shifting expense management from a reactive reimbursement process to proactive, policy-driven spend control at the point of sale.

  • Key market trends are centered on the integration of embedded finance and native virtual card solutions, which facilitate proactive spend control. This shift toward autonomous spend management is enhanced by AI-driven auditing and the adoption of low-code development platforms, enabling more agile and customized solutions.
  • Modern systems provide real-time spend data, allowing for immediate transaction analysis and automated policy compliance, with some platforms reducing non-compliant spending by up to 20%. The use of corporate banking apps is also becoming more prevalent, offering a seamless end-to-end travel experience.
  • Additionally, the move toward agentic assistance and optical character recognition has streamlined expense submissions, improving user adoption rates by 30% in some enterprises.

What challenges does the Travel And Expense Management Software Industry face during its growth?

  • A primary challenge affecting industry growth is the integration complexity between modern software and legacy enterprise resource planning infrastructure.

  • Primary market challenges include legacy ERP integration issues and ensuring data privacy compliance across multiple regions. The lack of a standardized API in older systems can delay project rollouts by over six months, hindering the implementation of modern, cloud-native platforms.
  • Concurrently, managing change fatigue and user adoption disparities remains a significant hurdle, with some global firms reporting that nearly 30% of employees revert to manual processes. Navigating multi-jurisdictional regulations and data residency requirements adds further complexity, as does the risk of unauthorized booking channels, which undermines corporate negotiation power.
  • These factors collectively temper the pace of digital transformation in corporate spend management.

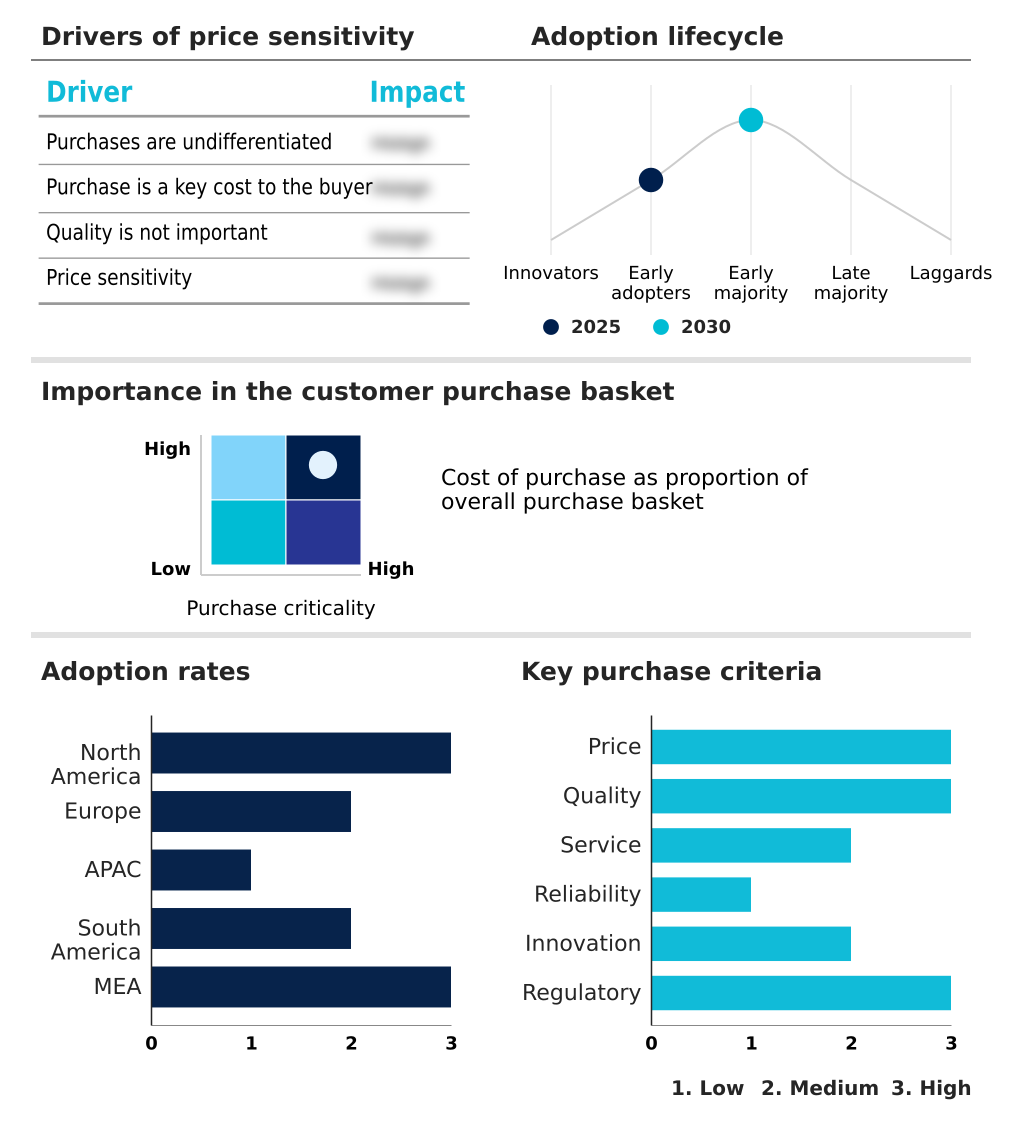
Exclusive Technavio Analysis on Customer Landscape

The travel and expense management software market forecasting report includes the adoption lifecycle of the market, covering from the innovator’s stage to the laggard’s stage. It focuses on adoption rates in different regions based on penetration. Furthermore, the travel and expense management software market report also includes key purchase criteria and drivers of price sensitivity to help companies evaluate and develop their market growth analysis strategies.

Customer Landscape of Travel And Expense Management Software Industry

Competitive Landscape

Companies are implementing various strategies, such as strategic alliances, travel and expense management software market forecast, partnerships, mergers and acquisitions, geographical expansion, and product/service launches, to enhance their presence in the industry.

Amadeus IT Group SA - Delivers AI-powered, unified travel and expense platforms that automate financial governance and provide end-to-end corporate spend visibility for global enterprises.

The industry research and growth report includes detailed analyses of the competitive landscape of the market and information about key companies, including:

  • Amadeus IT Group SA
  • Apptricity
  • Bill.com LLC
  • Brex Payments LLC
  • Coupa Software Inc.
  • Emburse Inc.
  • Expense8
  • Expensify Inc.
  • Finly Technology Pvt. Ltd.
  • Fyle Technologies Pvt. Ltd.
  • Infor Inc.
  • Navan Inc.
  • Oracle Corp.
  • Ramp Business Corp.
  • Rydoo NV
  • SAP SE
  • Spendesk
  • Workday Inc.
  • Zoho Corp. Pvt. Ltd.

Qualitative and quantitative analysis of companies has been conducted to help clients understand the wider business environment as well as the strengths and weaknesses of key industry players. Data is qualitatively analyzed to categorize companies as pure play, category-focused, industry-focused, and diversified; it is quantitatively analyzed to categorize companies as dominant, leading, strong, tentative, and weak.

Recent Development and News in Travel and expense management software market

  • In September 2025, American Express Global Business Travel finalized its acquisition of CWT, a strategic move that significantly consolidated the competitive landscape by merging two major players to create a more powerful, technology-driven service offering.
  • In March 2025, SAP SE announced the general availability of its generative AI copilot, Joule, for its SAP Concur solutions, enabling users to manage bookings and submit expenses through natural language interactions to enhance efficiency.
  • In November 2025, Coupa Software Inc. announced the launch of the Coupa Card, a new virtual card solution embedded within its spend management platform to help organizations manage supplier payments and employee expenses through a singular source.
  • In August 2025, Expensify Inc. confirmed its planned launch of corporate card and billing services for the Canadian market, aiming to address the specific financial needs of businesses in North America with localized product offerings.

Dive into Technavio’s robust research methodology, blending expert interviews, extensive data synthesis, and validated models for unparalleled Travel And Expense Management Software Market insights. See full methodology.

Market Scope
Page number 298
Base year 2025
Historic period 2020-2024
Forecast period 2026-2030
Growth momentum & CAGR Accelerate at a CAGR of 10.4%
Market growth 2026-2030 USD 3268.0 million
Market structure Fragmented
YoY growth 2025-2026(%) 9.4%
Key countries US, Canada, Mexico, Germany, UK, France, Italy, Spain, The Netherlands, China, Japan, India, South Korea, Australia, Singapore, Brazil, Argentina, Chile, UAE, Saudi Arabia, South Africa, Egypt and Nigeria
Competitive landscape Leading Companies, Market Positioning of Companies, Competitive Strategies, and Industry Risks

Request Free Sample

Research Analyst Overview

  • The travel and expense management software market is rapidly evolving from simple digitization toward intelligent automation, where generative artificial intelligence and autonomous software agents are foundational. This shift toward creating a unified travel and expense ecosystem represents a critical boardroom consideration, as it directly impacts financial visibility and operational agility.
  • Modern platforms now leverage sophisticated machine learning models for proactive financial governance, using automated data extraction from receipts and invoices to provide real-time spend visibility and policy violation flagging without human oversight. The integration of embedded finance components, such as corporate cards, with AI-driven auditing and sophisticated fraud detection algorithms is becoming a standard expectation.
  • For instance, firms utilizing these highly integrated systems have achieved a 30% reduction in expense processing time. This evolution, supported by API-first architectures and advanced multi-cloud management tools, is fundamentally changing the focus from retrospective reporting to proactive spend control and agentic assistance for a more streamlined financial workflow.

What are the Key Data Covered in this Travel And Expense Management Software Market Research and Growth Report?

  • What is the expected growth of the Travel And Expense Management Software Market between 2026 and 2030?

    • USD 3.27 billion, at a CAGR of 10.4%

  • What segmentation does the market report cover?

    • The report is segmented by Deployment (On-premises, and SaaS-based), Application (Transportation and logistics, Government and defense, Energy and utilities, Healthcare, and Others), Sector (Large enterprises, and SMEs) and Geography (North America, Europe, APAC, South America, Middle East and Africa)

  • Which regions are analyzed in the report?

    • North America, Europe, APAC, South America and Middle East and Africa

  • What are the key growth drivers and market challenges?

    • Strategic integration of AI and automated data extraction, Integration complexities with legacy enterprise resource planning infrastructure

  • Who are the major players in the Travel And Expense Management Software Market?

    • Amadeus IT Group SA, Apptricity, Bill.com LLC, Brex Payments LLC, Coupa Software Inc., Emburse Inc., Expense8, Expensify Inc., Finly Technology Pvt. Ltd., Fyle Technologies Pvt. Ltd., Infor Inc., Navan Inc., Oracle Corp., Ramp Business Corp., Rydoo NV, SAP SE, Spendesk, Workday Inc. and Zoho Corp. Pvt. Ltd.

Market Research Insights

  • The market's momentum is defined by a strategic push for greater efficiency and financial control. The adoption of mobile-first expense reporting has driven a 40% reduction in submission times, while platforms offering proactive spend control through embedded finance can cut non-compliant spending by over 25%.
  • Achieving these outcomes hinges on overcoming hurdles like legacy ERP integration and ensuring a seamless end-to-end travel experience. Solutions providing a single source of truth for all transactions are becoming critical for data integrity. The focus on automated receipt capture and real-time policy violation flagging further enhances financial oversight, with leading systems achieving 99% accuracy in data extraction.
  • This shift toward intelligent automation underscores the industry's move from reactive reporting to proactive governance.

We can help! Our analysts can customize this travel and expense management software market research report to meet your requirements.

Get in touch

1. Executive Summary

1.1 Market overview

Executive Summary - Chart on Market Overview
Executive Summary - Data Table on Market Overview
Executive Summary - Chart on Global Market Characteristics
Executive Summary - Chart on Market by Geography
Executive Summary - Chart on Market Segmentation by Deployment
Executive Summary - Chart on Market Segmentation by Application
Executive Summary - Chart on Market Segmentation by Sector
Executive Summary - Chart on Incremental Growth
Executive Summary - Data Table on Incremental Growth
Executive Summary - Chart on Company Market Positioning

2. Technavio Analysis

2.1 Analysis of price sensitivity, lifecycle, customer purchase basket, adoption rates, and purchase criteria

2.2 Criticality of inputs and Factors of differentiation

Chart on Overview on criticality of inputs and factors of differentiation

2.3 Factors of disruption

Chart on Overview on factors of disruption

2.4 Impact of drivers and challenges

Chart on Impact of drivers and challenges in 2025 and 2030

3. Market Landscape

3.1 Market ecosystem

Chart on Parent Market
Data Table on - Parent Market

3.2 Market characteristics

Chart on Market characteristics analysis

3.3 Value chain analysis

Chart on Value chain analysis

4. Market Sizing

4.1 Market definition

Data Table on Offerings of companies included in the market definition

4.2 Market segment analysis

Market segments

4.3 Market size 2025

4.4 Market outlook: Forecast for 2025-2030

Chart on Global - Market size and forecast 2025-2030 ($ million)
Data Table on Global - Market size and forecast 2025-2030 ($ million)
Chart on Global Market: Year-over-year growth 2025-2030 (%)
Data Table on Global Market: Year-over-year growth 2025-2030 (%)

5. Historic Market Size

5.1 Global Travel And Expense Management Software Market 2020 - 2024

Historic Market Size - Data Table on Global Travel And Expense Management Software Market 2020 - 2024 ($ million)

5.2 Deployment segment analysis 2020 - 2024

Historic Market Size - Deployment Segment 2020 - 2024 ($ million)

5.3 Application segment analysis 2020 - 2024

Historic Market Size - Application Segment 2020 - 2024 ($ million)

5.4 Sector segment analysis 2020 - 2024

Historic Market Size - Sector Segment 2020 - 2024 ($ million)

5.5 Geography segment analysis 2020 - 2024

Historic Market Size - Geography Segment 2020 - 2024 ($ million)

5.6 Country segment analysis 2020 - 2024

Historic Market Size - Country Segment 2020 - 2024 ($ million)

6. Qualitative Analysis

6.1 Impact of AI on Global Travel and Expense Management Software Market

6.2 Impact of Geopolitical Conflict on Global Travel and Expense Management Software Market

7. Five Forces Analysis

7.1 Five forces summary

Five forces analysis - Comparison between 2025 and 2030

7.2 Bargaining power of buyers

Bargaining power of buyers - Impact of key factors 2025 and 2030

7.3 Bargaining power of suppliers

Bargaining power of suppliers - Impact of key factors in 2025 and 2030

7.4 Threat of new entrants

Threat of new entrants - Impact of key factors in 2025 and 2030

7.5 Threat of substitutes

Threat of substitutes - Impact of key factors in 2025 and 2030

7.6 Threat of rivalry

Threat of rivalry - Impact of key factors in 2025 and 2030

7.7 Market condition

Chart on Market condition - Five forces 2025 and 2030

8. Market Segmentation by Deployment

8.1 Market segments

Chart on Deployment - Market share 2025-2030 (%)
Data Table on Deployment - Market share 2025-2030 (%)

8.2 Comparison by Deployment

Chart on Comparison by Deployment
Data Table on Comparison by Deployment

8.3 On-premises - Market size and forecast 2025-2030

Chart on On-premises - Market size and forecast 2025-2030 ($ million)
Data Table on On-premises - Market size and forecast 2025-2030 ($ million)
Chart on On-premises - Year-over-year growth 2025-2030 (%)
Data Table on On-premises - Year-over-year growth 2025-2030 (%)

8.4 SaaS-based - Market size and forecast 2025-2030

Chart on SaaS-based - Market size and forecast 2025-2030 ($ million)
Data Table on SaaS-based - Market size and forecast 2025-2030 ($ million)
Chart on SaaS-based - Year-over-year growth 2025-2030 (%)
Data Table on SaaS-based - Year-over-year growth 2025-2030 (%)

8.5 Market opportunity by Deployment

Market opportunity by Deployment ($ million)
Data Table on Market opportunity by Deployment ($ million)

9. Market Segmentation by Application

9.1 Market segments

Chart on Application - Market share 2025-2030 (%)
Data Table on Application - Market share 2025-2030 (%)

9.2 Comparison by Application

Chart on Comparison by Application
Data Table on Comparison by Application

9.3 Transportation and logistics - Market size and forecast 2025-2030

Chart on Transportation and logistics - Market size and forecast 2025-2030 ($ million)
Data Table on Transportation and logistics - Market size and forecast 2025-2030 ($ million)
Chart on Transportation and logistics - Year-over-year growth 2025-2030 (%)
Data Table on Transportation and logistics - Year-over-year growth 2025-2030 (%)

9.4 Government and defense - Market size and forecast 2025-2030

Chart on Government and defense - Market size and forecast 2025-2030 ($ million)
Data Table on Government and defense - Market size and forecast 2025-2030 ($ million)
Chart on Government and defense - Year-over-year growth 2025-2030 (%)
Data Table on Government and defense - Year-over-year growth 2025-2030 (%)

9.5 Energy and utilities - Market size and forecast 2025-2030

Chart on Energy and utilities - Market size and forecast 2025-2030 ($ million)
Data Table on Energy and utilities - Market size and forecast 2025-2030 ($ million)
Chart on Energy and utilities - Year-over-year growth 2025-2030 (%)
Data Table on Energy and utilities - Year-over-year growth 2025-2030 (%)

9.6 Healthcare - Market size and forecast 2025-2030

Chart on Healthcare - Market size and forecast 2025-2030 ($ million)
Data Table on Healthcare - Market size and forecast 2025-2030 ($ million)
Chart on Healthcare - Year-over-year growth 2025-2030 (%)
Data Table on Healthcare - Year-over-year growth 2025-2030 (%)

9.7 Others - Market size and forecast 2025-2030

Chart on Others - Market size and forecast 2025-2030 ($ million)
Data Table on Others - Market size and forecast 2025-2030 ($ million)
Chart on Others - Year-over-year growth 2025-2030 (%)
Data Table on Others - Year-over-year growth 2025-2030 (%)

9.8 Market opportunity by Application

Market opportunity by Application ($ million)
Data Table on Market opportunity by Application ($ million)

10. Market Segmentation by Sector

10.1 Market segments

Chart on Sector - Market share 2025-2030 (%)
Data Table on Sector - Market share 2025-2030 (%)

10.2 Comparison by Sector

Chart on Comparison by Sector
Data Table on Comparison by Sector

10.3 Large enterprises - Market size and forecast 2025-2030

Chart on Large enterprises - Market size and forecast 2025-2030 ($ million)
Data Table on Large enterprises - Market size and forecast 2025-2030 ($ million)
Chart on Large enterprises - Year-over-year growth 2025-2030 (%)
Data Table on Large enterprises - Year-over-year growth 2025-2030 (%)

10.4 SMEs - Market size and forecast 2025-2030

Chart on SMEs - Market size and forecast 2025-2030 ($ million)
Data Table on SMEs - Market size and forecast 2025-2030 ($ million)
Chart on SMEs - Year-over-year growth 2025-2030 (%)
Data Table on SMEs - Year-over-year growth 2025-2030 (%)

10.5 Market opportunity by Sector

Market opportunity by Sector ($ million)
Data Table on Market opportunity by Sector ($ million)

11. Customer Landscape

11.1 Customer landscape overview

Analysis of price sensitivity, lifecycle, customer purchase basket, adoption rates, and purchase criteria

12. Geographic Landscape

12.1 Geographic segmentation

Chart on Market share by geography 2025-2030 (%)
Data Table on Market share by geography 2025-2030 (%)

12.2 Geographic comparison

Chart on Geographic comparison
Data Table on Geographic comparison

12.3 North America - Market size and forecast 2025-2030

Chart on North America - Market size and forecast 2025-2030 ($ million)
Data Table on North America - Market size and forecast 2025-2030 ($ million)
Chart on North America - Year-over-year growth 2025-2030 (%)
Data Table on North America - Year-over-year growth 2025-2030 (%)
Chart on Regional Comparison - North America
Data Table on Regional Comparison - North America

12.3.1 US - Market size and forecast 2025-2030

Chart on US - Market size and forecast 2025-2030 ($ million)
Data Table on US - Market size and forecast 2025-2030 ($ million)
Chart on US - Year-over-year growth 2025-2030 (%)
Data Table on US - Year-over-year growth 2025-2030 (%)

12.3.2 Canada - Market size and forecast 2025-2030

Chart on Canada - Market size and forecast 2025-2030 ($ million)
Data Table on Canada - Market size and forecast 2025-2030 ($ million)
Chart on Canada - Year-over-year growth 2025-2030 (%)
Data Table on Canada - Year-over-year growth 2025-2030 (%)

12.3.3 Mexico - Market size and forecast 2025-2030

Chart on Mexico - Market size and forecast 2025-2030 ($ million)
Data Table on Mexico - Market size and forecast 2025-2030 ($ million)
Chart on Mexico - Year-over-year growth 2025-2030 (%)
Data Table on Mexico - Year-over-year growth 2025-2030 (%)

12.4 Europe - Market size and forecast 2025-2030

Chart on Europe - Market size and forecast 2025-2030 ($ million)
Data Table on Europe - Market size and forecast 2025-2030 ($ million)
Chart on Europe - Year-over-year growth 2025-2030 (%)
Data Table on Europe - Year-over-year growth 2025-2030 (%)
Chart on Regional Comparison - Europe
Data Table on Regional Comparison - Europe

12.4.1 Germany - Market size and forecast 2025-2030

Chart on Germany - Market size and forecast 2025-2030 ($ million)
Data Table on Germany - Market size and forecast 2025-2030 ($ million)
Chart on Germany - Year-over-year growth 2025-2030 (%)
Data Table on Germany - Year-over-year growth 2025-2030 (%)

12.4.2 UK - Market size and forecast 2025-2030

Chart on UK - Market size and forecast 2025-2030 ($ million)
Data Table on UK - Market size and forecast 2025-2030 ($ million)
Chart on UK - Year-over-year growth 2025-2030 (%)
Data Table on UK - Year-over-year growth 2025-2030 (%)

12.4.3 France - Market size and forecast 2025-2030

Chart on France - Market size and forecast 2025-2030 ($ million)
Data Table on France - Market size and forecast 2025-2030 ($ million)
Chart on France - Year-over-year growth 2025-2030 (%)
Data Table on France - Year-over-year growth 2025-2030 (%)

12.4.4 Italy - Market size and forecast 2025-2030

Chart on Italy - Market size and forecast 2025-2030 ($ million)
Data Table on Italy - Market size and forecast 2025-2030 ($ million)
Chart on Italy - Year-over-year growth 2025-2030 (%)
Data Table on Italy - Year-over-year growth 2025-2030 (%)

12.4.5 Spain - Market size and forecast 2025-2030

Chart on Spain - Market size and forecast 2025-2030 ($ million)
Data Table on Spain - Market size and forecast 2025-2030 ($ million)
Chart on Spain - Year-over-year growth 2025-2030 (%)
Data Table on Spain - Year-over-year growth 2025-2030 (%)

12.4.6 The Netherlands - Market size and forecast 2025-2030

Chart on The Netherlands - Market size and forecast 2025-2030 ($ million)
Data Table on The Netherlands - Market size and forecast 2025-2030 ($ million)
Chart on The Netherlands - Year-over-year growth 2025-2030 (%)
Data Table on The Netherlands - Year-over-year growth 2025-2030 (%)

12.5 APAC - Market size and forecast 2025-2030

Chart on APAC - Market size and forecast 2025-2030 ($ million)
Data Table on APAC - Market size and forecast 2025-2030 ($ million)
Chart on APAC - Year-over-year growth 2025-2030 (%)
Data Table on APAC - Year-over-year growth 2025-2030 (%)
Chart on Regional Comparison - APAC
Data Table on Regional Comparison - APAC

12.5.1 China - Market size and forecast 2025-2030

Chart on China - Market size and forecast 2025-2030 ($ million)
Data Table on China - Market size and forecast 2025-2030 ($ million)
Chart on China - Year-over-year growth 2025-2030 (%)
Data Table on China - Year-over-year growth 2025-2030 (%)

12.5.2 Japan - Market size and forecast 2025-2030

Chart on Japan - Market size and forecast 2025-2030 ($ million)
Data Table on Japan - Market size and forecast 2025-2030 ($ million)
Chart on Japan - Year-over-year growth 2025-2030 (%)
Data Table on Japan - Year-over-year growth 2025-2030 (%)

12.5.3 India - Market size and forecast 2025-2030

Chart on India - Market size and forecast 2025-2030 ($ million)
Data Table on India - Market size and forecast 2025-2030 ($ million)
Chart on India - Year-over-year growth 2025-2030 (%)
Data Table on India - Year-over-year growth 2025-2030 (%)

12.5.4 South Korea - Market size and forecast 2025-2030

Chart on South Korea - Market size and forecast 2025-2030 ($ million)
Data Table on South Korea - Market size and forecast 2025-2030 ($ million)
Chart on South Korea - Year-over-year growth 2025-2030 (%)
Data Table on South Korea - Year-over-year growth 2025-2030 (%)

12.5.5 Australia - Market size and forecast 2025-2030

Chart on Australia - Market size and forecast 2025-2030 ($ million)
Data Table on Australia - Market size and forecast 2025-2030 ($ million)
Chart on Australia - Year-over-year growth 2025-2030 (%)
Data Table on Australia - Year-over-year growth 2025-2030 (%)

12.5.6 Singapore - Market size and forecast 2025-2030

Chart on Singapore - Market size and forecast 2025-2030 ($ million)
Data Table on Singapore - Market size and forecast 2025-2030 ($ million)
Chart on Singapore - Year-over-year growth 2025-2030 (%)
Data Table on Singapore - Year-over-year growth 2025-2030 (%)

12.6 South America - Market size and forecast 2025-2030

Chart on South America - Market size and forecast 2025-2030 ($ million)
Data Table on South America - Market size and forecast 2025-2030 ($ million)
Chart on South America - Year-over-year growth 2025-2030 (%)
Data Table on South America - Year-over-year growth 2025-2030 (%)
Chart on Regional Comparison - South America
Data Table on Regional Comparison - South America

12.6.1 Brazil - Market size and forecast 2025-2030

Chart on Brazil - Market size and forecast 2025-2030 ($ million)
Data Table on Brazil - Market size and forecast 2025-2030 ($ million)
Chart on Brazil - Year-over-year growth 2025-2030 (%)
Data Table on Brazil - Year-over-year growth 2025-2030 (%)

12.6.2 Argentina - Market size and forecast 2025-2030

Chart on Argentina - Market size and forecast 2025-2030 ($ million)
Data Table on Argentina - Market size and forecast 2025-2030 ($ million)
Chart on Argentina - Year-over-year growth 2025-2030 (%)
Data Table on Argentina - Year-over-year growth 2025-2030 (%)

12.6.3 Chile - Market size and forecast 2025-2030

Chart on Chile - Market size and forecast 2025-2030 ($ million)
Data Table on Chile - Market size and forecast 2025-2030 ($ million)
Chart on Chile - Year-over-year growth 2025-2030 (%)
Data Table on Chile - Year-over-year growth 2025-2030 (%)

12.7 Middle East and Africa - Market size and forecast 2025-2030

Chart on Middle East and Africa - Market size and forecast 2025-2030 ($ million)
Data Table on Middle East and Africa - Market size and forecast 2025-2030 ($ million)
Chart on Middle East and Africa - Year-over-year growth 2025-2030 (%)
Data Table on Middle East and Africa - Year-over-year growth 2025-2030 (%)
Chart on Regional Comparison - Middle East and Africa
Data Table on Regional Comparison - Middle East and Africa

12.7.1 UAE - Market size and forecast 2025-2030

Chart on UAE - Market size and forecast 2025-2030 ($ million)
Data Table on UAE - Market size and forecast 2025-2030 ($ million)
Chart on UAE - Year-over-year growth 2025-2030 (%)
Data Table on UAE - Year-over-year growth 2025-2030 (%)

12.7.2 Saudi Arabia - Market size and forecast 2025-2030

Chart on Saudi Arabia - Market size and forecast 2025-2030 ($ million)
Data Table on Saudi Arabia - Market size and forecast 2025-2030 ($ million)
Chart on Saudi Arabia - Year-over-year growth 2025-2030 (%)
Data Table on Saudi Arabia - Year-over-year growth 2025-2030 (%)

12.7.3 South Africa - Market size and forecast 2025-2030

Chart on South Africa - Market size and forecast 2025-2030 ($ million)
Data Table on South Africa - Market size and forecast 2025-2030 ($ million)
Chart on South Africa - Year-over-year growth 2025-2030 (%)
Data Table on South Africa - Year-over-year growth 2025-2030 (%)

12.7.4 Egypt - Market size and forecast 2025-2030

Chart on Egypt - Market size and forecast 2025-2030 ($ million)
Data Table on Egypt - Market size and forecast 2025-2030 ($ million)
Chart on Egypt - Year-over-year growth 2025-2030 (%)
Data Table on Egypt - Year-over-year growth 2025-2030 (%)

12.7.5 Nigeria - Market size and forecast 2025-2030

Chart on Nigeria - Market size and forecast 2025-2030 ($ million)
Data Table on Nigeria - Market size and forecast 2025-2030 ($ million)
Chart on Nigeria - Year-over-year growth 2025-2030 (%)
Data Table on Nigeria - Year-over-year growth 2025-2030 (%)

12.8 Market opportunity by geography

Market opportunity by geography ($ million)
Data Tables on Market opportunity by geography ($ million)

13. Drivers, Challenges, and Opportunity

13.1 Market drivers

Strategic integration of AI and automated data extraction
Shift toward unified travel and expense ecosystems
Enhanced focus on regulatory compliance and fraud prevention

13.2 Market challenges

Integration complexities with legacy enterprise resource planning infrastructure
Managing change fatigue and user adoption disparities in hybrid work models
Data privacy compliance and multi-jurisdictional regulatory volatility

13.3 Impact of drivers and challenges

Impact of drivers and challenges in 2025 and 2030

13.4 Market opportunities

Emergence of embedded finance and native virtual card solutions
Resurgence of global business travel and strategic consolidations
Fraud detection using AL and ML integration

14. Competitive Landscape

14.1 Overview

14.2

Overview on criticality of inputs and factors of differentiation

14.3 Landscape disruption

Overview on factors of disruption

14.4 Industry risks

Impact of key risks on business

15. Competitive Analysis

15.1 Companies profiled

Companies covered

15.2 Company ranking index

15.3 Market positioning of companies

Matrix on companies position and classification

15.4 Amadeus IT Group SA

Amadeus IT Group SA - Overview
Amadeus IT Group SA - Business segments
Amadeus IT Group SA - Key news
Amadeus IT Group SA - Key offerings
Amadeus IT Group SA - Segment focus
SWOT

15.5 Apptricity

Apptricity - Overview
Apptricity - Product / Service
Apptricity - Key offerings
SWOT

15.6 Bill.com LLC

Bill.com LLC - Overview
Bill.com LLC - Product / Service
Bill.com LLC - Key offerings
SWOT

15.7 Coupa Software Inc.

Coupa Software Inc. - Overview
Coupa Software Inc. - Product / Service
Coupa Software Inc. - Key offerings
SWOT

15.8 Emburse Inc.

Emburse Inc. - Overview
Emburse Inc. - Product / Service
Emburse Inc. - Key offerings
SWOT

15.9 Expense8

Expense8 - Overview
Expense8 - Product / Service
Expense8 - Key offerings
SWOT

15.10 Finly Technology Pvt. Ltd.

Finly Technology Pvt. Ltd. - Overview
Finly Technology Pvt. Ltd. - Product / Service
Finly Technology Pvt. Ltd. - Key offerings
SWOT

15.11 Infor Inc.

Infor Inc. - Overview
Infor Inc. - Product / Service
Infor Inc. - Key offerings
SWOT

15.12 Navan Inc.

Navan Inc. - Overview
Navan Inc. - Product / Service
Navan Inc. - Key offerings
SWOT

15.13 Oracle Corp.

Oracle Corp. - Overview
Oracle Corp. - Business segments
Oracle Corp. - Key news
Oracle Corp. - Key offerings
Oracle Corp. - Segment focus
SWOT

15.14 Ramp Business Corp.

Ramp Business Corp. - Overview
Ramp Business Corp. - Product / Service
Ramp Business Corp. - Key offerings
SWOT

15.15 SAP SE

SAP SE - Overview
SAP SE - Business segments
SAP SE - Key news
SAP SE - Key offerings
SAP SE - Segment focus
SWOT

15.16 Spendesk

Spendesk - Overview
Spendesk - Product / Service
Spendesk - Key offerings
SWOT

15.17 Workday Inc.

Workday Inc. - Overview
Workday Inc. - Product / Service
Workday Inc. - Key news
Workday Inc. - Key offerings
SWOT

15.18 Zoho Corp. Pvt. Ltd.

Zoho Corp. Pvt. Ltd. - Overview
Zoho Corp. Pvt. Ltd. - Product / Service
Zoho Corp. Pvt. Ltd. - Key offerings
SWOT

16. Appendix

16.1 Scope of the report

Market definition
Objectives
Notes and caveats

16.2 Inclusions and exclusions checklist

Inclusions checklist
Exclusions checklist

16.3 Currency conversion rates for US$

16.4 Research methodology

16.5 Data procurement

Information sources

16.6 Data validation

16.7 Validation techniques employed for market sizing

16.8 Data synthesis

16.9 360 degree market analysis

16.10 List of abbreviations

Research Methodology

Technavio presents a detailed picture of the market by way of study, synthesis, and summation of data from multiple sources. The analysts have presented the various facets of the market with a particular focus on identifying the key industry influencers. The data thus presented is comprehensive, reliable, and the result of extensive research, both primary and secondary.

INFORMATION SOURCES

Primary sources

  • Manufacturers and suppliers
  • Channel partners
  • Industry experts
  • Strategic decision makers

Secondary sources

  • Industry journals and periodicals
  • Government data
  • Financial reports of key industry players
  • Historical data
  • Press releases

DATA ANALYSIS

Data Synthesis

  • Collation of data
  • Estimation of key figures
  • Analysis of derived insights

Data Validation

  • Triangulation with data models
  • Reference against proprietary databases
  • Corroboration with industry experts

REPORT WRITING

Qualitative

  • Market drivers
  • Market challenges
  • Market trends
  • Five forces analysis

Quantitative

  • Market size and forecast
  • Market segmentation
  • Geographical insights
  • Competitive landscape

Interested in this report?

Get your sample now to see our research methodology and insights!

Download Now

Frequently Asked Questions

Travel And Expense Management Software market growth will increase by USD 3268.0 million during 2026-2030.

The Travel And Expense Management Software market is expected to grow at a CAGR of 10.4% during 2026-2030.

Travel And Expense Management Software market is segmented by Deployment (On-premises, SaaS-based) Application (Transportation and logistics, Government and defense, Energy and utilities, Healthcare, Others) Sector (Large enterprises, SMEs)

Amadeus IT Group SA, Apptricity, Bill.com LLC, Brex Payments LLC, Coupa Software Inc., Emburse Inc., Expense8, Expensify Inc., Finly Technology Pvt. Ltd., Fyle Technologies Pvt. Ltd., Infor Inc., Navan Inc., Oracle Corp., Ramp Business Corp., Rydoo NV, SAP SE, Spendesk, Workday Inc., Zoho Corp. Pvt. Ltd. are a few of the key vendors in the Travel And Expense Management Software market.

North America will register the highest growth rate of 29.4% among the other regions. Therefore, the Travel And Expense Management Software market in North America is expected to garner significant business opportunities for the vendors during the forecast period.

US, Canada, Mexico, Germany, UK, France, Italy, Spain, The Netherlands, China, Japan, India, South Korea, Australia, Singapore, Brazil, Argentina, Chile, UAE, Saudi Arabia, South Africa, Egypt, Nigeria

  • Strategic integration of AI and automated data extraction is the driving factor this market.

The Travel And Expense Management Software market vendors should focus on grabbing business opportunities from the Deployment segment as it accounted for the largest market share in the base year.
RIA - Research AI Assistant
Ask RIA