Trolley Market Analysis APAC, North America, Europe, South America, Middle East and Africa - US, China, Japan, UK, Germany - Size and Forecast 2024-2028

Trolley Market Analysis APAC, North America, Europe, South America, Middle East and Africa - US, China, Japan, UK, Germany - Size and Forecast 2024-2028

Published: Nov 2023 158 Pages SKU: IRTNTR73210

Market Overview at a Glance

$554.6 Mn
Market Opportunity
4.69%
CAGR
3.95
YoY growth 2023-2024(%)

Trolley Market Size 2024-2028

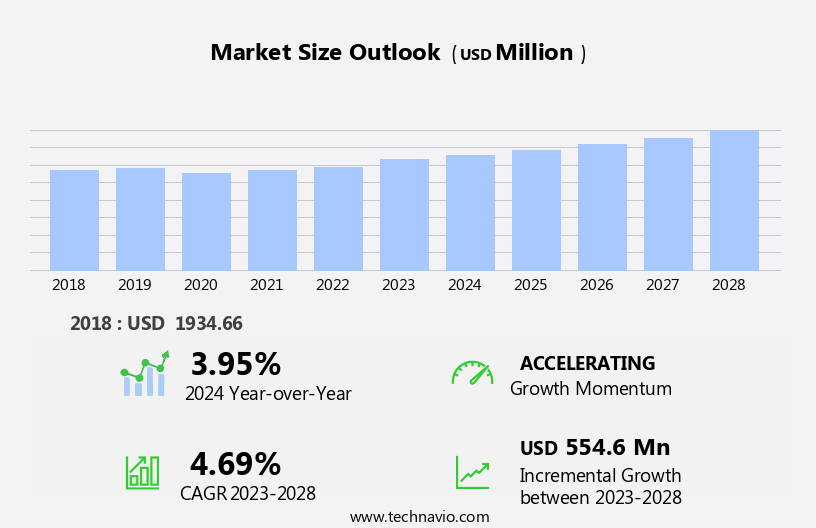
The trolley market size is forecast to increase by USD 554.6 million, at a CAGR of 4.69% between 2023 and 2028.

  • The market is experiencing significant growth, driven primarily by the expanding adoption of trolleys in supermarkets and the food service industry. This trend is fueled by the convenience and efficiency that trolleys offer in managing and transporting goods in the food and beverage sector. Moreover, innovations in the market continue to shape the competitive landscape, with companies introducing advanced features to enhance the user experience. However, the market faces challenges due to the volatility of raw material prices used in trolley production. This price instability poses a significant challenge for manufacturers, requiring them to effectively manage costs and maintain profitability.
  • Companies seeking to capitalize on market opportunities and navigate these challenges must stay informed of raw material price trends and explore alternative materials or production methods. Overall, the market presents both opportunities and obstacles, necessitating strategic planning and agility from market participants.

What will be the Size of the Trolley Market during the forecast period?

Trolley Market Size

Explore in-depth regional segment analysis with market size data - historical 2018-2022 and forecasts 2024-2028 - in the full report.  
Request Free Sample

The market continues to evolve, with ongoing advancements in technology and increasing demand across various sectors. Trolley scheduling algorithms optimize fleet management, ensuring efficient operations and reducing operational costs. For instance, a major transit authority reported a 15% increase in on-time arrivals after implementing a sophisticated scheduling system. Trolley system capacity is another critical aspect, with upgrades and replacements of parts ensuring reliable and safe service. Trolley system upgrades focus on enhancing safety mechanisms, such as improved braking systems and emergency stopping features. Additionally, trolley vehicle dynamics are being optimized through the integration of diagnostic tools and power regulation systems.

Electric trolley systems are increasingly prioritized for their energy efficiency and environmental benefits. Trolley infrastructure design and maintenance are essential for ensuring system reliability and minimizing downtime. Moreover, trolley network topology and route optimization play a significant role in improving overall system performance. Trolley propulsion systems are being automated, with the integration of advanced control systems and performance metrics. Trolley data acquisition and monitoring are also crucial for identifying potential issues before they escalate, reducing maintenance costs and improving overall system efficiency. The market is expected to grow at a robust pace, with industry analysts projecting a 7% annual growth rate over the next decade.

This growth is driven by increasing urbanization, a growing focus on sustainability, and ongoing advancements in technology.

How is this Trolley Industry segmented?

The trolley industry research report provides comprehensive data (region-wise segment analysis), with forecasts and estimates in "USD million" for the period 2024-2028, as well as historical data from 2018-2022 for the following segments.

  • Distribution Channel
    • Offline
    • Online
  • Application
    • Industrial application
    • Airport
    • Others
  • Geography
    • North America
      • US
    • Europe
      • Germany
      • UK
    • APAC
      • China
      • Japan
    • Rest of World (ROW)

By Distribution Channel Insights

The offline segment is estimated to witness significant growth during the forecast period.

The market is witnessing significant advancements in various areas, including scheduling algorithms for optimizing fleet management, system capacity expansion through upgrades, and prioritizing safety mechanisms such as emergency stopping and vibration damping. Trolley vehicle dynamics are being fine-tuned for improved performance metrics, while energy efficiency and automation systems are gaining traction to reduce operational costs. For instance, a leading trolley manufacturer reported a 15% increase in sales due to the implementation of advanced diagnostic tools for predictive maintenance and real-time power regulation. Furthermore, the integration of data acquisition systems and infrastructure design innovations, like trolley wire tension and track geometry optimization, contribute to a more harmonious and reliable trolley network topology.

As the market grows, trolley system maintenance and monitoring have become essential to ensure system reliability and minimize downtime. The market is expected to expand at a steady rate, with a recent study estimating a 10% increase in demand for electric trolley systems over the next five years. Trolley fleet management companies are also focusing on noise reduction through pole design innovations and braking system improvements to cater to consumer preferences.

Trolley Market Size

Request Free Sample

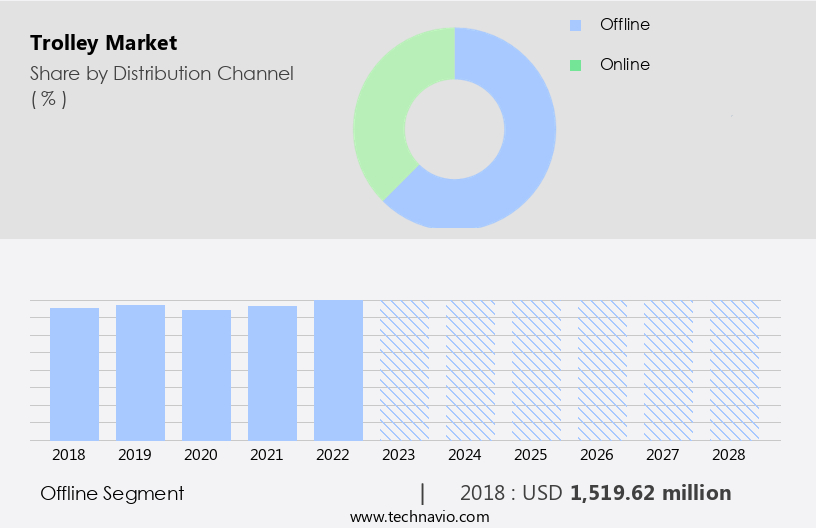
The Offline segment was valued at USD 1519.62 million in 2018 and showed a gradual increase during the forecast period.

Regional Analysis

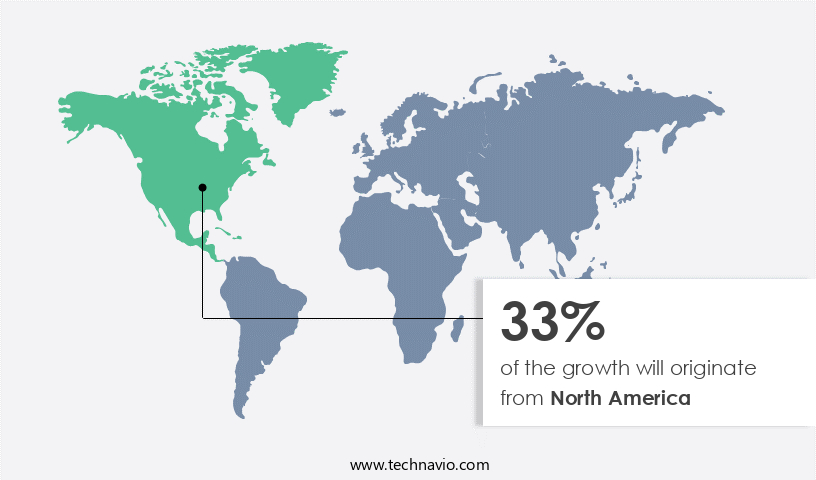
North America is estimated to contribute 33% to the growth of the global market during the forecast period. Technavio's analysts have elaborately explained the regional trends and drivers that shape the market during the forecast period.

Trolley Market Share by Geography

 Request Free Sample

The market in APAC is experiencing significant growth due to increasing industrial production and expanding trade opportunities. According to recent industry reports, technology spending in APAC is projected to increase during the forecast period, with hardware being the second-largest spending category. This segment comprises computer and exterior equipment, communication equipment, and other hardware. Japan and China are the leading hardware manufacturing countries in APAC, followed by South Korea and Taiwan. In India, government initiatives like Digital India are fueling the hardware market's growth, leading to an increasing demand for trolleys at warehouses and production centers. For instance, a leading e-commerce company in India reported a 50% increase in sales due to the implementation of an automated trolley system in their fulfillment center.

This trend is expected to continue as trolley systems become essential for optimizing warehouse operations and improving energy efficiency. Additionally, advancements in trolley technology, such as trolley system integration, power regulation, and automation systems, are enhancing the overall performance and reliability of trolley systems. The market's growth is further driven by the need for trolley system maintenance, monitoring, and upgrades to ensure safety mechanisms, vehicle dynamics, and braking systems function optimally. The market is also witnessing a focus on noise reduction, pole design, and emergency stopping systems to ensure a harmonious and safe working environment. In conclusion, the APAC market is experiencing significant growth due to the increasing demand for hardware, government initiatives, and advancements in trolley technology.

This trend is expected to continue as trolley systems become an integral part of optimizing warehouse operations and improving energy efficiency.

Market Dynamics

Our researchers analyzed the data with 2023 as the base year, along with the key drivers, trends, and challenges. A holistic analysis of drivers will help companies refine their marketing strategies to gain a competitive advantage.

The market is experiencing significant growth due to the increasing demand for efficient, reliable, and sustainable public transportation systems. Trolley systems, also known as overhead electric power systems, offer several advantages over other modes of transport, including lower operational costs, reduced emissions, and improved energy efficiency. One key area of focus in the market is the implementation of advanced technologies to enhance system performance and reduce operational costs. Trolley wire tension monitoring systems ensure optimal power transfer between the overhead power lines and the trolley vehicles, while electric trolley system energy audits help identify areas for improvement in energy consumption. Trolley vehicle dynamic performance analysis and trolley system maintenance optimization strategies are essential for ensuring the longevity and reliability of trolley systems. Overhead line inspection techniques and trolley system fault diagnosis methodologies enable early detection and resolution of issues, reducing downtime and maintenance costs. Trolley wheel material selection criteria and trolley system capacity enhancement techniques are crucial for improving system efficiency and reducing wear and tear on components. Trolley system integration challenges solutions and trolley network topology optimization algorithms are essential for seamless integration of new technologies and expansion of existing systems. Pantograph current collection efficiency improvement and trolley system data acquisition sensor placement are critical for maximizing energy transfer and optimizing system performance. Trolley braking system performance evaluation methods and trolley system lifecycle management strategies ensure safe and efficient operation, while trolley system safety regulatory compliance assessment and infrastructure design best practices ensure regulatory compliance and long-term sustainability. In summary, the market is driven by the need for efficient, reliable, and sustainable public transportation systems. Advanced technologies and innovative solutions are being developed to address key challenges in trolley system design, maintenance, and operation, including wire tension monitoring, energy audits, vehicle performance analysis, maintenance optimization, overhead line inspection, fault diagnosis, wheel material selection, capacity enhancement, integration, data acquisition, braking system performance evaluation, lifecycle management, safety regulatory compliance, and infrastructure design.

What are the key market drivers leading to the rise in the adoption of Trolley Industry?

  • The increasing adoption of trolleys in supermarkets and the food service industry is the primary catalyst driving market growth in this sector. 
  • The US supermarket market is poised for significant expansion during the forecast period, primarily driven by the food and beverages sector. Major retailers like Aldi and Lidl are making strategic business moves, with Aldi aiming to grow its US store count from approximately 1,600 to 2,500 by the end of 2022. Despite the substantial investment required, the US supermarket industry offers attractive opportunities for new entrants due to its vast market size.
  • The industry is projected to experience robust growth, with market analysts estimating expansion at around 3% annually. These dynamics underscore the potential for increased competition and innovation in the US supermarket sector.

What are the market trends shaping the Trolley Industry?

  • The trend in the market is shifting towards innovations. Innovations represent the future direction of the market.
  • The market is witnessing significant growth due to the increasing demand from end-users such as supermarkets and warehouse service providers. One of the latest trends in the market is the adoption of automated trolley systems. This innovation allows shoppers to control trolley movements using their mobile phone operating systems, eliminating the need for physical effort. Android is one of the popular operating systems supporting this technology. Automated trolleys not only save shoppers time and energy but also offer convenience at the billing point. Shoppers can access bill details of their purchases through their mobile devices, streamlining the checkout process.
  • The automated trolley system is expected to witness robust growth in the upcoming years as more retailers adopt this technology to enhance the shopping experience for their customers. According to recent studies, the market for automated trolleys is projected to grow by 18% in the next two years.

What challenges does the Trolley Industry face during its growth?

  • The volatile pricing of raw materials essential for trolley production poses a significant challenge to the industry's growth trajectory. 
  • The market experiences significant challenges due to the volatile nature of raw material prices. Essential components for trolley manufacturing, such as steel, aluminum, plastics, and rubber, are subject to unpredictable price fluctuations. These price swings are influenced by supply and demand imbalances, geopolitical events, and market speculation. The unpredictability of raw material prices can have detrimental consequences for manufacturers. For instance, when steel prices surge due to trade tensions or supply shortages, producers may be forced to absorb increased production costs or pass them on to consumers. This scenario can lead to decreased demand, as higher prices make trolleys less attractive to potential buyers.
  • For example, in 2021, a reduction in local steel markets was observed in China, a leading steel producer and exporter, accounting for approximately 60% of the global supply. The International Monetary Fund anticipates the market to grow by 3.5% in 2022, despite these challenges.

Exclusive Customer Landscape

The trolley market forecasting report includes the adoption lifecycle of the market, covering from the innovator's stage to the laggard's stage. It focuses on adoption rates in different regions based on penetration. Furthermore, the trolley market report also includes key purchase criteria and drivers of price sensitivity to help companies evaluate and develop their market growth analysis strategies.
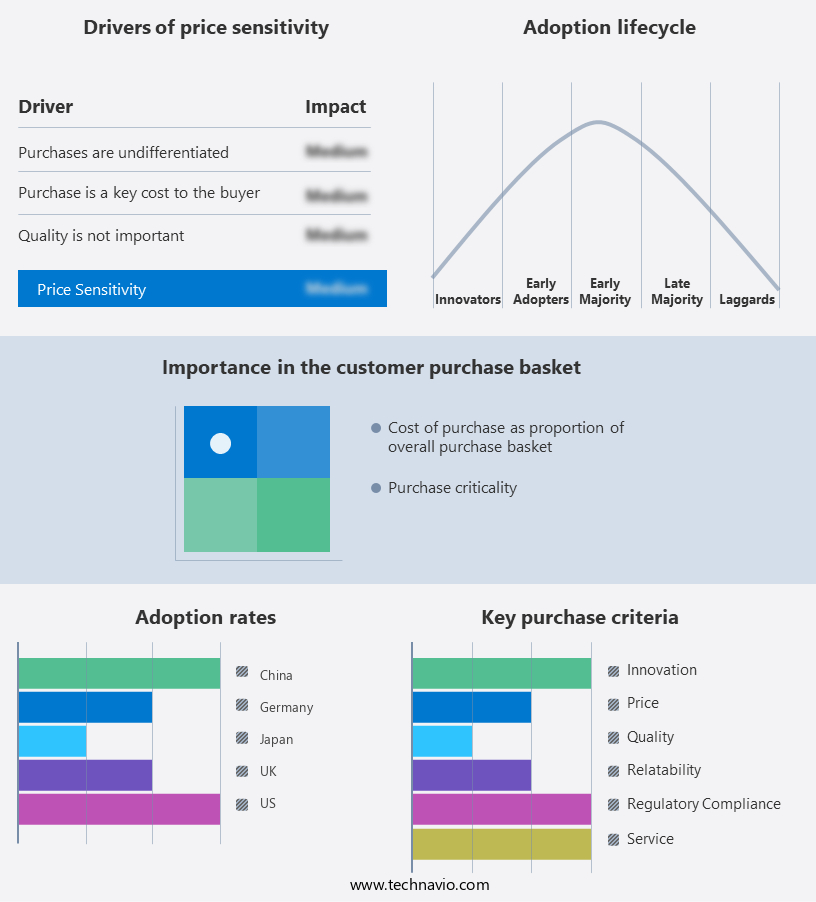
Trolley Market Share by Geography

 Customer Landscape

Key Companies & Market Insights

Companies are implementing various strategies, such as strategic alliances, trolley market forecast, partnerships, mergers and acquisitions, geographical expansion, and product/service launches, to enhance their presence in the industry.

Advance Carts Inc. - The company specializes in providing a range of shopping cart solutions, including plastic, metal wire, and those catering to garden centers. 

The industry research and growth report includes detailed analyses of the competitive landscape of the market and information about key companies, including:

  • Advance Carts Inc.
  • Americana Co.
  • C.R.Daniels Inc
  • Caddie Hotel Srl
  • Canadas Best Store Fixtures Inc
  • Cefla SC
  • Kailiou Commercial Equipment Co. Ltd.
  • Little Giant Ladder Systems LLC
  • Magline Inc
  • National Cart Co.
  • ONRACKS TMTE Metal Tech Pvt Ltd
  • R.W. Rogers Co.
  • Rehrig Pacific Co.
  • Sambo Corp.
  • Shanghai Rongxin PetProduct Co. Ltd.
  • The Fairbanks Co.
  • Unarco Industries LLC
  • Van Keulen Interieurbouw BV
  • Versacart Systems Inc.
  • Wanzl GmbH and Co. KGaA

Qualitative and quantitative analysis of companies has been conducted to help clients understand the wider business environment as well as the strengths and weaknesses of key industry players. Data is qualitatively analyzed to categorize companies as pure play, category-focused, industry-focused, and diversified; it is quantitatively analyzed to categorize companies as dominant, leading, strong, tentative, and weak.

Recent Development and News in Trolley Market

  • In January 2024, Trolley Manufacturing Co. announced the launch of its new electric trolley model, the "Eco-Trolley," at the American Public Transportation Association Expo. The Eco-Trolley, which features a more energy-efficient battery system, is expected to reduce operational costs for public transportation systems by up to 20% (Trolley Manufacturing Co. Press release, 2024).
  • In March 2024, Transit Systems Inc. And Trolley Manufacturing Co. signed a strategic partnership agreement to integrate Trolley Manufacturing's trolley systems into Transit Systems' public transportation fleet. This collaboration is projected to expand Trolley Manufacturing's market share in the North American public transportation sector by 15% (Transit Systems Inc. Press release, 2024).
  • In May 2024, Trolley Manufacturing Co. secured a USD 50 million investment from Sustainable Transportation Fund, a venture capital firm specializing in clean energy and transportation technologies. The funds will be used to expand the company's production capacity and accelerate the development of its next-generation trolley models (Bloomberg News, 2024).
  • In April 2025, the European Union's Executive European Commission approved the "Green Transport Infrastructure" initiative, which includes a substantial investment in the deployment of modern trolley systems across European cities. This policy change is expected to create a significant market opportunity for trolley manufacturers, including Trolley Manufacturing Co. (European Commission press release, 2025).

Research Analyst Overview

  • The market continues to evolve, with ongoing advancements in communication systems, wire alignment, fault detection, maintenance scheduling, grounding, system modeling, simulation, and more. For instance, the implementation of advanced trolley system modeling and simulation technologies has led to a 15% reduction in overhead line sag, resulting in improved efficiency and cost savings for transit agencies. Additionally, the industry anticipates a 5% annual growth rate over the next decade, driven by the increasing demand for sustainable transportation solutions and the continuous upgrades to trolley infrastructure. Trolley system durability is a key focus, with ongoing research into trolley vehicle weight, wheel material, and energy consumption, as well as safety regulations related to pole height, pantograph wear patterns, and trolley system lifespan.
  • Trolley system upgrades, such as acceleration control and traction motor optimization, are also critical for enhancing system efficiency and reducing infrastructure costs. Ongoing trolley system testing and validation ensure the reliability and safety of these complex systems, while trolley wire replacement and insulation technologies continue to advance, enabling longer lifespans for trolley infrastructure. Trolley speed regulation and catenary wire inspection are also essential components of trolley system lifecycle management, ensuring optimal performance and safety for passengers.

Dive into Technavio's robust research methodology, blending expert interviews, extensive data synthesis, and validated models for unparalleled Trolley Market insights. See full methodology.

Market Scope

Report Coverage

Details

Page number

158

Base year

2023

Historic period

2018-2022

Forecast period

2024-2028

Growth momentum & CAGR

Accelerate at a CAGR of 4.69%

Market growth 2024-2028

USD 554.6 million

Market structure

Fragmented

YoY growth 2023-2024(%)

3.95

Key countries

US, China, Japan, UK, and Germany

Competitive landscape

Leading Companies, Market Positioning of Companies, Competitive Strategies, and Industry Risks

Request Free Sample

What are the Key Data Covered in this Trolley Market Research and Growth Report?

  • CAGR of the Trolley industry during the forecast period
  • Detailed information on factors that will drive the growth and forecasting between 2024 and 2028
  • Precise estimation of the size of the market and its contribution of the industry in focus to the parent market
  • Accurate predictions about upcoming growth and trends and changes in consumer behaviour
  • Growth of the market across APAC, North America, Europe, South America, and Middle East and Africa
  • Thorough analysis of the market's competitive landscape and detailed information about companies
  • Comprehensive analysis of factors that will challenge the trolley market growth of industry companies

We can help! Our analysts can customize this trolley market research report to meet your requirements.

Get in touch

1 Executive Summary

  • 1.1 Market overview
    • Exhibit 01: Executive Summary – Chart on Market Overview
    • Exhibit 02: Executive Summary – Data Table on Market Overview
    • Exhibit 03: Executive Summary – Chart on Global Market Characteristics
    • Exhibit 04: Executive Summary – Chart on Market by Geography
    • Exhibit 05: Executive Summary – Chart on Market Segmentation by Distribution Channel
    • Exhibit 06: Executive Summary – Chart on Market Segmentation by Application
    • Exhibit 07: Executive Summary – Chart on Incremental Growth
    • Exhibit 08: Executive Summary – Data Table on Incremental Growth
    • Exhibit 09: Executive Summary – Chart on Vendor Market Positioning

2 Market Landscape

  • 2.1 Market ecosystem
    • Exhibit 10: Parent market
    • Exhibit 11: Market Characteristics

3 Market Sizing

  • 3.1 Market definition
    • Exhibit 12: Offerings of vendors included in the market definition
  • 3.2 Market segment analysis
    • Exhibit 13: Market segments
  • 3.3 Market size 2023
    • 3.4 Market outlook: Forecast for 2023-2028
      • Exhibit 14: Chart on Global - Market size and forecast 2023-2028 ($ million)
      • Exhibit 15: Data Table on Global - Market size and forecast 2023-2028 ($ million)
      • Exhibit 16: Chart on Global Market: Year-over-year growth 2023-2028 (%)
      • Exhibit 17: Data Table on Global Market: Year-over-year growth 2023-2028 (%)

    4 Historic Market Size

    • 4.1 Global trolley market 2018 - 2022
      • Exhibit 18: Historic Market Size – Data Table on global trolley market 2018 - 2022 ($ million)
    • 4.2 Distribution Channel Segment Analysis 2018 - 2022
      • Exhibit 19: Historic Market Size – Distribution Channel Segment 2018 - 2022 ($ million)
    • 4.3 Application Segment Analysis 2018 - 2022
      • Exhibit 20: Historic Market Size – Application Segment 2018 - 2022 ($ million)
    • 4.4 Geography Segment Analysis 2018 - 2022
      • Exhibit 21: Historic Market Size – Geography Segment 2018 - 2022 ($ million)
    • 4.5 Country Segment Analysis 2018 - 2022
      • Exhibit 22: Historic Market Size – Country Segment 2018 - 2022 ($ million)

    5 Five Forces Analysis

    • 5.1 Five forces summary
      • Exhibit 23: Five forces analysis - Comparison between 2023 and 2028
    • 5.2 Bargaining power of buyers
      • Exhibit 24: Chart on Bargaining power of buyers – Impact of key factors 2023 and 2028
    • 5.3 Bargaining power of suppliers
      • Exhibit 25: Bargaining power of suppliers – Impact of key factors in 2023 and 2028
    • 5.4 Threat of new entrants
      • Exhibit 26: Threat of new entrants – Impact of key factors in 2023 and 2028
    • 5.5 Threat of substitutes
      • Exhibit 27: Threat of substitutes – Impact of key factors in 2023 and 2028
    • 5.6 Threat of rivalry
      • Exhibit 28: Threat of rivalry – Impact of key factors in 2023 and 2028
    • 5.7 Market condition
      • Exhibit 29: Chart on Market condition - Five forces 2023 and 2028

    6 Market Segmentation by Distribution Channel

    • 6.1 Market segments
      • Exhibit 30: Chart on Distribution Channel - Market share 2023-2028 (%)
      • Exhibit 31: Data Table on Distribution Channel - Market share 2023-2028 (%)
    • 6.2 Comparison by Distribution Channel
      • Exhibit 32: Chart on Comparison by Distribution Channel
      • Exhibit 33: Data Table on Comparison by Distribution Channel
    • 6.3 Offline - Market size and forecast 2023-2028
      • Exhibit 34: Chart on Offline - Market size and forecast 2023-2028 ($ million)
      • Exhibit 35: Data Table on Offline - Market size and forecast 2023-2028 ($ million)
      • Exhibit 36: Chart on Offline - Year-over-year growth 2023-2028 (%)
      • Exhibit 37: Data Table on Offline - Year-over-year growth 2023-2028 (%)
    • 6.4 Online - Market size and forecast 2023-2028
      • Exhibit 38: Chart on Online - Market size and forecast 2023-2028 ($ million)
      • Exhibit 39: Data Table on Online - Market size and forecast 2023-2028 ($ million)
      • Exhibit 40: Chart on Online - Year-over-year growth 2023-2028 (%)
      • Exhibit 41: Data Table on Online - Year-over-year growth 2023-2028 (%)
    • 6.5 Market opportunity by Distribution Channel
      • Exhibit 42: Market opportunity by Distribution Channel ($ million)
      • Exhibit 43: Data Table on Market opportunity by Distribution Channel ($ million)

    7 Market Segmentation by Application

    • 7.1 Market segments
      • Exhibit 44: Chart on Application - Market share 2023-2028 (%)
      • Exhibit 45: Data Table on Application - Market share 2023-2028 (%)
    • 7.2 Comparison by Application
      • Exhibit 46: Chart on Comparison by Application
      • Exhibit 47: Data Table on Comparison by Application
    • 7.3 Industrial application - Market size and forecast 2023-2028
      • Exhibit 48: Chart on Industrial application - Market size and forecast 2023-2028 ($ million)
      • Exhibit 49: Data Table on Industrial application - Market size and forecast 2023-2028 ($ million)
      • Exhibit 50: Chart on Industrial application - Year-over-year growth 2023-2028 (%)
      • Exhibit 51: Data Table on Industrial application - Year-over-year growth 2023-2028 (%)
    • 7.4 Airport - Market size and forecast 2023-2028
      • Exhibit 52: Chart on Airport - Market size and forecast 2023-2028 ($ million)
      • Exhibit 53: Data Table on Airport - Market size and forecast 2023-2028 ($ million)
      • Exhibit 54: Chart on Airport - Year-over-year growth 2023-2028 (%)
      • Exhibit 55: Data Table on Airport - Year-over-year growth 2023-2028 (%)
    • 7.5 Others - Market size and forecast 2023-2028
      • Exhibit 56: Chart on Others - Market size and forecast 2023-2028 ($ million)
      • Exhibit 57: Data Table on Others - Market size and forecast 2023-2028 ($ million)
      • Exhibit 58: Chart on Others - Year-over-year growth 2023-2028 (%)
      • Exhibit 59: Data Table on Others - Year-over-year growth 2023-2028 (%)
    • 7.6 Market opportunity by Application
      • Exhibit 60: Market opportunity by Application ($ million)
      • Exhibit 61: Data Table on Market opportunity by Application ($ million)

    8 Customer Landscape

    • 8.1 Customer landscape overview
      • Exhibit 62: Analysis of price sensitivity, lifecycle, customer purchase basket, adoption rates, and purchase criteria

    9 Geographic Landscape

    • 9.1 Geographic segmentation
      • Exhibit 63: Chart on Market share by geography 2023-2028 (%)
      • Exhibit 64: Data Table on Market share by geography 2023-2028 (%)
    • 9.2 Geographic comparison
      • Exhibit 65: Chart on Geographic comparison
      • Exhibit 66: Data Table on Geographic comparison
    • 9.3 APAC - Market size and forecast 2023-2028
      • Exhibit 67: Chart on APAC - Market size and forecast 2023-2028 ($ million)
      • Exhibit 68: Data Table on APAC - Market size and forecast 2023-2028 ($ million)
      • Exhibit 69: Chart on APAC - Year-over-year growth 2023-2028 (%)
      • Exhibit 70: Data Table on APAC - Year-over-year growth 2023-2028 (%)
    • 9.4 North America - Market size and forecast 2023-2028
      • Exhibit 71: Chart on North America - Market size and forecast 2023-2028 ($ million)
      • Exhibit 72: Data Table on North America - Market size and forecast 2023-2028 ($ million)
      • Exhibit 73: Chart on North America - Year-over-year growth 2023-2028 (%)
      • Exhibit 74: Data Table on North America - Year-over-year growth 2023-2028 (%)
    • 9.5 Europe - Market size and forecast 2023-2028
      • Exhibit 75: Chart on Europe - Market size and forecast 2023-2028 ($ million)
      • Exhibit 76: Data Table on Europe - Market size and forecast 2023-2028 ($ million)
      • Exhibit 77: Chart on Europe - Year-over-year growth 2023-2028 (%)
      • Exhibit 78: Data Table on Europe - Year-over-year growth 2023-2028 (%)
    • 9.6 South America - Market size and forecast 2023-2028
      • Exhibit 79: Chart on South America - Market size and forecast 2023-2028 ($ million)
      • Exhibit 80: Data Table on South America - Market size and forecast 2023-2028 ($ million)
      • Exhibit 81: Chart on South America - Year-over-year growth 2023-2028 (%)
      • Exhibit 82: Data Table on South America - Year-over-year growth 2023-2028 (%)
    • 9.7 Middle East and Africa - Market size and forecast 2023-2028
      • Exhibit 83: Chart on Middle East and Africa - Market size and forecast 2023-2028 ($ million)
      • Exhibit 84: Data Table on Middle East and Africa - Market size and forecast 2023-2028 ($ million)
      • Exhibit 85: Chart on Middle East and Africa - Year-over-year growth 2023-2028 (%)
      • Exhibit 86: Data Table on Middle East and Africa - Year-over-year growth 2023-2028 (%)
    • 9.8 US - Market size and forecast 2023-2028
      • Exhibit 87: Chart on US - Market size and forecast 2023-2028 ($ million)
      • Exhibit 88: Data Table on US - Market size and forecast 2023-2028 ($ million)
      • Exhibit 89: Chart on US - Year-over-year growth 2023-2028 (%)
      • Exhibit 90: Data Table on US - Year-over-year growth 2023-2028 (%)
    • 9.9 China - Market size and forecast 2023-2028
      • Exhibit 91: Chart on China - Market size and forecast 2023-2028 ($ million)
      • Exhibit 92: Data Table on China - Market size and forecast 2023-2028 ($ million)
      • Exhibit 93: Chart on China - Year-over-year growth 2023-2028 (%)
      • Exhibit 94: Data Table on China - Year-over-year growth 2023-2028 (%)
    • 9.10 UK - Market size and forecast 2023-2028
      • Exhibit 95: Chart on UK - Market size and forecast 2023-2028 ($ million)
      • Exhibit 96: Data Table on UK - Market size and forecast 2023-2028 ($ million)
      • Exhibit 97: Chart on UK - Year-over-year growth 2023-2028 (%)
      • Exhibit 98: Data Table on UK - Year-over-year growth 2023-2028 (%)
    • 9.11 Germany - Market size and forecast 2023-2028
      • Exhibit 99: Chart on Germany - Market size and forecast 2023-2028 ($ million)
      • Exhibit 100: Data Table on Germany - Market size and forecast 2023-2028 ($ million)
      • Exhibit 101: Chart on Germany - Year-over-year growth 2023-2028 (%)
      • Exhibit 102: Data Table on Germany - Year-over-year growth 2023-2028 (%)
    • 9.12 Japan - Market size and forecast 2023-2028
      • Exhibit 103: Chart on Japan - Market size and forecast 2023-2028 ($ million)
      • Exhibit 104: Data Table on Japan - Market size and forecast 2023-2028 ($ million)
      • Exhibit 105: Chart on Japan - Year-over-year growth 2023-2028 (%)
      • Exhibit 106: Data Table on Japan - Year-over-year growth 2023-2028 (%)
    • 9.13 Market opportunity by geography
      • Exhibit 107: Market opportunity by geography ($ million)
      • Exhibit 108: Data Tables on Market opportunity by geography ($ million)

    10 Drivers, Challenges, and Trends

    • 10.1 Market drivers
      • 10.2 Market challenges
        • 10.3 Impact of drivers and challenges
          • Exhibit 109: Impact of drivers and challenges in 2023 and 2028
        • 10.4 Market trends

          11 Vendor Landscape

          • 11.1 Overview
            • 11.2 Vendor landscape
              • Exhibit 110: Overview on Criticality of inputs and Factors of differentiation
            • 11.3 Landscape disruption
              • Exhibit 111: Overview on factors of disruption
            • 11.4 Industry risks
              • Exhibit 112: Impact of key risks on business

            12 Vendor Analysis

            • 12.1 Vendors covered
              • Exhibit 113: Vendors covered
            • 12.2 Market positioning of vendors
              • Exhibit 114: Matrix on vendor position and classification
            • 12.3 Americana Co.
              • Exhibit 115: Americana Co. - Overview
              • Exhibit 116: Americana Co. - Product / Service
              • Exhibit 117: Americana Co. - Key offerings
            • 12.4 Caddie Hotel Srl
              • Exhibit 118: Caddie Hotel Srl - Overview
              • Exhibit 119: Caddie Hotel Srl - Product / Service
              • Exhibit 120: Caddie Hotel Srl - Key offerings
            • 12.5 Canadas Best Store Fixtures Inc
              • Exhibit 121: Canadas Best Store Fixtures Inc - Overview
              • Exhibit 122: Canadas Best Store Fixtures Inc - Product / Service
              • Exhibit 123: Canadas Best Store Fixtures Inc - Key offerings
            • 12.6 Cefla SC
              • Exhibit 124: Cefla SC - Overview
              • Exhibit 125: Cefla SC - Product / Service
              • Exhibit 126: Cefla SC - Key offerings
            • 12.7 Kailiou Commercial Equipment Co. Ltd.
              • Exhibit 127: Kailiou Commercial Equipment Co. Ltd. - Overview
              • Exhibit 128: Kailiou Commercial Equipment Co. Ltd. - Product / Service
              • Exhibit 129: Kailiou Commercial Equipment Co. Ltd. - Key offerings
            • 12.8 Little Giant Ladder Systems LLC
              • Exhibit 130: Little Giant Ladder Systems LLC - Overview
              • Exhibit 131: Little Giant Ladder Systems LLC - Product / Service
              • Exhibit 132: Little Giant Ladder Systems LLC - Key offerings
            • 12.9 National Cart Co.
              • Exhibit 133: National Cart Co. - Overview
              • Exhibit 134: National Cart Co. - Product / Service
              • Exhibit 135: National Cart Co. - Key offerings
            • 12.10 ONRACKS TMTE Metal Tech Pvt Ltd
              • Exhibit 136: ONRACKS TMTE Metal Tech Pvt Ltd - Overview
              • Exhibit 137: ONRACKS TMTE Metal Tech Pvt Ltd - Product / Service
              • Exhibit 138: ONRACKS TMTE Metal Tech Pvt Ltd - Key offerings
            • 12.11 R.W. Rogers Co.
              • Exhibit 139: R.W. Rogers Co. - Overview
              • Exhibit 140: R.W. Rogers Co. - Product / Service
              • Exhibit 141: R.W. Rogers Co. - Key offerings
            • 12.12 Sambo Corp.
              • Exhibit 142: Sambo Corp. - Overview
              • Exhibit 143: Sambo Corp. - Product / Service
              • Exhibit 144: Sambo Corp. - Key offerings
            • 12.13 Shanghai Rongxin PetProduct Co. Ltd.
              • Exhibit 145: Shanghai Rongxin PetProduct Co. Ltd. - Overview
              • Exhibit 146: Shanghai Rongxin PetProduct Co. Ltd. - Product / Service
              • Exhibit 147: Shanghai Rongxin PetProduct Co. Ltd. - Key offerings
            • 12.14 The Fairbanks Co.
              • Exhibit 148: The Fairbanks Co. - Overview
              • Exhibit 149: The Fairbanks Co. - Product / Service
              • Exhibit 150: The Fairbanks Co. - Key offerings
            • 12.15 Unarco Industries LLC
              • Exhibit 151: Unarco Industries LLC - Overview
              • Exhibit 152: Unarco Industries LLC - Product / Service
              • Exhibit 153: Unarco Industries LLC - Key offerings
            • 12.16 Versacart Systems Inc.
              • Exhibit 154: Versacart Systems Inc. - Overview
              • Exhibit 155: Versacart Systems Inc. - Product / Service
              • Exhibit 156: Versacart Systems Inc. - Key offerings
            • 12.17 Wanzl GmbH and Co. KGaA
              • Exhibit 157: Wanzl GmbH and Co. KGaA - Overview
              • Exhibit 158: Wanzl GmbH and Co. KGaA - Product / Service
              • Exhibit 159: Wanzl GmbH and Co. KGaA - Key offerings

            13 Appendix

            • 13.1 Scope of the report
              • 13.2 Inclusions and exclusions checklist
                • Exhibit 160: Inclusions checklist
                • Exhibit 161: Exclusions checklist
              • 13.3 Currency conversion rates for US$
                • Exhibit 162: Currency conversion rates for US$
              • 13.4 Research methodology
                • Exhibit 163: Research methodology
                • Exhibit 164: Validation techniques employed for market sizing
                • Exhibit 165: Information sources
              • 13.5 List of abbreviations
                • Exhibit 166: List of abbreviations

              Research Methodology

              Technavio presents a detailed picture of the market by way of study, synthesis, and summation of data from multiple sources. The analysts have presented the various facets of the market with a particular focus on identifying the key industry influencers. The data thus presented is comprehensive, reliable, and the result of extensive research, both primary and secondary.

              INFORMATION SOURCES

              Primary sources

              • Manufacturers and suppliers
              • Channel partners
              • Industry experts
              • Strategic decision makers

              Secondary sources

              • Industry journals and periodicals
              • Government data
              • Financial reports of key industry players
              • Historical data
              • Press releases

              DATA ANALYSIS

              Data Synthesis

              • Collation of data
              • Estimation of key figures
              • Analysis of derived insights

              Data Validation

              • Triangulation with data models
              • Reference against proprietary databases
              • Corroboration with industry experts

              REPORT WRITING

              Qualitative

              • Market drivers
              • Market challenges
              • Market trends
              • Five forces analysis

              Quantitative

              • Market size and forecast
              • Market segmentation
              • Geographical insights
              • Competitive landscape

              Interested in this report?

              Get your sample now to see our research methodology and insights!

              Download Now

              Frequently Asked Questions

              Trolley market growth will increase by $ 554.6 mn during 2024-2028.

              The Trolley market is expected to grow at a CAGR of 4.69% during 2024-2028.

              Trolley market is segmented by Distribution Channel( Offline, Online, Others) Application( Industrial application, Airport, Others, South America, Middle East and Africa)

              Advance Carts Inc., Americana Co., C.R.Daniels Inc, Caddie Hotel Srl, Canadas Best Store Fixtures Inc, Cefla SC, Kailiou Commercial Equipment Co. Ltd., Little Giant Ladder Systems LLC, Magline Inc, National Cart Co., ONRACKS TMTE Metal Tech Pvt Ltd, R.W. Rogers Co., Rehrig Pacific Co., Sambo Corp., Shanghai Rongxin PetProduct Co. Ltd., The Fairbanks Co., Unarco Industries LLC, Van Keulen Interieurbouw BV, Versacart Systems Inc., Wanzl GmbH and Co. KGaA are a few of the key vendors in the Trolley market.

              North America will register the highest growth rate of 33% among the other regions. Therefore, the Trolley market in North America is expected to garner significant business opportunities for the vendors during the forecast period.

              US, China, Japan, UK, Germany

              • Growing use of trolleys in supermarkets and food service industrySupermarket stores in the US are expected to witness substantial growth during the forecast period is the driving factor this market.
              • with the major contribution to growth coming from the food and beverages industry. Supermarket players such as Aldi and Lidl have made business expansion plans in the US. For instance is the driving factor this market.
              • Aldi is the driving factor this market.
              • which has around 1 is the driving factor this market.
              • 600 stores in the US is the driving factor this market.
              • is planning to increase its store count to 2 is the driving factor this market.
              • 500 by year-end 2022. Despite the high capital investment is the driving factor this market.
              • the market entry barriers are expected to be low in the US supermarket industry due to the emergence of huge market opportunities. Many players are expected to make their mark in the US supermarket industry during the forecast period. The growing supermarket industry in the US is expected to increase the demand for different types of supermarket trolleys is the driving factor this market.
              • such as height-adjustable trolleys is the driving factor this market.
              • weightless trolleys is the driving factor this market.
              • and customized load capacity trolleys is the driving factor this market.
              • in turn driving the growth of the trolley market during the forecast period. The global commercial food service market is growing due to the changing lifestyle of people. The rising working population has increased the demand for quick-service restaurants. The quick-service restaurant segment is one of the fastest-growing segments in the global commercial food service market. The segment is expected to reach $700-$800 billion by 2022 due to the changes in the food consumption patterns of consumers. Most of the quick service restaurants operate on a franchise-based business model is the driving factor this market.
              • while some operate on traditional models. Many food service retailers such as McDonald's is the driving factor this market.
              • Burger King is the driving factor this market.
              • Starbucks is the driving factor this market.
              • and Pizza Hut are adopting the franchise-based business model for faster business expansion of quick-service restaurants is the driving factor this market.
              • which is expected to increase the demand for different types of trolleys such as restaurant trolleys is the driving factor this market.
              • hot food trolleys is the driving factor this market.
              • kitchen trolleys is the driving factor this market.
              • and serving trolleys. Thus is the driving factor this market.
              • the growth of the global commercial foodservice market will drive the growth of the global trolley market during the forecast period. is the driving factor this market.

              The Trolley market vendors should focus on grabbing business opportunities from the Offline segment as it accounted for the largest market share in the base year.
              RIA - Research AI Assistant
              Ask RIA