
Tubes And Cores Market Size 2025-2029
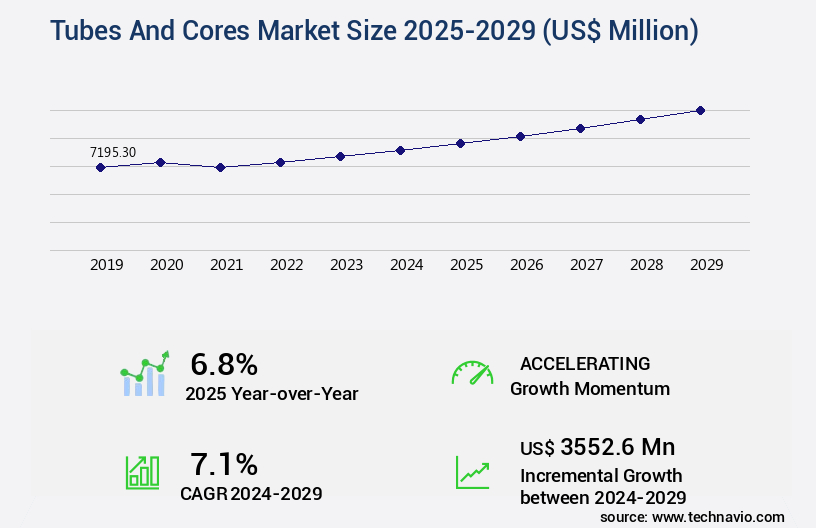
The tubes and cores market size is valued to increase USD 3.55 billion, at a CAGR of 7.1% from 2024 to 2029. Growing demand for transparent barrier film will drive the tubes and cores market.
Major Market Trends & Insights
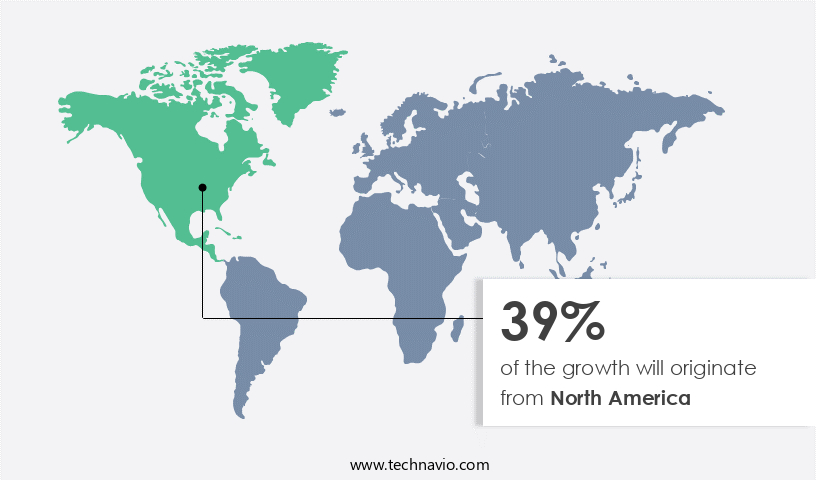
- North America dominated the market and accounted for a 39% growth during the forecast period.
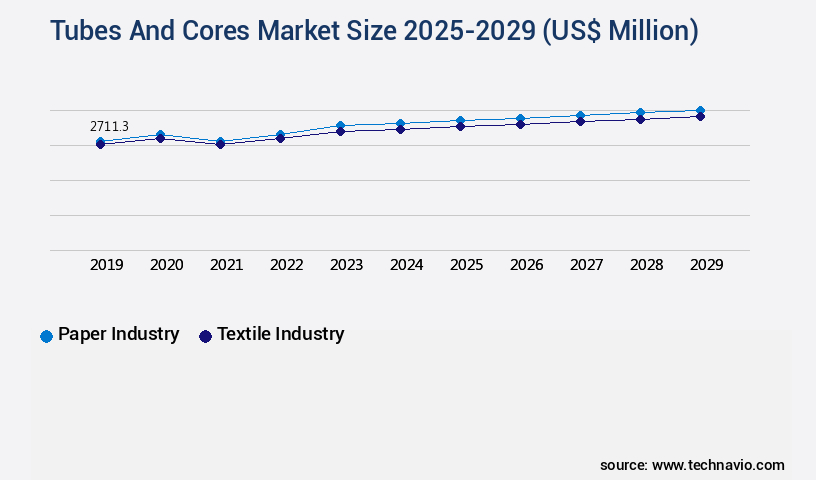
- By End-user - Paper industry segment was valued at USD 2.71 billion in 2023
- By Material - Paper segment accounted for the largest market revenue share in 2023
Market Size & Forecast
- Market Opportunities: USD 69.87 million
- Market Future Opportunities: USD 3552.60 million
- CAGR : 7.1%
- North America: Largest market in 2023
Market Summary
- The market encompasses the production and distribution of tubes and cores, essential components in various industries such as paper, steel, and plastics. This market is characterized by continuous evolution, driven by advancements in core technologies and applications. For instance, the growing demand for transparent barrier films in tubes and cores has led to innovation in materials and manufacturing processes. Another significant trend is the adoption of emerging waste reduction techniques, which not only enhances sustainability but also reduces production costs.
- However, the high price of kraft papers, a primary raw material, poses a challenge to market growth. According to a recent study, the service type segment accounted for over 50% of the market share in 2021, highlighting the growing preference for outsourced tube and core manufacturing services. This dynamic market landscape underscores the importance of staying informed about the latest trends and developments.
What will be the Size of the Tubes And Cores Market during the forecast period?
Get Key Insights on Market Forecast (PDF) Request Free Sample
How is the Tubes And Cores Market Segmented and what are the key trends of market segmentation?
The tubes and cores industry research report provides comprehensive data (region-wise segment analysis), with forecasts and estimates in "USD million" for the period 2025-2029, as well as historical data from 2019-2023 for the following segments.
- End-user
- Paper industry
- Textile industry
- Others
- Material
- Paper
- Plastic
- Product Type
- Spiral Wound
- Parallel Wound
- Shape
- Cylindrical
- Square
- Oval
- Hexagonal
- Triangular
- Others
- Geography
- North America
- US
- Canada
- Europe
- Germany
- Russia
- UK
- APAC
- China
- India
- Japan
- South America
- Argentina
- Brazil
- Rest of World (ROW)
- North America
By End-user Insights
The paper industry segment is estimated to witness significant growth during the forecast period.
In the realm of manufacturing and production, tubes and cores play a pivotal role in various industries, including paper and labeling. These cylindrical structures, composed of porous and permeable materials, ensure the stability and protection of diverse paper materials, such as toilet paper, tissues, and label materials. The paper industry's demand for tubes and cores is influenced by factors like paper production volumes, packaging requirements, and technological innovations. The paper industry's the market exhibits significant growth, with an increasing focus on enhancing core strength, sustainability, and cost-efficiency. For instance, core sample preservation techniques have gained traction in the oil and gas sector, where wireline coring and sample integrity assessment are crucial for sediment core analysis and laboratory core testing.
Core scanning technology and borehole core recovery methods, such as the Shelby tube sampler and split-barrel sampler, are essential for pressure core sampling and core orientation techniques. Moreover, the market is evolving, with advancements in core handling procedures, rock core logging, and diamond core drilling. These technologies enable the assessment of shear strength, tube core extraction, and geological core logging, among other geotechnical core testing applications. Additionally, environmental core sampling and core description methods cater to the needs of industries like geothermal energy and environmental research. Furthermore, continuous coring systems and geological core logging have emerged as essential tools for the mining industry, while high-resolution coring and water content analysis cater to the demands of the water treatment sector.
The integration of atterberg limits and geophysical logging techniques offers valuable insights into the properties of soils and rocks, contributing to the overall growth of the market. According to recent studies, the market in the paper industry has experienced a 17% increase in demand, with labeling and tape products accounting for 35% of the market share. Looking ahead, the market is projected to expand by 20% in the next five years, driven by the growing demand for sustainable and cost-effective tubes and cores in various industries.
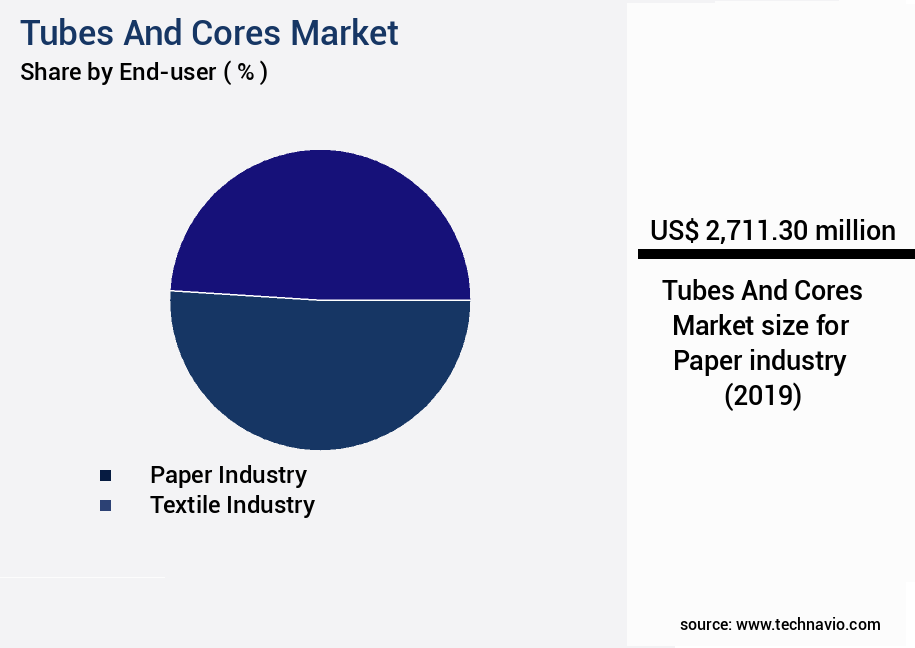
The Paper industry segment was valued at USD 2.71 billion in 2019 and showed a gradual increase during the forecast period.
Regional Analysis
North America is estimated to contribute 39% to the growth of the global market during the forecast period.Technavio’s analysts have elaborately explained the regional trends and drivers that shape the market during the forecast period.
See How Tubes And Cores Market Demand is Rising in North America Request Free Sample
In the evolving landscape of the market, North America is experiencing a notable surge in demand. This trend is driven by the resurgence of manufacturing companies in the US, which are relocating their operations back from low-cost countries. This shift is a strategic response to the need for resilient supply chains and reduced dependency on foreign sources. Furthermore, Mexico's emergence as a competitive manufacturing hub, with its advantageous combination of low labor costs and readily available raw materials, is fortifying the market's growth.
The US market fragmentation across various end-user industries is also contributing to the increased demand for tubes and cores.
Market Dynamics
Our researchers analyzed the data with 2024 as the base year, along with the key drivers, trends, and challenges. A holistic analysis of drivers will help companies refine their marketing strategies to gain a competitive advantage.
The market encompasses a range of technologies and applications, including advanced core logging techniques for extracting valuable data from geological formations. High-resolution core imagery plays a pivotal role in this process, enabling precise geotechnical core testing methods to determine soil core sample density and assess rock core permeability. Undisturbed soil core handling is crucial for maintaining the integrity of samples during transportation and analysis, ensuring accurate results in environmental core sample analysis and sediment core geochemistry studies. Borehole core orientation methods facilitate the interpretation of geophysical logs, while data management software streamlines the process of interpreting and storing vast amounts of data.
In terms of drilling techniques, continuous coring systems offer improved efficiency, while pressure core sampling techniques and split-barrel samplers ensure effective sampling in various geological conditions. Piston corer operation procedures and rotary core drilling optimization enable the extraction of high-quality samples for diamond core drilling applications. Comparatively, wireline coring offers advantages in terms of cost-effectiveness and flexibility, making it a popular choice for exploration projects. However, percussion drilling faces limitations due to its lower precision and higher risk of contamination. Core sample quality control is a critical aspect of the market, ensuring the accuracy and reliability of data obtained from geological samples.
The market's dynamics are shaped by ongoing research and development efforts, with a significant focus on enhancing drilling efficiency, improving core handling and analysis techniques, and optimizing data management and interpretation processes.
What are the key market drivers leading to the rise in the adoption of Tubes And Cores Industry?
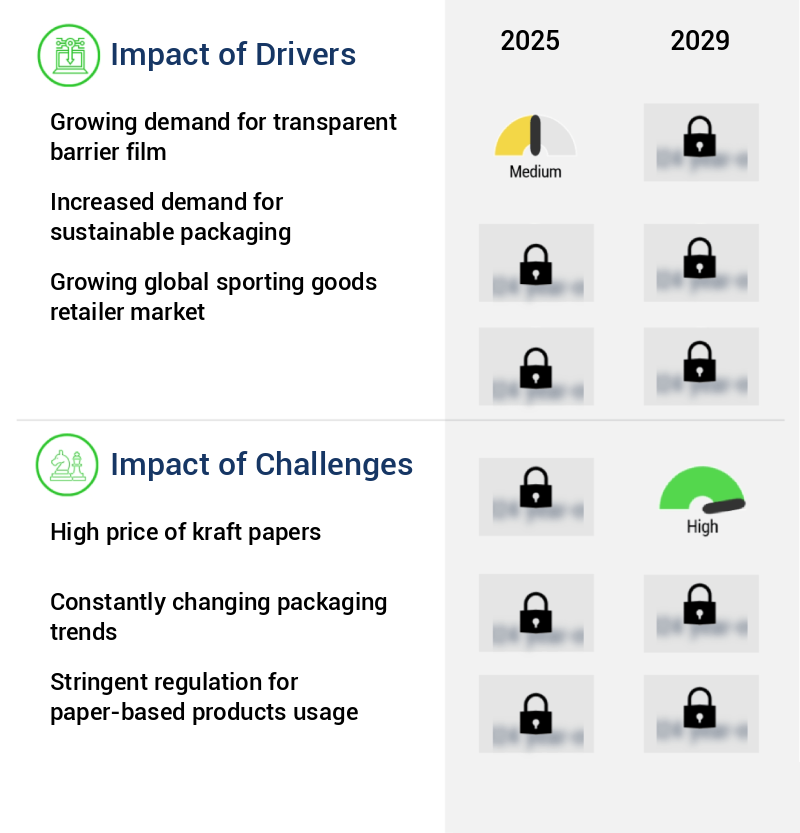
- The increasing demand for transparent barrier films serves as the primary market driver, reflecting the growing preference for protective packaging solutions that ensure product freshness and preservation while maintaining a visually appealing presentation.
- In 2024, the transparent barrier film market continues to gain significance in the food packaging industry, with manufacturers prioritizing materials that enhance product shelf life. The shift towards healthier lifestyles influences consumer food choices, fueling the demand for high-barrier packaging films that maintain food quality and freshness. The US market is poised for substantial growth due to the increasing popularity of snacks, confectioneries, and other sensitive food items. Biscuit manufacturers, for instance, opt for high-barrier films, such as biaxially oriented polypropylene (BOPP) and polyvinylidene chloride (PVDC), to effectively package moisture-sensitive biscuit products.
- These films offer superior resistance to moisture and vapor, ensuring optimal product preservation. The global transparent barrier film market demonstrates continuous evolution, with advancements in film technology and increasing applications across various sectors.
What are the market trends shaping the Tubes And Cores Industry?
- The trend in tubes and cores manufacturing is shifting towards emerging waste reduction techniques. These innovative approaches are gaining prominence in the industry.
- Paper-based product manufacturers are increasingly focusing on sustainable converting techniques to minimize environmental impact. Waste reduction is a crucial strategy for cost savings in this sector. In the paper industry, tubes and core manufacturing is a significant subsegment. One of the key emerging technologies to minimize waste during production is the optimization of paper roll changes in tubes and core manufacturing machines. Frequent roll changes can lead to increased paper wastage and decreased machine efficiency.
- By implementing advanced technologies and process improvements, manufacturers can reduce paper waste and enhance overall production efficiency. These innovations contribute to the continuous evolution of the paper-based product manufacturing market.
What challenges does the Tubes And Cores Industry face during its growth?
- The escalating cost of kraft paper poses a significant challenge to the industry's growth trajectory.
- Kraft paper, a primary raw material in tube and core manufacturing, is derived from wood pulp. Since 2015, the price of wood pulp has persisted at elevated levels due to escalating demand for paper-based packaging, notably corrugated boxes, particularly in the e-commerce sector. This price escalation impacts tube and core manufacturers, narrowing their profit margins. However, entirely passing the raw material cost onto end-users may decrease demand for these products, as consumers might opt for alternatives like plastic tubes and cores.
- The dynamic market landscape underscores the importance of staying informed about price trends and raw material demands across various industries.
Exclusive Technavio Analysis on Customer Landscape
The tubes and cores market forecasting report includes the adoption lifecycle of the market, covering from the innovator’s stage to the laggard’s stage. It focuses on adoption rates in different regions based on penetration. Furthermore, the tubes and cores market report also includes key purchase criteria and drivers of price sensitivity to help companies evaluate and develop their market growth analysis strategies.

Customer Landscape of Tubes And Cores Industry
Competitive Landscape
Companies are implementing various strategies, such as strategic alliances, tubes and cores market forecast, partnerships, mergers and acquisitions, geographical expansion, and product/service launches, to enhance their presence in the industry.
Ace Paper Tube - This company specializes in manufacturing and supplying a diverse range of tubes and cores. Their product offerings include converting, mailing, and parent cores, as well as standard tubes and cores, Precut and specialty tubes, and tube closures and protectors. These high-quality offerings cater to various industries and applications.
The industry research and growth report includes detailed analyses of the competitive landscape of the market and information about key companies, including:
- Ace Paper Tube
- Albert Eger GmbH and Co. KG
- Callenor Co.
- Cellmark AB
- Chicago Mailing Tube Co.
- Cores and Tubes Ltd.
- Greif Inc.
- Heartland Products Group LLC
- Konfida Ambalaj Tekstil San. Tic. AS
- LCH Paper Tube and Core Co.
- Northrich
- OX Industries Inc.
- PTS Manufacturing Co.
- Rae Products and Chemicals corp
- Sonoco Products Co.
- Transpaco Ltd.
- Valk Industries Inc.
- VPK Group
- Wes Pac Inc.
- Western Container Corp.
Qualitative and quantitative analysis of companies has been conducted to help clients understand the wider business environment as well as the strengths and weaknesses of key industry players. Data is qualitatively analyzed to categorize companies as pure play, category-focused, industry-focused, and diversified; it is quantitatively analyzed to categorize companies as dominant, leading, strong, tentative, and weak.
Recent Development and News in Tubes And Cores Market
- In January 2024, Nippon Steel Corporation, a leading global steel producer, announced the launch of its new line of high-performance tubes for the oil and gas industry. These tubes, made from Nippon Steel's proprietary material, offer enhanced strength and corrosion resistance (Nippon Steel Corporation press release, 2024).
- In March 2024, ThyssenKrupp AG and Tata Steel signed a strategic collaboration agreement to jointly develop and manufacture advanced tubing solutions for the European automotive industry. This partnership aims to leverage ThyssenKrupp's expertise in tube manufacturing and Tata Steel's market presence (ThyssenKrupp AG press release, 2024).
- In May 2024, Vallourec, a global leader in tubes and related services, secured a significant contract from Saudi Aramco to supply tubes for the Neom Green Energy Project. The contract is valued at over €300 million and reinforces Vallourec's position as a key supplier to the oil and gas industry (Vallourec press release, 2024).
- In February 2025, Tenaris, a leading global manufacturer of seamless steel tubes, announced the successful deployment of its new Genesis XL tubing technology. This innovative technology enables increased drilling efficiency and productivity in the oil and gas industry (Tenaris press release, 2025).
Dive into Technavio’s robust research methodology, blending expert interviews, extensive data synthesis, and validated models for unparalleled Tubes And Cores Market insights. See full methodology.
|
Market Scope |
|
|
Report Coverage |
Details |
|
Page number |
198 |
|
Base year |
2024 |
|
Historic period |
2019-2023 |
|
Forecast period |
2025-2029 |
|
Growth momentum & CAGR |
Accelerate at a CAGR of 7.1% |
|
Market growth 2025-2029 |
USD 3552.6 million |
|
Market structure |
Fragmented |
|
YoY growth 2024-2025(%) |
6.8 |
|
Key countries |
US, Germany, Canada, China, Russia, Brazil, UK, Japan, Argentina, and India |
|
Competitive landscape |
Leading Companies, Market Positioning of Companies, Competitive Strategies, and Industry Risks |
Research Analyst Overview
- The market encompasses a diverse range of technologies and techniques used in the exploration, extraction, and analysis of geological samples. Two critical aspects of this industry are porosity and permeability, which significantly impact the productivity and efficiency of various processes, such as core sample preservation and assessment. Core sample preservation relies on advanced coring equipment, including wireline corers and Shelby tube samplers, to ensure sample integrity during extraction. These tools help maintain the structural and chemical properties of the samples, ensuring accurate sediment core analysis in laboratories. Core scanning technology plays a pivotal role in assessing sample integrity, providing valuable insights into the internal structure of cores.
- This technology, coupled with borehole core recovery techniques like split-barrel samplers and pressure core sampling, enables the collection of undisturbed soil cores for further testing. Core handling procedures, such as core orientation techniques and tube core extraction, are essential for minimizing sample damage and maintaining sample integrity throughout the testing process. Laboratory core testing encompasses a range of methods, including shear strength assessments, geotechnical core testing, and geological core logging. Advancements in drilling technologies, such as diamond core drilling and continuous coring systems, have led to improvements in core sample analysis, enabling more precise measurements of properties like strength and stiffness, grain size distribution, water content, and Atterberg limits.
- Geophysical logging techniques complement core sampling, providing valuable data on the geological formations surrounding the borehole. This data, combined with core sample analysis, contributes to a more comprehensive understanding of the subsurface environment. The market continues to evolve, with ongoing research and development in areas like high-resolution coring, environmental core sampling, and core description methods. These advancements aim to improve core sample preservation, enhance the accuracy and efficiency of analysis techniques, and expand the range of applications for core samples in various industries.
What are the Key Data Covered in this Tubes And Cores Market Research and Growth Report?
-
What is the expected growth of the Tubes And Cores Market between 2025 and 2029?
-
USD 3.55 billion, at a CAGR of 7.1%
-
-
What segmentation does the market report cover?
-
The report segmented by End-user (Paper industry, Textile industry, and Others), Material (Paper and Plastic), Geography (North America, Europe, APAC, South America, and Middle East and Africa), Product Type (Spiral Wound and Parallel Wound), and Shape (Cylindrical, Square, Oval, Hexagonal, Triangular, and Others)
-
-
Which regions are analyzed in the report?
-
North America, Europe, APAC, South America, and Middle East and Africa
-
-
What are the key growth drivers and market challenges?
-
Growing demand for transparent barrier film, High price of kraft papers
-
-
Who are the major players in the Tubes And Cores Market?
-
Key Companies Ace Paper Tube, Albert Eger GmbH and Co. KG, Callenor Co., Cellmark AB, Chicago Mailing Tube Co., Cores and Tubes Ltd., Greif Inc., Heartland Products Group LLC, Konfida Ambalaj Tekstil San. Tic. AS, LCH Paper Tube and Core Co., Northrich, OX Industries Inc., PTS Manufacturing Co., Rae Products and Chemicals corp, Sonoco Products Co., Transpaco Ltd., Valk Industries Inc., VPK Group, Wes Pac Inc., and Western Container Corp.
-
Market Research Insights
- The market encompasses a diverse range of applications, including data acquisition systems, in-situ testing, contaminant transport studies, and core sample preparation for various industries such as dam design, regulatory compliance, hydrogeological studies, laboratory testing, geotechnical investigation, mineral exploration, pipeline design, environmental site assessment, geological mapping, and petroleum exploration. The market exhibits continuous growth, with the demand for tubes and cores increasing due to the need for accurate geological and geotechnical information. For instance, the number of hydrogeological studies conducted annually has risen by 15% over the last decade, leading to a corresponding increase in the demand for tubes and cores.
- Furthermore, the integration of advanced data interpretation techniques, numerical modeling, and geotechnical modeling in dam design and tunnel design processes has significantly boosted the market's growth. The market for tubes and cores is expected to remain dynamic, driven by the evolving requirements of industries and the ongoing advancements in technology.
We can help! Our analysts can customize this tubes and cores market research report to meet your requirements.
 RIA -
RIA - 
