Turbo Expanders Market Analysis, Size, and Forecast 2026-2030: APAC (China, India, and Japan), North America (US, Canada, and Mexico), Europe (Germany, UK, and France), Middle East and Africa (Saudi Arabia, UAE, and South Africa), South America (Brazil and Argentina), and Rest of World (ROW)

Turbo Expanders Market Analysis, Size, and Forecast 2026-2030:
APAC (China, India, and Japan), North America (US, Canada, and Mexico), Europe (Germany, UK, and France), Middle East and Africa (Saudi Arabia, UAE, and South Africa), South America (Brazil and Argentina), and Rest of World (ROW)

Published: May 2026 308 Pages SKU: IRTNTR43972

Market Overview at a Glance

$375.7 Mn
Market Opportunity
5.6%
CAGR 2025 - 2030
40.8%
APAC Growth
$661.3 Mn
Radial flow segment 2024

Turbo Expanders Market Size 2026-2030

The turbo expanders market size is valued to increase by USD 375.7 million, at a CAGR of 5.6% from 2025 to 2030. Expansion of global natural gas and liquefied natural gas infrastructure will drive the turbo expanders market.

Major Market Trends & Insights

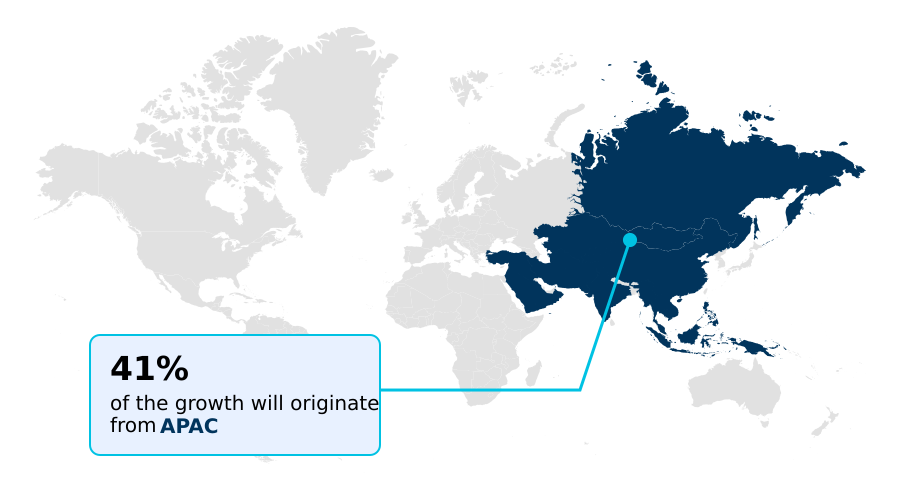
  • APAC dominated the market and accounted for a 40.8% growth during the forecast period.
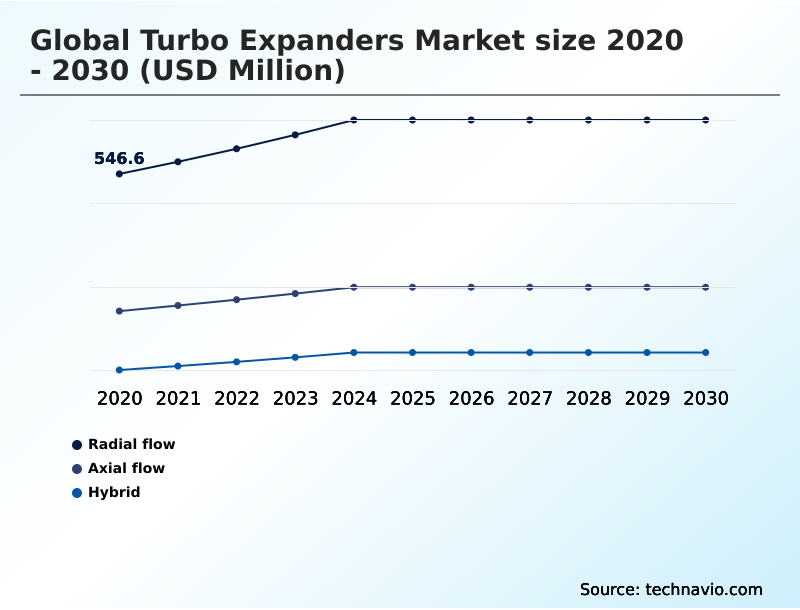
  • By Product Type - Radial flow segment was valued at USD 661.3 million in 2024
  • By Type - Compressor coupled segment accounted for the largest market revenue share in 2024

Market Size & Forecast

  • Market Opportunities: USD 637.3 million
  • Market Future Opportunities: USD 375.7 million
  • CAGR from 2025 to 2030 : 5.6%

Market Summary

  • The turbo expanders market is undergoing significant evolution, driven by the intensification of liquefied natural gas production and the emerging requirements of the hydrogen economy. These sophisticated machines are indispensable for industrial gas processing, converting the high pressure of a gas stream into useful mechanical work while enabling cryogenic liquefaction.
  • Industrial operators are prioritizing energy recovery systems to enhance thermodynamic efficiency, reducing operational expenses and aligning with sustainability mandates. For instance, a modern petrochemical facility can replace legacy Joule-Thomson valves with high-efficiency turbo expanders to capture previously wasted energy, improving the site's energy balance.
  • The industry's technical focus is shifting toward the adoption of active magnetic bearings and sophisticated digital monitoring for predictive maintenance, addressing historical concerns about reliability. Beyond traditional oil and gas applications, demand is rising in the medical and scientific sectors for cryogenic services.
  • As the industrial sector transitions toward lower-carbon energy, the role of turbo expanders in carbon capture utilization and storage is also expanding, positioning the technology as a cornerstone of future energy architecture and industrial decarbonization.

What will be the Size of the Turbo Expanders Market during the forecast period?

Get Key Insights on Market Forecast (PDF) Get Free Sample

How is the Turbo Expanders Market Segmented?

The turbo expanders industry research report provides comprehensive data (region-wise segment analysis), with forecasts and estimates in "USD million" for the period 2026-2030, as well as historical data from 2020-2024 for the following segments.

  • Product type
    • Radial flow
    • Axial flow
    • Hybrid
  • Type
    • Compressor coupled
    • Generator coupled
    • Hydraulic
  • End-user
    • Oil and gas
    • Industrial gases
    • Power generation
    • Others
  • Geography
    • APAC
      • China
      • India
      • Japan
    • North America
      • US
      • Canada
      • Mexico
    • Europe
      • Germany
      • UK
      • France
    • Middle East and Africa
      • Saudi Arabia
      • UAE
      • South Africa
    • South America
      • Brazil
      • Argentina
    • Rest of World (ROW)

By Product Type Insights

The radial flow segment is estimated to witness significant growth during the forecast period.

The radial flow segment is foundational in cryogenic gas processing, driven by its application in hydrocarbon recovery. These machines, featuring a specialized radial flow impeller, are engineered for high-pressure ratios, making them ideal for the liquefaction of industrial gases.

The design allows for a significant pressure drop across a single stage, which optimizes the overall thermodynamic efficiency.

In applications like an air separation unit, which supports heavy industrial sectors, radial designs are prioritized for their mechanical simplicity and lower maintenance, reducing interruptions by up to 15%.

As industries move toward decentralized energy recovery systems, demand is high, supported by advancements in materials science for cryogenic temperatures and the need for efficient gas stream expansion to produce mechanical work for grid stabilization.

The technology is also key for shale gas resources.

Get Free Sample

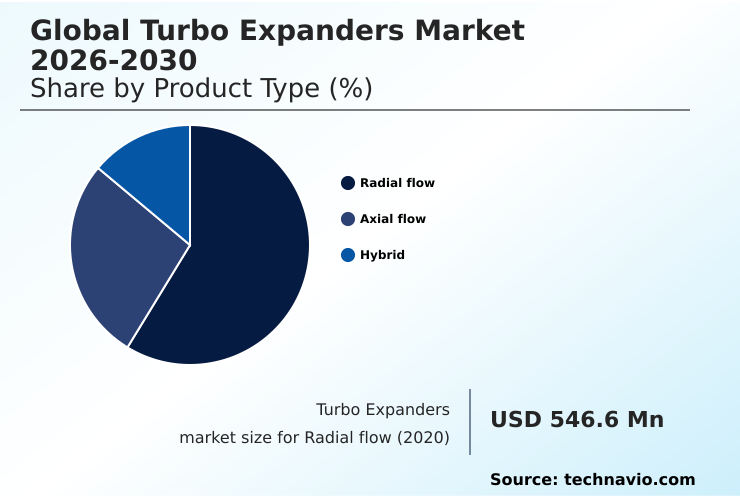
The Radial flow segment was valued at USD 661.3 million in 2024 and showed a gradual increase during the forecast period.

Get Free Sample

Regional Analysis

APAC is estimated to contribute 40.8% to the growth of the global market during the forecast period.Technavio’s analysts have elaborately explained the regional trends and drivers that shape the market during the forecast period.

See How Turbo Expanders Market Demand is Rising in APAC Get Free Sample

The geographic landscape is shifting, with APAC accounting for over 40% of incremental growth due to massive industrialization and investment in carbon capture utilization and storage.

North America remains vital, leveraging axial flow turbine technology for large-scale power generation and geothermal energy conversion.

Europe’s market, driven by stringent targets, promotes hydraulic braking in niche applications and waste heat recovery, with some sites improving thermal efficiency by 25% via organic rankine cycle integration in waste gas energy recovery.

The global demand for compressor coupled systems is growing, supporting liquefaction plant development and renewable energy integration. This industrial decarbonization push requires sophisticated solutions for supercritical carbon dioxide handling and supports the build-out of a robust hydrogen value chain.

Market Dynamics

Our researchers analyzed the data with 2025 as the base year, along with the key drivers, trends, and challenges. A holistic analysis of drivers will help companies refine their marketing strategies to gain a competitive advantage.

  • Strategic decision-making in the turbo expanders market is increasingly focused on specialized applications and comparative performance. Evaluating a radial vs axial flow turbo expander is crucial, as radial designs are often preferred for their robustness in turbo expander in natural gas processing, while axial flow is superior for high-volume power generation.
  • The push for oil-free turbo expander with magnetic bearings technology is driven by the need for process purity, especially in a turbo expander for hydrogen liquefaction, where contamination is unacceptable.
  • Energy recovery with turbo expander systems is a key investment criterion, with a turbo expander generator for pressure reduction in gas grids offering a return on investment that is over 30% faster than older pressure-reducing valve systems. For industrial gas production, a cryogenic turbo expander for air separation is essential.
  • Engineers now rely on advanced modeling for predicting turbo expander performance, optimizing the isentropic efficiency of turbo expanders. A multi-stage turbo expander design is critical for achieving deep cryogenic temperatures in a turbo expander compressor in lng plants. Innovations like a high-speed direct-drive turbo expander are improving footprint and reliability.
  • The technology is also pivotal for a turbo expander for geothermal power and in emerging turbo expander in carbon capture schemes.
  • The axial flow turbine for power generation from waste heat, hydraulic brake turbo expander application in labs, and use in turbo expander in hydrocarbon dew pointing demonstrate the technology's versatility, including in small-scale lng turbo expander and turbo expander for ethylene production.

What are the key market drivers leading to the rise in the adoption of Turbo Expanders Industry?

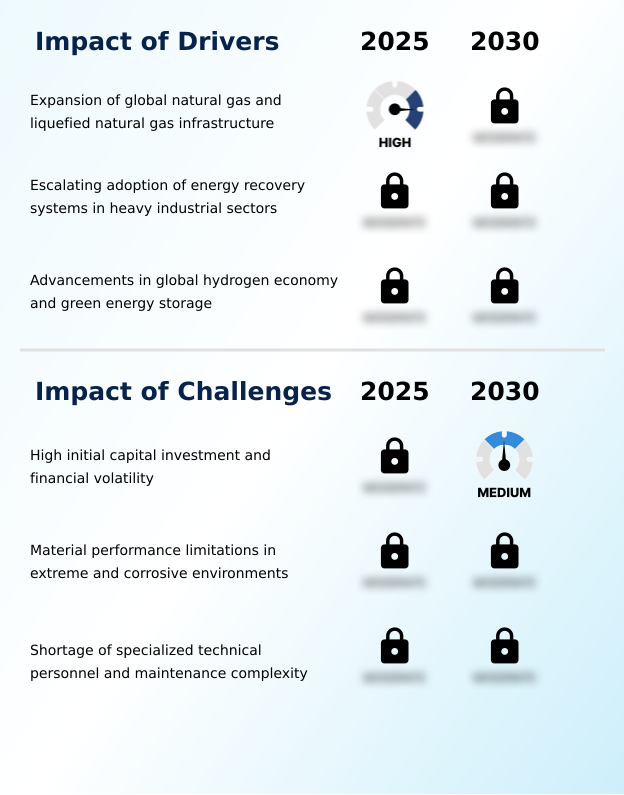
  • The expansion of global natural gas and liquefied natural gas infrastructure serves as a key driver stimulating market growth.

  • The market is driven by the global expansion of natural gas liquids infrastructure and the escalating adoption of energy recovery in industrial gas processing.
  • Turbo expanders are essential for the cryogenic liquefaction required for transport and the recovery of valuable liquids. Unlike traditional Joule-Thomson valves, these systems convert pressure enthalpy into power.
  • For example, integrating power recovery units in pressure let-down stations for industrial use can generate enough electricity to reduce site energy costs by over 10%.
  • Advancements in the green energy storage sector, such as long-duration energy storage, also rely on this technology. The expansion of regasification terminals and modular turbo expanders is crucial.
  • The use of a centrifugal compressor coupled with an expander improves overall plant efficiency and supports the growing demand from clean energy infrastructure.

What are the market trends shaping the Turbo Expanders Industry?

  • The digitalization and integration of digital twin technology are emerging as a prominent market trend, enhancing operational monitoring and predictive maintenance capabilities.

  • A key trend is the accelerated adoption of digital twin technology and oil-free operation, which enhance predictive maintenance. Systems using active magnetic bearings eliminate process contamination, a critical factor for hydrogen liquefaction, and can increase rotational speeds, improving the isentropic efficiency of multi-stage expansion by up to 5%. This shift is vital for the emerging hydrogen value chain.
  • The implementation of high-speed rotating machinery with advanced aerodynamic performance monitoring offers operators automated insights, optimizing processes under varying loads and reducing unplanned downtime by over 20%. The convergence of mechanical engineering and data science is making the next generation of generator coupled systems more intelligent, a pivotal change for the energy transition and decarbonization efforts.
  • This is also important for refinery modernization.

What challenges does the Turbo Expanders Industry face during its growth?

  • High initial capital investment and financial volatility present a significant challenge affecting the industry's growth trajectory.

  • Significant challenges persist, including high initial capital investment for bespoke machinery like integrally geared compressors and material performance limitations. For instance, projects involving subsea applications can see capital costs increase by over 40% compared to onshore installations. Maintaining integrity during fluid catalytic cracking or in high-purity environments requires advanced metallurgy, impacting rotor dynamics and blade profile optimization.
  • The shortage of specialized personnel for maintaining systems in remote geothermal power plants leads to extended downtime. The complexity of dissipated-load expanders and dry gas seal systems adds to the operational burden, creating a high threshold for technical success in sectors managing blast furnace exhaust or requiring precise process cooling and gas decompression.

Exclusive Technavio Analysis on Customer Landscape

The turbo expanders market forecasting report includes the adoption lifecycle of the market, covering from the innovator’s stage to the laggard’s stage. It focuses on adoption rates in different regions based on penetration. Furthermore, the turbo expanders market report also includes key purchase criteria and drivers of price sensitivity to help companies evaluate and develop their market growth analysis strategies.

Customer Landscape of Turbo Expanders Industry

Competitive Landscape

Companies are implementing various strategies, such as strategic alliances, turbo expanders market forecast, partnerships, mergers and acquisitions, geographical expansion, and product/service launches, to enhance their presence in the industry.

Air Liquide SA - Expertise in delivering advanced turbo expander solutions for complex industrial gas and energy transition applications, ensuring high performance and reliability.

The industry research and growth report includes detailed analyses of the competitive landscape of the market and information about key companies, including:

  • Air Liquide SA
  • Air Products and Chem Inc.
  • ARANER
  • Atlas Copco AB
  • Baker Hughes Co.
  • BORSIG GmbH
  • Calnetix Technologies LLC
  • Chart Industries Inc.
  • Cryostar
  • Elliott Company
  • Flowserve Corp.
  • Honeywell International Inc.
  • IHI Corp.
  • Kobe Steel Ltd.
  • MAN Energy Solutions SE
  • Mitsubishi Heavy Industries
  • Nikkiso Cryogenic Industries
  • PBS Group AS
  • Rotor Tech Inc
  • Siemens Energy AG
  • TURBOGAZ PRJSC

Qualitative and quantitative analysis of companies has been conducted to help clients understand the wider business environment as well as the strengths and weaknesses of key industry players. Data is qualitatively analyzed to categorize companies as pure play, category-focused, industry-focused, and diversified; it is quantitatively analyzed to categorize companies as dominant, leading, strong, tentative, and weak.

Recent Development and News in Turbo expanders market

  • In May 2025, QatarEnergy announced the integration of advanced turbo expander technology within its North Field South expansion project to maximize the recovery of liquid hydrocarbons.
  • In September 2025, ArcelorMittal inaugurated a state-of-the-art waste gas energy recovery system at a primary European steel manufacturing site, utilizing a top gas recovery turbine to capture energy.
  • In January 2025, Linde Engineering successfully commissioned a large-scale hydrogen liquefaction plant in East Asia, which incorporates high-speed radial turbo expanders for extreme cryogenic requirements.
  • In February 2025, Baker Hughes introduced an updated version of its Cordant digital suite, featuring a specialized module for monitoring the thermal efficiency and aerodynamic performance of high-speed rotating machinery.

Dive into Technavio’s robust research methodology, blending expert interviews, extensive data synthesis, and validated models for unparalleled Turbo Expanders Market insights. See full methodology.

Market Scope
Page number 308
Base year 2025
Historic period 2020-2024
Forecast period 2026-2030
Growth momentum & CAGR Accelerate at a CAGR of 5.6%
Market growth 2026-2030 USD 375.7 million
Market structure Fragmented
YoY growth 2025-2026(%) 5.3%
Key countries China, India, Japan, South Korea, Australia, Indonesia, US, Canada, Mexico, Germany, Russia, UK, France, Italy, Norway, Saudi Arabia, UAE, South Africa, Egypt, Turkey, Brazil, Argentina and Chile
Competitive landscape Leading Companies, Market Positioning of Companies, Competitive Strategies, and Industry Risks

Request Free Sample

Research Analyst Overview

  • The turbo expanders market is defined by its critical role in enhancing thermodynamic efficiency across energy-intensive industries. Boardroom decisions increasingly center on adopting these systems to meet sustainability mandates and reduce operational costs. The integration of power recovery technology, for instance, has demonstrated a reduction in plant energy consumption by over 15% in certain applications.
  • A significant trend is the shift from conventional designs to advanced systems featuring active magnetic bearings for oil-free operation, which is paramount for hydrogen liquefaction and high-purity gas stream expansion. The use of digital twins to monitor rotor dynamics and aerodynamic performance of high-speed rotating machinery is becoming standard.
  • These machines are essential for cryogenic gas processing, hydrocarbon recovery, and are replacing inefficient Joule-Thomson valves. Innovations in multi-stage expansion, blade profile optimization, and integrally geared compressors are enabling higher isentropic efficiency, especially as the industry moves toward subsea applications and manages challenging processes like fluid catalytic cracking and waste heat recovery.
  • The technology, including generator coupled and compressor coupled configurations, is fundamental to handling supercritical carbon dioxide and achieving deep cryogenic temperatures for the entire energy value chain.

What are the Key Data Covered in this Turbo Expanders Market Research and Growth Report?

  • What is the expected growth of the Turbo Expanders Market between 2026 and 2030?

    • USD 375.7 million, at a CAGR of 5.6%

  • What segmentation does the market report cover?

    • The report is segmented by Product Type (Radial flow, Axial flow, and Hybrid), Type (Compressor coupled, Generator coupled, and Hydraulic), End-user (Oil and gas, Industrial gases, Power generation, and Others) and Geography (APAC, North America, Europe, Middle East and Africa, South America)

  • Which regions are analyzed in the report?

    • APAC, North America, Europe, Middle East and Africa and South America

  • What are the key growth drivers and market challenges?

    • Expansion of global natural gas and liquefied natural gas infrastructure, High initial capital investment and financial volatility

  • Who are the major players in the Turbo Expanders Market?

    • Air Liquide SA, Air Products and Chem Inc., ARANER, Atlas Copco AB, Baker Hughes Co., BORSIG GmbH, Calnetix Technologies LLC, Chart Industries Inc., Cryostar, Elliott Company, Flowserve Corp., Honeywell International Inc., IHI Corp., Kobe Steel Ltd., MAN Energy Solutions SE, Mitsubishi Heavy Industries, Nikkiso Cryogenic Industries, PBS Group AS, Rotor Tech Inc, Siemens Energy AG and TURBOGAZ PRJSC

Market Research Insights

  • Market dynamics are shaped by the dual pressures of industrial decarbonization and the high capital costs of advanced machinery. The push for green energy storage and renewable energy integration drives the adoption of energy recovery systems, with facilities reporting up to a 20% reduction in external power purchases by leveraging waste gas energy recovery.
  • However, the high initial outlay for modular turbo expanders and refinery modernization projects remains a barrier. The shift toward the hydrogen value chain and long-duration energy storage is creating new demand verticals, especially in high-purity environments.
  • Stakeholders are focused on technologies that support the broader energy transition and clean energy infrastructure, where the integration of advanced turbines can improve the efficiency of a liquefaction plant by over 15% compared to conventional methods. The development of shale gas resources and regasification terminals continues to fuel demand, balancing the challenges of financial volatility.

We can help! Our analysts can customize this turbo expanders market research report to meet your requirements.

Get in touch

1. Executive Summary

1.1 Market overview

Executive Summary - Chart on Market Overview
Executive Summary - Data Table on Market Overview
Executive Summary - Chart on Global Market Characteristics
Executive Summary - Chart on Market by Geography
Executive Summary - Chart on Market Segmentation by Product Type
Executive Summary - Chart on Market Segmentation by Type
Executive Summary - Chart on Market Segmentation by End-user
Executive Summary - Chart on Incremental Growth
Executive Summary - Data Table on Incremental Growth
Executive Summary - Chart on Company Market Positioning

2. Technavio Analysis

2.1 Analysis of price sensitivity, lifecycle, customer purchase basket, adoption rates, and purchase criteria

2.2 Criticality of inputs and Factors of differentiation

Chart on Overview on criticality of inputs and factors of differentiation

2.3 Factors of disruption

Chart on Overview on factors of disruption

2.4 Impact of drivers and challenges

Chart on Impact of drivers and challenges in 2025 and 2030

3. Market Landscape

3.1 Market ecosystem

Chart on Parent Market
Data Table on - Parent Market

3.2 Market characteristics

Chart on Market characteristics analysis

3.3 Value chain analysis

Chart on Value chain analysis

4. Market Sizing

4.1 Market definition

Data Table on Offerings of companies included in the market definition

4.2 Market segment analysis

Market segments

4.3 Market size 2025

4.4 Market outlook: Forecast for 2025-2030

Chart on Global - Market size and forecast 2025-2030 ($ million)
Data Table on Global - Market size and forecast 2025-2030 ($ million)
Chart on Global Market: Year-over-year growth 2025-2030 (%)
Data Table on Global Market: Year-over-year growth 2025-2030 (%)

5. Historic Market Size

5.1 Global Turbo Expanders Market 2020 - 2024

Historic Market Size - Data Table on Global Turbo Expanders Market 2020 - 2024 ($ million)

5.2 Product Type segment analysis 2020 - 2024

Historic Market Size - Product Type Segment 2020 - 2024 ($ million)

5.3 Type segment analysis 2020 - 2024

Historic Market Size - Type Segment 2020 - 2024 ($ million)

5.4 End-user segment analysis 2020 - 2024

Historic Market Size - End-user Segment 2020 - 2024 ($ million)

5.5 Geography segment analysis 2020 - 2024

Historic Market Size - Geography Segment 2020 - 2024 ($ million)

5.6 Country segment analysis 2020 - 2024

Historic Market Size - Country Segment 2020 - 2024 ($ million)

6. Qualitative Analysis

6.1 Impact of AI on Global turbo expanders market

6.2 Impact of geopolitical conflicts on Global turbo expanders market

7. Five Forces Analysis

7.1 Five forces summary

Five forces analysis - Comparison between 2025 and 2030

7.2 Bargaining power of buyers

Bargaining power of buyers - Impact of key factors 2025 and 2030

7.3 Bargaining power of suppliers

Bargaining power of suppliers - Impact of key factors in 2025 and 2030

7.4 Threat of new entrants

Threat of new entrants - Impact of key factors in 2025 and 2030

7.5 Threat of substitutes

Threat of substitutes - Impact of key factors in 2025 and 2030

7.6 Threat of rivalry

Threat of rivalry - Impact of key factors in 2025 and 2030

7.7 Market condition

Chart on Market condition - Five forces 2025 and 2030

8. Market Segmentation by Product Type

8.1 Market segments

Chart on Product Type - Market share 2025-2030 (%)
Data Table on Product Type - Market share 2025-2030 (%)

8.2 Comparison by Product Type

Chart on Comparison by Product Type
Data Table on Comparison by Product Type

8.3 Radial flow - Market size and forecast 2025-2030

Chart on Radial flow - Market size and forecast 2025-2030 ($ million)
Data Table on Radial flow - Market size and forecast 2025-2030 ($ million)
Chart on Radial flow - Year-over-year growth 2025-2030 (%)
Data Table on Radial flow - Year-over-year growth 2025-2030 (%)

8.4 Axial flow - Market size and forecast 2025-2030

Chart on Axial flow - Market size and forecast 2025-2030 ($ million)
Data Table on Axial flow - Market size and forecast 2025-2030 ($ million)
Chart on Axial flow - Year-over-year growth 2025-2030 (%)
Data Table on Axial flow - Year-over-year growth 2025-2030 (%)

8.5 Hybrid - Market size and forecast 2025-2030

Chart on Hybrid - Market size and forecast 2025-2030 ($ million)
Data Table on Hybrid - Market size and forecast 2025-2030 ($ million)
Chart on Hybrid - Year-over-year growth 2025-2030 (%)
Data Table on Hybrid - Year-over-year growth 2025-2030 (%)

8.6 Market opportunity by Product Type

Market opportunity by Product Type ($ million)
Data Table on Market opportunity by Product Type ($ million)

9. Market Segmentation by Type

9.1 Market segments

Chart on Type - Market share 2025-2030 (%)
Data Table on Type - Market share 2025-2030 (%)

9.2 Comparison by Type

Chart on Comparison by Type
Data Table on Comparison by Type

9.3 Compressor coupled - Market size and forecast 2025-2030

Chart on Compressor coupled - Market size and forecast 2025-2030 ($ million)
Data Table on Compressor coupled - Market size and forecast 2025-2030 ($ million)
Chart on Compressor coupled - Year-over-year growth 2025-2030 (%)
Data Table on Compressor coupled - Year-over-year growth 2025-2030 (%)

9.4 Generator coupled - Market size and forecast 2025-2030

Chart on Generator coupled - Market size and forecast 2025-2030 ($ million)
Data Table on Generator coupled - Market size and forecast 2025-2030 ($ million)
Chart on Generator coupled - Year-over-year growth 2025-2030 (%)
Data Table on Generator coupled - Year-over-year growth 2025-2030 (%)

9.5 Hydraulic - Market size and forecast 2025-2030

Chart on Hydraulic - Market size and forecast 2025-2030 ($ million)
Data Table on Hydraulic - Market size and forecast 2025-2030 ($ million)
Chart on Hydraulic - Year-over-year growth 2025-2030 (%)
Data Table on Hydraulic - Year-over-year growth 2025-2030 (%)

9.6 Market opportunity by Type

Market opportunity by Type ($ million)
Data Table on Market opportunity by Type ($ million)

10. Market Segmentation by End-user

10.1 Market segments

Chart on End-user - Market share 2025-2030 (%)
Data Table on End-user - Market share 2025-2030 (%)

10.2 Comparison by End-user

Chart on Comparison by End-user
Data Table on Comparison by End-user

10.3 Oil and gas - Market size and forecast 2025-2030

Chart on Oil and gas - Market size and forecast 2025-2030 ($ million)
Data Table on Oil and gas - Market size and forecast 2025-2030 ($ million)
Chart on Oil and gas - Year-over-year growth 2025-2030 (%)
Data Table on Oil and gas - Year-over-year growth 2025-2030 (%)

10.4 Industrial gases - Market size and forecast 2025-2030

Chart on Industrial gases - Market size and forecast 2025-2030 ($ million)
Data Table on Industrial gases - Market size and forecast 2025-2030 ($ million)
Chart on Industrial gases - Year-over-year growth 2025-2030 (%)
Data Table on Industrial gases - Year-over-year growth 2025-2030 (%)

10.5 Power generation - Market size and forecast 2025-2030

Chart on Power generation - Market size and forecast 2025-2030 ($ million)
Data Table on Power generation - Market size and forecast 2025-2030 ($ million)
Chart on Power generation - Year-over-year growth 2025-2030 (%)
Data Table on Power generation - Year-over-year growth 2025-2030 (%)

10.6 Others - Market size and forecast 2025-2030

Chart on Others - Market size and forecast 2025-2030 ($ million)
Data Table on Others - Market size and forecast 2025-2030 ($ million)
Chart on Others - Year-over-year growth 2025-2030 (%)
Data Table on Others - Year-over-year growth 2025-2030 (%)

10.7 Market opportunity by End-user

Market opportunity by End-user ($ million)
Data Table on Market opportunity by End-user ($ million)

11. Customer Landscape

11.1 Customer landscape overview

Analysis of price sensitivity, lifecycle, customer purchase basket, adoption rates, and purchase criteria

12. Geographic Landscape

12.1 Geographic segmentation

Chart on Market share by geography 2025-2030 (%)
Data Table on Market share by geography 2025-2030 (%)

12.2 Geographic comparison

Chart on Geographic comparison
Data Table on Geographic comparison

12.3 APAC - Market size and forecast 2025-2030

Chart on APAC - Market size and forecast 2025-2030 ($ million)
Data Table on APAC - Market size and forecast 2025-2030 ($ million)
Chart on APAC - Year-over-year growth 2025-2030 (%)
Data Table on APAC - Year-over-year growth 2025-2030 (%)
Chart on Regional Comparison - APAC
Data Table on Regional Comparison - APAC

12.3.1 China - Market size and forecast 2025-2030

Chart on China - Market size and forecast 2025-2030 ($ million)
Data Table on China - Market size and forecast 2025-2030 ($ million)
Chart on China - Year-over-year growth 2025-2030 (%)
Data Table on China - Year-over-year growth 2025-2030 (%)

12.3.2 India - Market size and forecast 2025-2030

Chart on India - Market size and forecast 2025-2030 ($ million)
Data Table on India - Market size and forecast 2025-2030 ($ million)
Chart on India - Year-over-year growth 2025-2030 (%)
Data Table on India - Year-over-year growth 2025-2030 (%)

12.3.3 Japan - Market size and forecast 2025-2030

Chart on Japan - Market size and forecast 2025-2030 ($ million)
Data Table on Japan - Market size and forecast 2025-2030 ($ million)
Chart on Japan - Year-over-year growth 2025-2030 (%)
Data Table on Japan - Year-over-year growth 2025-2030 (%)

12.3.4 South Korea - Market size and forecast 2025-2030

Chart on South Korea - Market size and forecast 2025-2030 ($ million)
Data Table on South Korea - Market size and forecast 2025-2030 ($ million)
Chart on South Korea - Year-over-year growth 2025-2030 (%)
Data Table on South Korea - Year-over-year growth 2025-2030 (%)

12.3.5 Australia - Market size and forecast 2025-2030

Chart on Australia - Market size and forecast 2025-2030 ($ million)
Data Table on Australia - Market size and forecast 2025-2030 ($ million)
Chart on Australia - Year-over-year growth 2025-2030 (%)
Data Table on Australia - Year-over-year growth 2025-2030 (%)

12.3.6 Indonesia - Market size and forecast 2025-2030

Chart on Indonesia - Market size and forecast 2025-2030 ($ million)
Data Table on Indonesia - Market size and forecast 2025-2030 ($ million)
Chart on Indonesia - Year-over-year growth 2025-2030 (%)
Data Table on Indonesia - Year-over-year growth 2025-2030 (%)

12.4 North America - Market size and forecast 2025-2030

Chart on North America - Market size and forecast 2025-2030 ($ million)
Data Table on North America - Market size and forecast 2025-2030 ($ million)
Chart on North America - Year-over-year growth 2025-2030 (%)
Data Table on North America - Year-over-year growth 2025-2030 (%)
Chart on Regional Comparison - North America
Data Table on Regional Comparison - North America

12.4.1 US - Market size and forecast 2025-2030

Chart on US - Market size and forecast 2025-2030 ($ million)
Data Table on US - Market size and forecast 2025-2030 ($ million)
Chart on US - Year-over-year growth 2025-2030 (%)
Data Table on US - Year-over-year growth 2025-2030 (%)

12.4.2 Canada - Market size and forecast 2025-2030

Chart on Canada - Market size and forecast 2025-2030 ($ million)
Data Table on Canada - Market size and forecast 2025-2030 ($ million)
Chart on Canada - Year-over-year growth 2025-2030 (%)
Data Table on Canada - Year-over-year growth 2025-2030 (%)

12.4.3 Mexico - Market size and forecast 2025-2030

Chart on Mexico - Market size and forecast 2025-2030 ($ million)
Data Table on Mexico - Market size and forecast 2025-2030 ($ million)
Chart on Mexico - Year-over-year growth 2025-2030 (%)
Data Table on Mexico - Year-over-year growth 2025-2030 (%)

12.5 Europe - Market size and forecast 2025-2030

Chart on Europe - Market size and forecast 2025-2030 ($ million)
Data Table on Europe - Market size and forecast 2025-2030 ($ million)
Chart on Europe - Year-over-year growth 2025-2030 (%)
Data Table on Europe - Year-over-year growth 2025-2030 (%)
Chart on Regional Comparison - Europe
Data Table on Regional Comparison - Europe

12.5.1 Germany - Market size and forecast 2025-2030

Chart on Germany - Market size and forecast 2025-2030 ($ million)
Data Table on Germany - Market size and forecast 2025-2030 ($ million)
Chart on Germany - Year-over-year growth 2025-2030 (%)
Data Table on Germany - Year-over-year growth 2025-2030 (%)

12.5.2 Russia - Market size and forecast 2025-2030

Chart on Russia - Market size and forecast 2025-2030 ($ million)
Data Table on Russia - Market size and forecast 2025-2030 ($ million)
Chart on Russia - Year-over-year growth 2025-2030 (%)
Data Table on Russia - Year-over-year growth 2025-2030 (%)

12.5.3 UK - Market size and forecast 2025-2030

Chart on UK - Market size and forecast 2025-2030 ($ million)
Data Table on UK - Market size and forecast 2025-2030 ($ million)
Chart on UK - Year-over-year growth 2025-2030 (%)
Data Table on UK - Year-over-year growth 2025-2030 (%)

12.5.4 France - Market size and forecast 2025-2030

Chart on France - Market size and forecast 2025-2030 ($ million)
Data Table on France - Market size and forecast 2025-2030 ($ million)
Chart on France - Year-over-year growth 2025-2030 (%)
Data Table on France - Year-over-year growth 2025-2030 (%)

12.5.5 Italy - Market size and forecast 2025-2030

Chart on Italy - Market size and forecast 2025-2030 ($ million)
Data Table on Italy - Market size and forecast 2025-2030 ($ million)
Chart on Italy - Year-over-year growth 2025-2030 (%)
Data Table on Italy - Year-over-year growth 2025-2030 (%)

12.5.6 Norway - Market size and forecast 2025-2030

Chart on Norway - Market size and forecast 2025-2030 ($ million)
Data Table on Norway - Market size and forecast 2025-2030 ($ million)
Chart on Norway - Year-over-year growth 2025-2030 (%)
Data Table on Norway - Year-over-year growth 2025-2030 (%)

12.6 Middle East and Africa - Market size and forecast 2025-2030

Chart on Middle East and Africa - Market size and forecast 2025-2030 ($ million)
Data Table on Middle East and Africa - Market size and forecast 2025-2030 ($ million)
Chart on Middle East and Africa - Year-over-year growth 2025-2030 (%)
Data Table on Middle East and Africa - Year-over-year growth 2025-2030 (%)
Chart on Regional Comparison - Middle East and Africa
Data Table on Regional Comparison - Middle East and Africa

12.6.1 Saudi Arabia - Market size and forecast 2025-2030

Chart on Saudi Arabia - Market size and forecast 2025-2030 ($ million)
Data Table on Saudi Arabia - Market size and forecast 2025-2030 ($ million)
Chart on Saudi Arabia - Year-over-year growth 2025-2030 (%)
Data Table on Saudi Arabia - Year-over-year growth 2025-2030 (%)

12.6.2 UAE - Market size and forecast 2025-2030

Chart on UAE - Market size and forecast 2025-2030 ($ million)
Data Table on UAE - Market size and forecast 2025-2030 ($ million)
Chart on UAE - Year-over-year growth 2025-2030 (%)
Data Table on UAE - Year-over-year growth 2025-2030 (%)

12.6.3 South Africa - Market size and forecast 2025-2030

Chart on South Africa - Market size and forecast 2025-2030 ($ million)
Data Table on South Africa - Market size and forecast 2025-2030 ($ million)
Chart on South Africa - Year-over-year growth 2025-2030 (%)
Data Table on South Africa - Year-over-year growth 2025-2030 (%)

12.6.4 Egypt - Market size and forecast 2025-2030

Chart on Egypt - Market size and forecast 2025-2030 ($ million)
Data Table on Egypt - Market size and forecast 2025-2030 ($ million)
Chart on Egypt - Year-over-year growth 2025-2030 (%)
Data Table on Egypt - Year-over-year growth 2025-2030 (%)

12.6.5 Turkey - Market size and forecast 2025-2030

Chart on Turkey - Market size and forecast 2025-2030 ($ million)
Data Table on Turkey - Market size and forecast 2025-2030 ($ million)
Chart on Turkey - Year-over-year growth 2025-2030 (%)
Data Table on Turkey - Year-over-year growth 2025-2030 (%)

12.7 South America - Market size and forecast 2025-2030

Chart on South America - Market size and forecast 2025-2030 ($ million)
Data Table on South America - Market size and forecast 2025-2030 ($ million)
Chart on South America - Year-over-year growth 2025-2030 (%)
Data Table on South America - Year-over-year growth 2025-2030 (%)
Chart on Regional Comparison - South America
Data Table on Regional Comparison - South America

12.7.1 Brazil - Market size and forecast 2025-2030

Chart on Brazil - Market size and forecast 2025-2030 ($ million)
Data Table on Brazil - Market size and forecast 2025-2030 ($ million)
Chart on Brazil - Year-over-year growth 2025-2030 (%)
Data Table on Brazil - Year-over-year growth 2025-2030 (%)

12.7.2 Argentina - Market size and forecast 2025-2030

Chart on Argentina - Market size and forecast 2025-2030 ($ million)
Data Table on Argentina - Market size and forecast 2025-2030 ($ million)
Chart on Argentina - Year-over-year growth 2025-2030 (%)
Data Table on Argentina - Year-over-year growth 2025-2030 (%)

12.7.3 Chile - Market size and forecast 2025-2030

Chart on Chile - Market size and forecast 2025-2030 ($ million)
Data Table on Chile - Market size and forecast 2025-2030 ($ million)
Chart on Chile - Year-over-year growth 2025-2030 (%)
Data Table on Chile - Year-over-year growth 2025-2030 (%)

12.8 Market opportunity by geography

Market opportunity by geography ($ million)
Data Tables on Market opportunity by geography ($ million)

13. Drivers, Challenges, and Opportunity

13.1 Market drivers

Expansion of global natural gas and liquefied natural gas infrastructure
Escalating adoption of energy recovery systems in heavy industrial sectors
Advancements in global hydrogen economy and green energy storage

13.2 Market challenges

High initial capital investment and financial volatility
Material performance limitations in extreme and corrosive environments
Shortage of specialized technical personnel and maintenance complexity

13.3 Impact of drivers and challenges

Impact of drivers and challenges in 2025 and 2030

13.4 Market opportunities

Digitalization and integration of digital twin technology
Shift toward oil-free operation with active magnetic bearings
Optimization for hydrogen value chain and cryogenic liquefaction

14. Competitive Landscape

14.1 Overview

14.2

Overview on criticality of inputs and factors of differentiation

14.3 Landscape disruption

Overview on factors of disruption

14.4 Industry risks

Impact of key risks on business

15. Competitive Analysis

15.1 Companies profiled

Companies covered

15.2 Company ranking index

15.3 Market positioning of companies

Matrix on companies position and classification

15.4 Air Liquide SA

Air Liquide SA - Overview
Air Liquide SA - Business segments
Air Liquide SA - Key offerings
Air Liquide SA - Segment focus
SWOT

15.5 Air Products and Chem Inc.

Air Products and Chem Inc. - Overview
Air Products and Chem Inc. - Business segments
Air Products and Chem Inc. - Key offerings
Air Products and Chem Inc. - Segment focus
SWOT

15.6 Atlas Copco AB

Atlas Copco AB - Overview
Atlas Copco AB - Business segments
Atlas Copco AB - Key offerings
Atlas Copco AB - Segment focus
SWOT

15.7 Baker Hughes Co.

Baker Hughes Co. - Overview
Baker Hughes Co. - Business segments
Baker Hughes Co. - Key offerings
Baker Hughes Co. - Segment focus
SWOT

15.8 Calnetix Technologies LLC

Calnetix Technologies LLC - Overview
Calnetix Technologies LLC - Product / Service
Calnetix Technologies LLC - Key offerings
SWOT

15.9 Chart Industries Inc.

Chart Industries Inc. - Overview
Chart Industries Inc. - Business segments
Chart Industries Inc. - Key offerings
Chart Industries Inc. - Segment focus
SWOT

15.10 Cryostar

Cryostar - Overview
Cryostar - Product / Service
Cryostar - Key offerings
SWOT

15.11 Elliott Company

Elliott Company - Overview
Elliott Company - Product / Service
Elliott Company - Key offerings
SWOT

15.12 Flowserve Corp.

Flowserve Corp. - Overview
Flowserve Corp. - Business segments
Flowserve Corp. - Key offerings
Flowserve Corp. - Segment focus
SWOT

15.13 Honeywell International Inc.

Honeywell International Inc. - Overview
Honeywell International Inc. - Business segments
Honeywell International Inc. - Key news
Honeywell International Inc. - Key offerings
Honeywell International Inc. - Segment focus
SWOT

15.14 IHI Corp.

IHI Corp. - Overview
IHI Corp. - Business segments
IHI Corp. - Key offerings
IHI Corp. - Segment focus
SWOT

15.15 Kobe Steel Ltd.

Kobe Steel Ltd. - Overview
Kobe Steel Ltd. - Business segments
Kobe Steel Ltd. - Key offerings
Kobe Steel Ltd. - Segment focus
SWOT

15.16 Mitsubishi Heavy Industries

Mitsubishi Heavy Industries - Overview
Mitsubishi Heavy Industries - Business segments
Mitsubishi Heavy Industries - Key offerings
Mitsubishi Heavy Industries - Segment focus
SWOT

15.17 Nikkiso Cryogenic Industries

Nikkiso Cryogenic Industries - Overview
Nikkiso Cryogenic Industries - Product / Service
Nikkiso Cryogenic Industries - Key offerings
SWOT

15.18 Siemens Energy AG

Siemens Energy AG - Overview
Siemens Energy AG - Business segments
Siemens Energy AG - Key news
Siemens Energy AG - Key offerings
Siemens Energy AG - Segment focus
SWOT

16. Appendix

16.1 Scope of the report

Market definition
Objectives
Notes and caveats

16.2 Inclusions and exclusions checklist

Inclusions checklist
Exclusions checklist

16.3 Currency conversion rates for US$

16.4 Research methodology

16.5 Data procurement

Information sources

16.6 Data validation

16.7 Validation techniques employed for market sizing

16.8 Data synthesis

16.9 360 degree market analysis

16.10 List of abbreviations

Research Methodology

Technavio presents a detailed picture of the market by way of study, synthesis, and summation of data from multiple sources. The analysts have presented the various facets of the market with a particular focus on identifying the key industry influencers. The data thus presented is comprehensive, reliable, and the result of extensive research, both primary and secondary.

INFORMATION SOURCES

Primary sources

  • Manufacturers and suppliers
  • Channel partners
  • Industry experts
  • Strategic decision makers

Secondary sources

  • Industry journals and periodicals
  • Government data
  • Financial reports of key industry players
  • Historical data
  • Press releases

DATA ANALYSIS

Data Synthesis

  • Collation of data
  • Estimation of key figures
  • Analysis of derived insights

Data Validation

  • Triangulation with data models
  • Reference against proprietary databases
  • Corroboration with industry experts

REPORT WRITING

Qualitative

  • Market drivers
  • Market challenges
  • Market trends
  • Five forces analysis

Quantitative

  • Market size and forecast
  • Market segmentation
  • Geographical insights
  • Competitive landscape

Interested in this report?

Get your sample now to see our research methodology and insights!

Download Now

Frequently Asked Questions

Turbo Expanders market growth will increase by USD 375.7 million during 2026-2030.

The Turbo Expanders market is expected to grow at a CAGR of 5.6% during 2026-2030.

Turbo Expanders market is segmented by Product type (Radial flow, Axial flow, Hybrid) Type (Compressor coupled, Generator coupled, Hydraulic) End-user (Oil and gas, Industrial gases, Power generation, Others)

Air Liquide SA, Air Products and Chem Inc., ARANER, Atlas Copco AB, Baker Hughes Co., BORSIG GmbH, Calnetix Technologies LLC, Chart Industries Inc., Cryostar, Elliott Company, Flowserve Corp., Honeywell International Inc., IHI Corp., Kobe Steel Ltd., MAN Energy Solutions SE, Mitsubishi Heavy Industries, Nikkiso Cryogenic Industries, PBS Group AS, Rotor Tech Inc, Siemens Energy AG, TURBOGAZ PRJSC are a few of the key vendors in the Turbo Expanders market.

APAC will register the highest growth rate of 40.8% among the other regions. Therefore, the Turbo Expanders market in APAC is expected to garner significant business opportunities for the vendors during the forecast period.

China, India, Japan, South Korea, Australia, Indonesia, US, Canada, Mexico, Germany, Russia, UK, France, Italy, Norway, Saudi Arabia, UAE, South Africa, Egypt, Turkey, Brazil, Argentina, Chile

  • Expansion of global natural gas and liquefied natural gas infrastructure is the driving factor this market.

The Turbo Expanders market vendors should focus on grabbing business opportunities from the Product type segment as it accounted for the largest market share in the base year.
RIA - Research AI Assistant
Ask RIA