
US B2C E-commerce Market Size 2026-2030
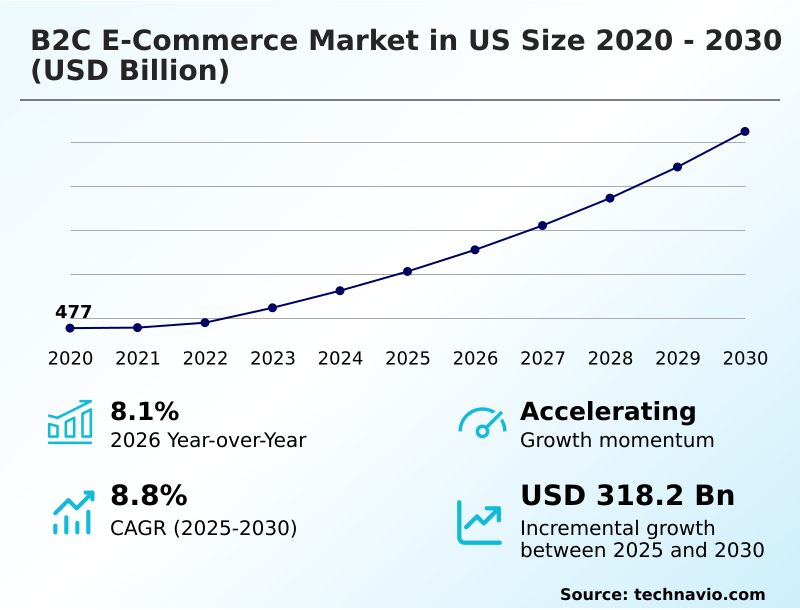
The us b2c e-commerce market size is valued to increase by USD 318.2 billion, at a CAGR of 8.8% from 2025 to 2030. Integration of advanced AI for hyper personalization will drive the us b2c e-commerce market.
Major Market Trends & Insights
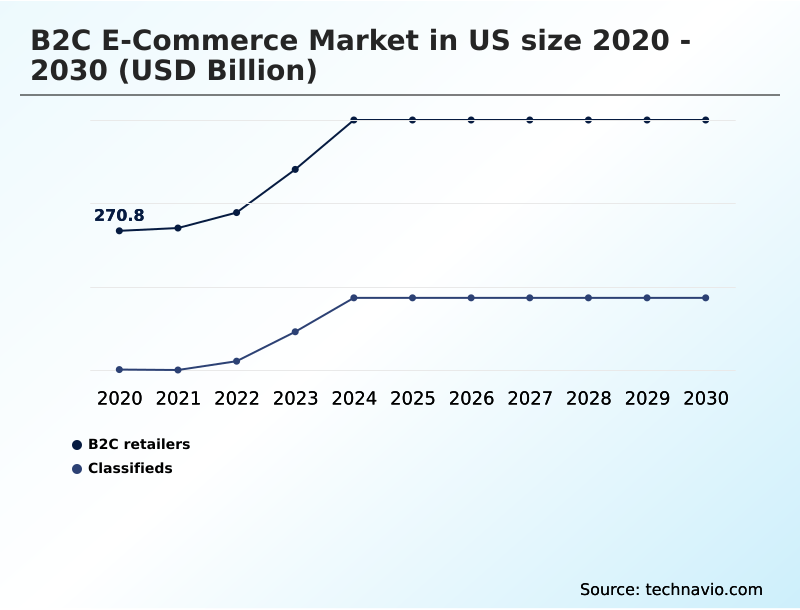
- By Type - B2C retailers segment was valued at USD 322.4 billion in 2024
- By Application - Consumer electronics and home appliances segment accounted for the largest market revenue share in 2024
Market Size & Forecast
- Market Opportunities: USD 447 billion
- Market Future Opportunities: USD 318.2 billion
- CAGR from 2025 to 2030 : 8.8%
Market Summary
- The b2c e-commerce market in US is undergoing a significant transformation, driven by the integration of advanced technologies and evolving consumer expectations. Companies are increasingly moving beyond traditional online retail to create highly personalized and efficient shopping journeys.
- A key aspect of this evolution is the strategic use of physical stores as fulfillment hubs, which reduces last-mile delivery times and enhances logistical agility. In one business scenario, a retailer repurposes its urban store network into micro-distribution centers, enabling it to offer same-day delivery to a large portion of its customer base while optimizing inventory management across all channels.
- This model, combined with the adoption of AI-powered recommendation engines and visual search capabilities, allows for a more dynamic and responsive digital storefront. The market is also influenced by the rise of social commerce and the creator economy, where product discovery and purchasing are seamlessly integrated into social media platforms.
- As companies refine these omnichannel strategies, they are better positioned to meet the demand for convenience and speed, fostering long-term customer loyalty in a competitive environment. The emphasis on sustainability and the circular economy is further shaping business models, with a growing focus on resale and authenticated secondhand goods.
What will be the Size of the US B2C E-commerce Market during the forecast period?
Get Key Insights on Market Forecast (PDF) Get Free Sample
How is the US B2C E-commerce Market Segmented?
The us b2c e-commerce industry research report provides comprehensive data (region-wise segment analysis), with forecasts and estimates in "USD billion" for the period 2026-2030, as well as historical data from 2020-2024 for the following segments.
- Type
- B2C retailers
- Classifieds
- Application
- Consumer electronics and home appliances
- Apparel and accessories
- Personal care
- Others
- Platform
- Multi-brand
- Single-brand
- Geography
- North America
- US
- North America
By Type Insights
The b2c retailers segment is estimated to witness significant growth during the forecast period.
The B2C retailers segment is defined by high investment in logistical infrastructure to shorten the time between order placement and last-mile delivery. Key strategies include transforming physical stores into hybrid fulfillment nodes and leveraging predictive analytics to optimize inventory.
The use of a unified stock pool enables companies to manage inventory across multiple sales channels, ensuring real-time product availability is accurately reflected.
This approach has led to a 60% increase in same-day or next-day delivery capabilities in major urban centers. The segment also benefits from headless commerce architecture and sophisticated digital wallets, which streamline the checkout process.
These retailers use hyper-personalized marketing, dynamic pricing algorithms, and visual search capabilities to improve user engagement and conversion rates through their digital storefronts.
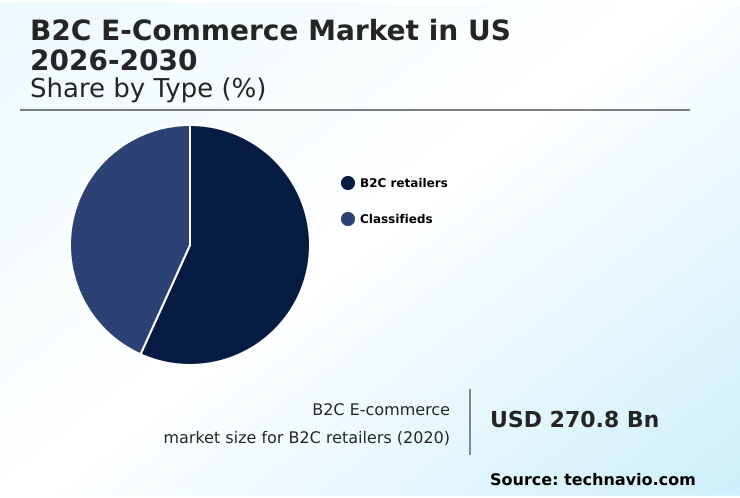
The B2C retailers segment was valued at USD 322.4 billion in 2024 and showed a gradual increase during the forecast period.
Market Dynamics
Our researchers analyzed the data with 2025 as the base year, along with the key drivers, trends, and challenges. A holistic analysis of drivers will help companies refine their marketing strategies to gain a competitive advantage.
- The b2c e-commerce market in US is advancing through sophisticated strategies that address core consumer demands for speed, personalization, and value. The impact of the stores as hubs fulfillment model is significant, enabling companies to leverage physical assets for rapid, localized delivery.
- This approach, combined with AI for hyper-personalization in retail, allows for highly tailored shopping experiences that anticipate consumer needs. The growing influence of social commerce on customer acquisition is reshaping marketing funnels, as brands integrate purchasing capabilities directly into social feeds.
- As the market matures, the role of recommerce platform authentication services becomes critical in building trust within the circular economy, particularly for high-value secondhand goods. The development of agentic commerce for automated replenishment promises to further streamline routine purchases, shifting the consumer focus from transactional tasks to high-level decision-making.
- These interconnected developments show a market moving toward a more automated, efficient, and user-centric future. In this context, unified commerce platforms are proving to be more effective than siloed systems, with integrated platforms showing a 25% higher rate of inventory accuracy, which directly improves customer satisfaction and reduces lost sales.
- The strategic adoption of headless commerce for d2c brands ensures that companies can maintain brand consistency and deliver high-performance experiences across all digital channels, from mobile apps to emerging agent-based interfaces, securing their position in a competitive landscape. The convergence of these elements creates a powerful ecosystem where technology and logistics work in concert to redefine retail.
What are the key market drivers leading to the rise in the adoption of US B2C E-commerce Industry?
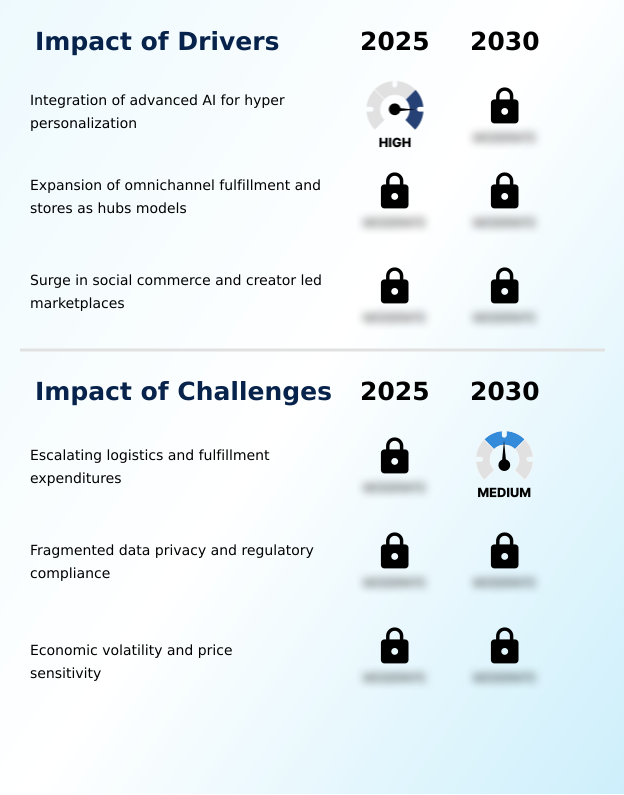
- The integration of advanced AI for hyper-personalization is a key driver propelling the growth of the B2C E-commerce Market in US.
- The growth of the b2c e-commerce market in US is propelled by the integration of advanced technology to create highly personalized shopping experiences.
- The use of generative AI and large language models allows for the creation of sophisticated digital assistants that provide proactive product suggestions, transforming the digital storefront into a dynamic, adaptive environment.
- This has led to an 11x increase in purchases attributed to AI-driven search on some platforms. Another critical driver is the expansion of omnichannel fulfillment, where physical retail locations are repurposed as high-efficiency sortation hubs.
- This model significantly reduces last-mile delivery times and has enabled some companies to report a 26% increase in domestic e-commerce growth.
- Additionally, the surge in social commerce and the creator economy allows for direct in-app transactions, lowering customer acquisition costs through precise targeting within social feeds.
What are the market trends shaping the US B2C E-commerce Industry?
- The adoption of agentic commerce and personal shopping assistants is an emerging market trend. This development signifies a shift toward more autonomous and proactive consumer shopping experiences.
- Key trends are reshaping the b2c e-commerce market in US, with a clear shift toward autonomous and sustainable models. The adoption of agentic commerce is transitioning the market from reactive to proactive shopping, where digital assistants manage tasks like price monitoring and automated replenishment. This evolution is supported by the development of task-specific AI agents.
- Simultaneously, the circular economy is gaining dominance, with recommerce and authenticated secondhand luxury becoming mainstream. This trend, supported by professional verification services, has driven some platforms to expand their certified refurbished programs, which can increase consumer trust by over 40%. A third major trend is the move toward unified commerce, where physical stores become hyper-local fulfillment nodes.
- This strategy leverages existing assets to enable faster delivery, with some retailers now reaching over half the population with next-day service.
What challenges does the US B2C E-commerce Industry face during its growth?
- Escalating logistics and fulfillment expenditures represent a significant challenge affecting the industry's growth and profitability.
- Primary challenges in the b2c e-commerce market in US stem from rising operational costs and regulatory complexities. Escalating logistics and fulfillment expenditures are a major concern, as the demand for rapid delivery necessitates heavy investment in localized fulfillment networks and micro-fulfillment centers. Fee increases for fulfillment services, some averaging $0.31 per unit for standard-sized products, highlight the financial pressures.
- Navigating a fragmented landscape of state-level data privacy laws introduces another layer of complexity. Compliance with new regulations for data portability and opt-out rights requires costly overhauls of digital architectures, with potential penalties reaching $7,500 per violation. These operational and regulatory hurdles are compounded by economic volatility, which heightens consumer price sensitivity and puts pressure on profit margins.
- The use of predictive analytics is crucial for managing these challenges effectively.
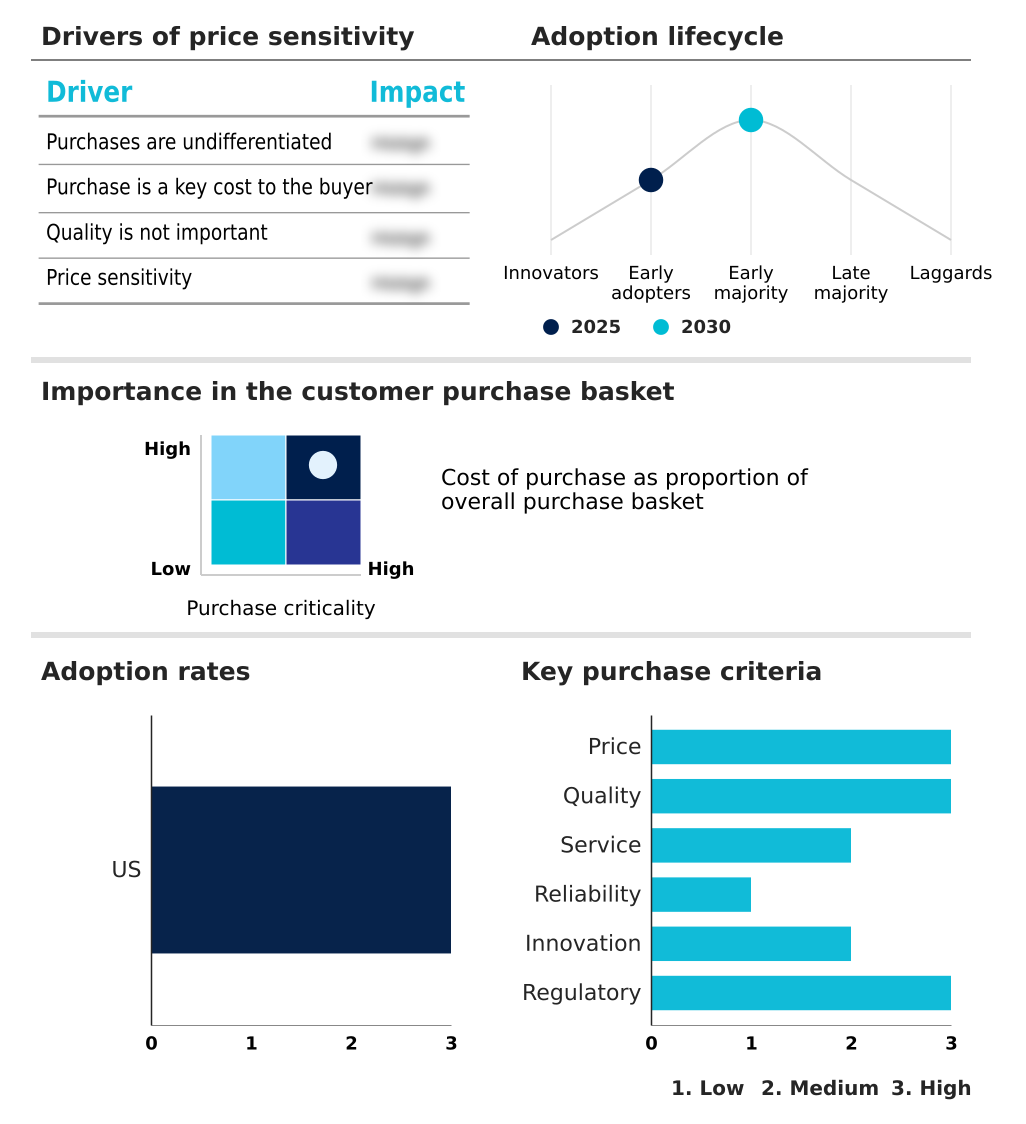
Exclusive Technavio Analysis on Customer Landscape
The us b2c e-commerce market forecasting report includes the adoption lifecycle of the market, covering from the innovator’s stage to the laggard’s stage. It focuses on adoption rates in different regions based on penetration. Furthermore, the us b2c e-commerce market report also includes key purchase criteria and drivers of price sensitivity to help companies evaluate and develop their market growth analysis strategies.
Customer Landscape of US B2C E-commerce Industry
Competitive Landscape
Companies are implementing various strategies, such as strategic alliances, us b2c e-commerce market forecast, partnerships, mergers and acquisitions, geographical expansion, and product/service launches, to enhance their presence in the industry.
Amazon.com Inc. - Offerings include a broad e-commerce selection supported by same-day services like drive-up and delivery, which enhances customer convenience and logistical efficiency.
The industry research and growth report includes detailed analyses of the competitive landscape of the market and information about key companies, including:
- Amazon.com Inc.
- Apple Inc.
- Best Buy Co. Inc.
- Chewy Inc
- Costco Wholesale Corp.
- eBay Inc.
- Etsy Inc.
- Kohls Corp.
- Lowes Co. Inc.
- Macys Inc.
- Newegg Commerce Inc.
- Nordstrom Inc.
- Poshmark Inc.
- Quince
- Target Corp.
- The Home Depot Inc.
- The Kroger Co.
- Walmart Inc.
- Wayfair Inc.
Qualitative and quantitative analysis of companies has been conducted to help clients understand the wider business environment as well as the strengths and weaknesses of key industry players. Data is qualitatively analyzed to categorize companies as pure play, category-focused, industry-focused, and diversified; it is quantitatively analyzed to categorize companies as dominant, leading, strong, tentative, and weak.
Recent Development and News in Us b2c e-commerce market
- In August 2024, Walmart Inc. enhanced its marketplace by launching the multichannel solutions program, enabling third-party sellers to use its supply chain for fulfilling orders from various platforms.
- In January 2025, Shopify Inc. reported that purchases attributed to its artificial intelligence search tools increased elevenfold year-over-year, underscoring the rapid adoption of generative AI in e-commerce.
- In March 2025, eBay Inc. projected its gross merchandise volume for the first quarter to be between $18.3 billion and $18.6 billion, while also committing to a net-zero carbon emission goal for 2045.
- In May 2025, Walmart Inc. outlined its strategy for developing an agentic future, focusing on a surgical approach to task-specific AI agents designed to handle complex consumer workflows.
Dive into Technavio’s robust research methodology, blending expert interviews, extensive data synthesis, and validated models for unparalleled US B2C E-commerce Market insights. See full methodology.
| Market Scope | |
|---|---|
| Page number | 181 |
| Base year | 2025 |
| Historic period | 2020-2024 |
| Forecast period | 2026-2030 |
| Growth momentum & CAGR | Accelerate at a CAGR of 8.8% |
| Market growth 2026-2030 | USD 318.2 billion |
| Market structure | Fragmented |
| YoY growth 2025-2026(%) | 8.1% |
| Key countries | US |
| Competitive landscape | Leading Companies, Market Positioning of Companies, Competitive Strategies, and Industry Risks |
Research Analyst Overview
- The b2c e-commerce market in US is advancing through deep technological integration and sophisticated logistical frameworks. The adoption of a unified stock pool is central to modern retail, enabling real-time inventory visibility across online and offline channels. This is complemented by headless commerce architecture, which decouples the front-end presentation layer from back-end e-commerce functionality, allowing for greater flexibility.
- Agentic commerce is an emerging paradigm where AI-driven personal shopping agents automate complex consumer workflows. Companies are leveraging generative AI to enhance everything from product discovery to customer service. In logistics, the focus is on last-mile delivery optimization and the strategic use of stores as fulfillment hubs, supported by automated sortation centers and micro-fulfillment centers.
- This omnichannel fulfillment strategy is crucial for meeting consumer expectations. On the consumer-facing side, visual search capabilities and virtual try-on technology are becoming standard. Behind the scenes, dynamic pricing algorithms and predictive analytics inform inventory management, while secure payment gateways and advanced fraud detection systems ensure transaction integrity.
- Furthermore, companies are building retail media networks and utilizing digital wallets to create a seamless customer journey. This complex ecosystem, where some platforms have achieved a 60% share of same-or-next-day deliveries in key metro areas, highlights a market defined by intense competition and continuous innovation.
What are the Key Data Covered in this US B2C E-commerce Market Research and Growth Report?
-
What is the expected growth of the US B2C E-commerce Market between 2026 and 2030?
-
USD 318.2 billion, at a CAGR of 8.8%
-
-
What segmentation does the market report cover?
-
The report is segmented by Type (B2C retailers, and Classifieds), Application (Consumer electronics and home appliances, Apparel and accessories, Personal care, and Others), Platform (Multi-brand, and Single-brand) and Geography (North America)
-
-
Which regions are analyzed in the report?
-
North America
-
-
What are the key growth drivers and market challenges?
-
Integration of advanced AI for hyper personalization, Escalating logistics and fulfillment expenditures
-
-
Who are the major players in the US B2C E-commerce Market?
-
Amazon.com Inc., Apple Inc., Best Buy Co. Inc., Chewy Inc, Costco Wholesale Corp., eBay Inc., Etsy Inc., Kohls Corp., Lowes Co. Inc., Macys Inc., Newegg Commerce Inc., Nordstrom Inc., Poshmark Inc., Quince, Target Corp., The Home Depot Inc., The Kroger Co., Walmart Inc. and Wayfair Inc.
-
Market Research Insights
- The B2C e-commerce market in US is characterized by intense competition and rapid technological adoption. Companies are leveraging retail media networks and advanced fraud detection to secure transactions and open new revenue streams, with some platforms reporting a 41% increase in advertising business growth.
- The use of circular economy models is also on the rise, as seen in the expansion of certified refurbished programs, which can extend product lifecycles and attract value-conscious consumers. The integration of augmented reality and virtual try-on technology helps bridge the gap between digital and physical shopping, reducing return rates by up to 30% in categories like apparel.
- Furthermore, buy now pay later solutions are being adopted to increase average order values. This dynamic environment requires continuous innovation in fulfillment and customer engagement to maintain a competitive edge.
We can help! Our analysts can customize this us b2c e-commerce market research report to meet your requirements.
 RIA -
RIA - 
