US Dental Clearing Houses Market Size 2025-2029
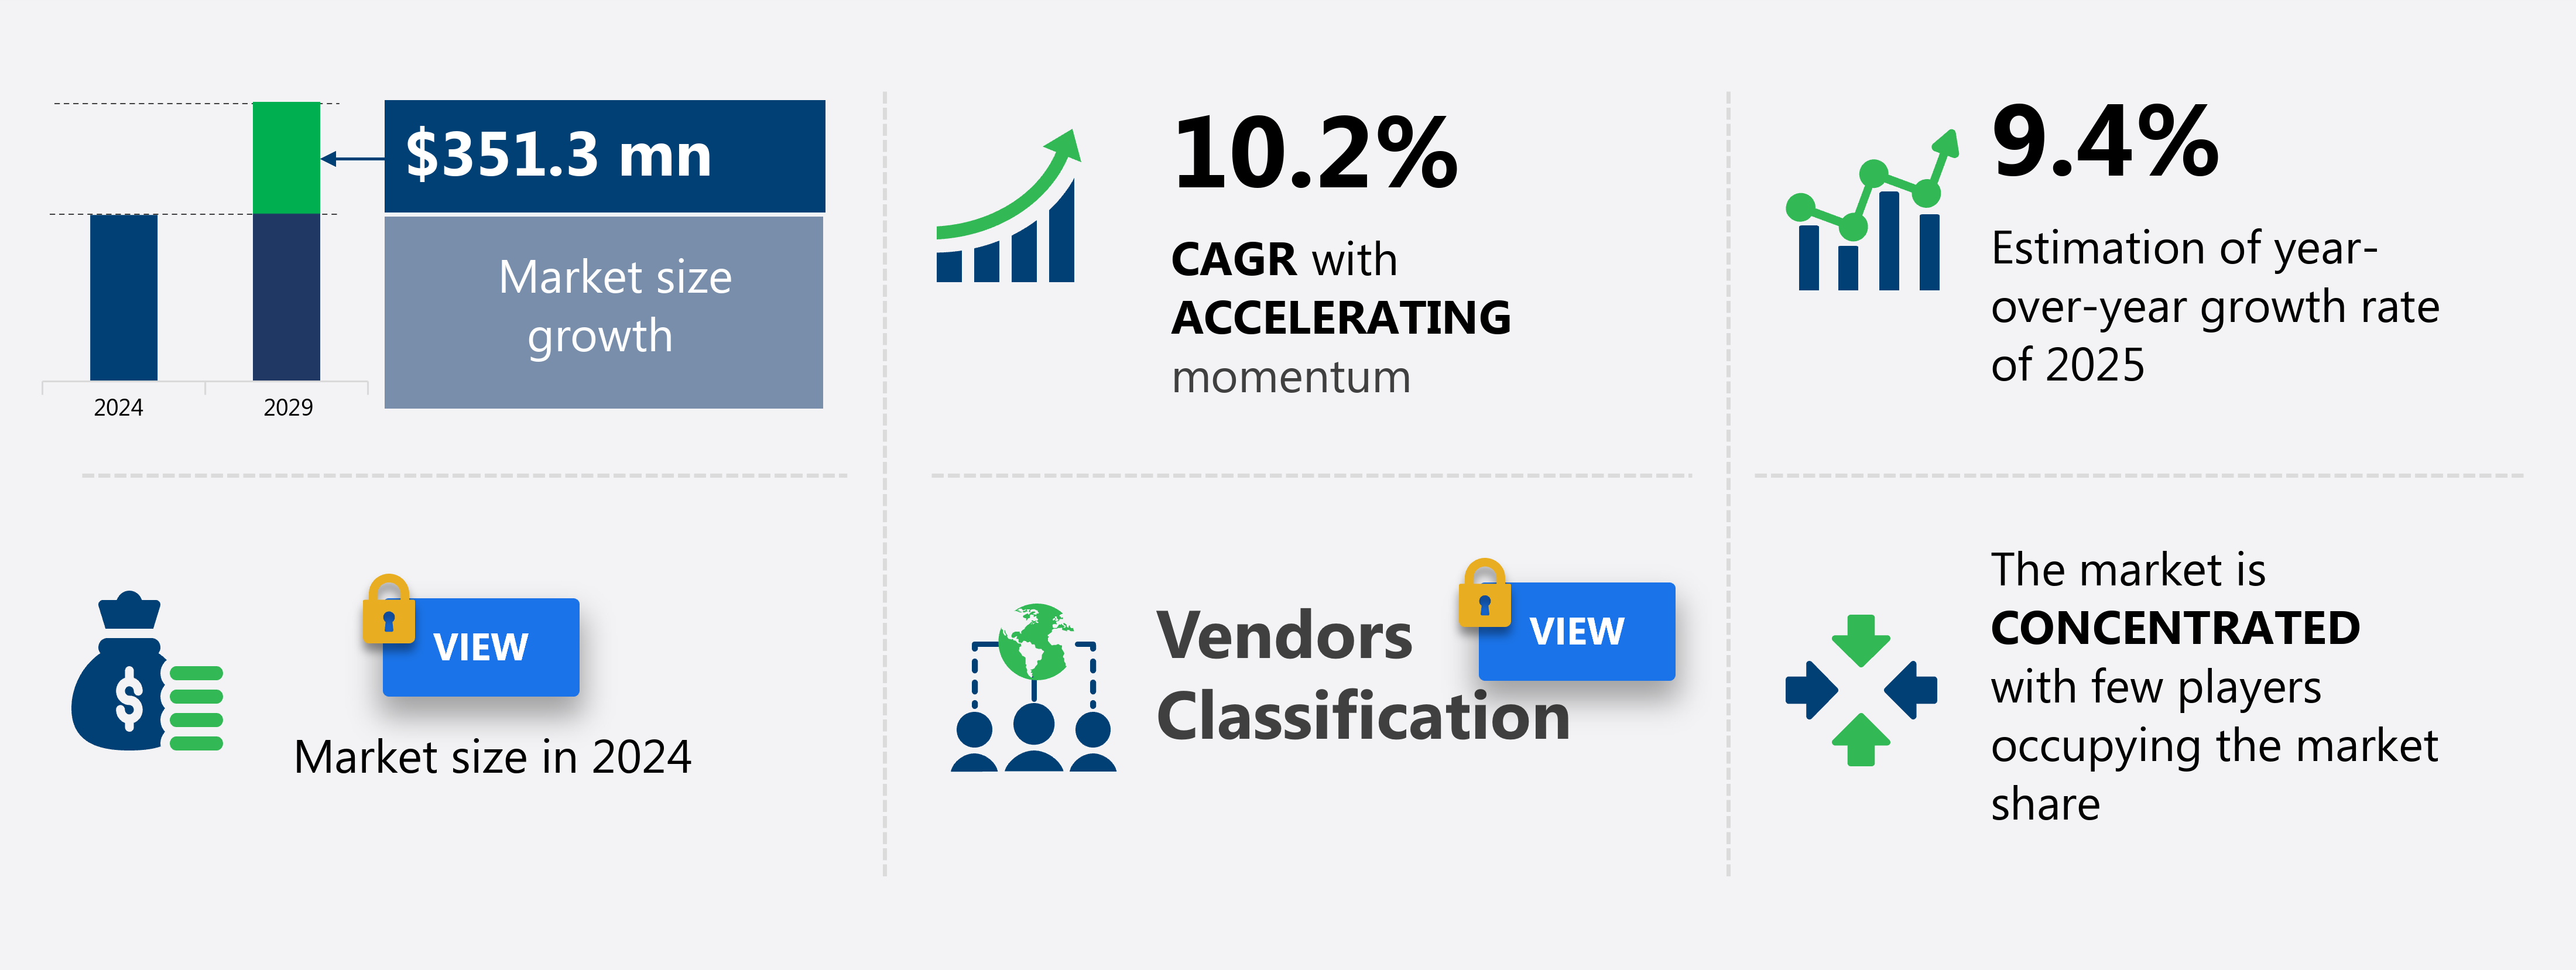
The US dental clearing houses market size is forecast to increase by USD 351.3 million, at a CAGR of 10.2% between 2024 and 2029.
- The market is experiencing significant growth due to expanding dental insurance coverage, which is increasing the number of dental procedures being performed. Strategic partnerships and collaborations among market players are also driving market growth. However, data security and privacy concerns continue to pose challenges for dental clearing houses, as they handle sensitive patient information. Advanced technologies, such as predictive analytics, anomaly detection, and automation, are transforming the dental clearing houses market by streamlining processes and reducing administrative burdens. Mobile payments, patient reminders, and electronic health records are becoming increasingly popular, enabling dental practices to enhance patient engagement and improve operational efficiency. To address these concerns, market participants are investing in advanced security technologies and implementing stringent data protection policies. Overall, these trends and challenges are shaping the future of the dental clearing houses market.
What will be the Size of the market During the Forecast Period?
- The dental clearing houses market encompasses the provision of services and technologies that facilitate the administrative process between healthcare providers and insurance payers In the dental industry. This market is characterized by a significant volume of electronic claim submissions, driven by the widespread adoption of medical billing software and electronic data interchange. The market's size is substantial, with millions of patient encounters resulting in claims each year. Efficiency is a key factor In the market, with administration time and claim denial rates being major areas of focus. HIPAA compliance and data security concerns are also significant considerations. Automation, predictive analytics, and anomaly detection are increasingly utilized to streamline the claims processing and reimbursement cycle.
- In addition, the market is witnessing a digitalization trend, with electronic submission volumes continuing to grow. Patient responsibility, including patient encounters and claim denials, is another important aspect of the market. Dental clearing houses offer solutions that help providers manage these aspects, ensuring accurate and timely reimbursement. The market is dynamic, with ongoing advancements in technology and evolving industry requirements shaping its direction.
How is this market segmented and which is the largest segment?
The market research report provides comprehensive data (region-wise segment analysis), with forecasts and estimates in "USD million" for the period 2025-2029, as well as historical data from 2019-2023 for the following segments.
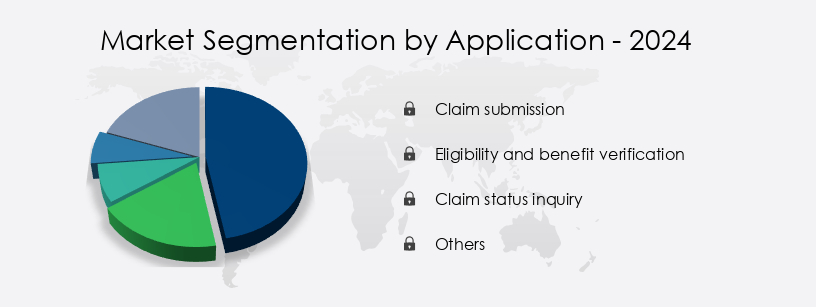
- Application
- Claim submission
- Eligibility and benefit verification
- Claim status inquiry
- Others
- End-user
- Dental hospitals and clinics
- Dental service organizations (DSOs)
- Insurance companies
- Geography
- US
By Application Insights
The claim submission segment is estimated to witness significant growth during the forecast period. The claim submission segment in the US dental clearing houses market plays a crucial role by facilitating the electronic transmission of dental claims to insurance payers. This application streamlines the reimbursement process for dental practices, minimizing claim denials and expediting payments. Claim submission is the most frequently used application In the market, with solutions like EDI Health Group's ClaimConnect leading the way. ClaimConnect, which boasts a 99% clean claim rate, is designed to eliminate delays and accelerate payments, thereby reducing claim costs, processing time, and manual paperwork for dental providers. Advanced technologies, such as Electronic Data Interchange (EDI), predictive analytics, and anomaly detection, are integral to these claim submission solutions, ensuring operational efficiency, HIPAA compliance, and data security.
Get a glance at the market report of share of various segments Request Free Sample
Market Dynamics
Our US Dental Clearing Houses Market researchers analyzed the data with 2024 as the base year, along with the key drivers, trends, and challenges. A holistic analysis of drivers will help companies refine their marketing strategies to gain a competitive advantage.
What are the key market drivers leading to the rise in the adoption of US Dental Clearing Houses Market?
- Expansion of dental insurance coverage is the key driver of the market. The market is experiencing significant growth due to the increasing number of insured individuals under dental insurance policies. According to the Centers for Medicare and Medicaid Services (CMS), approximately 21 million people have enrolled in dental coverage through marketplaces since the beginning of 2024. This expansion of dental insurance coverage necessitates efficient management of the resulting increase in dental claims. Dental clearing houses play a crucial role in ensuring quick and accurate processing and payments by streamlining the claims submission, validation, and reimbursement processes. Advanced technologies, such as Electronic Data Interchange (EDI), electronic submission, predictive analytics, anomaly detection, and automation, are transforming the market.
- Moreover, these technologies enable healthcare providers and insurance payers to exchange data electronically, reducing administrative burdens and initial implementation costs. HIPAA compliance, coding and billing, mobile payments, patient reminders, and claims management tools are integral components of these advanced technologies. The DentalXChange, Change Healthcare, Electronic Dental, and other claims management tools offer features like electronic submission volumes, patient encounters, claim denials, and reimbursement cycles. These tools integrate with medical billing software, electronic health records, and digitalization to provide operational efficiency, technology integration, and communication. Data security is a critical concern, and these tools ensure secure data exchange and compliance with regulatory requirements.
What are the market trends shaping the US Dental Clearing Houses Market?
- Strategic partnerships and collaborations is the upcoming trend In the market. In the market, strategic partnerships and collaborations are playing a pivotal role in enhancing claims processing efficiency and revenue cycle management for healthcare providers. These alliances enable dental clearing houses to address market challenges, such as claim denial rates, and offer streamlined processes to dental professionals.
- Moreover, claim denial rates remain a significant challenge for dental practices, necessitating advanced technologies and coding and billing expertise. Electronic Data Interchange (EDI) and electronic submission of claims are essential for insurance payers and healthcare providers to maintain administrative efficiency and profitability. HIPAA compliance is crucial in ensuring data security and privacy in dental claims processing.
What challenges does US Dental Clearing Houses Market face during the growth?
- Data security and privacy concerns is a key challenge affecting the market growth. In the market, administration efficiency is a critical factor for healthcare providers and insurance payers alike. The use of advanced technologies, such as Electronic Data Interchange (EDI) and medical billing software, streamlines claims processing and reimbursement, reducing patient responsibility and claim denial rates. However, the handling of sensitive patient information presents significant data security concerns. Dental clearing houses must ensure HIPAA compliance, protect against cyber threats, and manage initial implementation costs.
- The market is driven by the need for technology integration, communication, and data exchange to minimize administrative burdens. The adoption of electronic health records, digitalization, and insurance procedures is accelerating, along with regulatory requirements and the increasing use of artificial intelligence and telehealth for remote services. Despite these advancements, insurance claims processing remains complex, with claims validation, reimbursement cycles, and data security remain key challenges.
Exclusive Customer Landscape
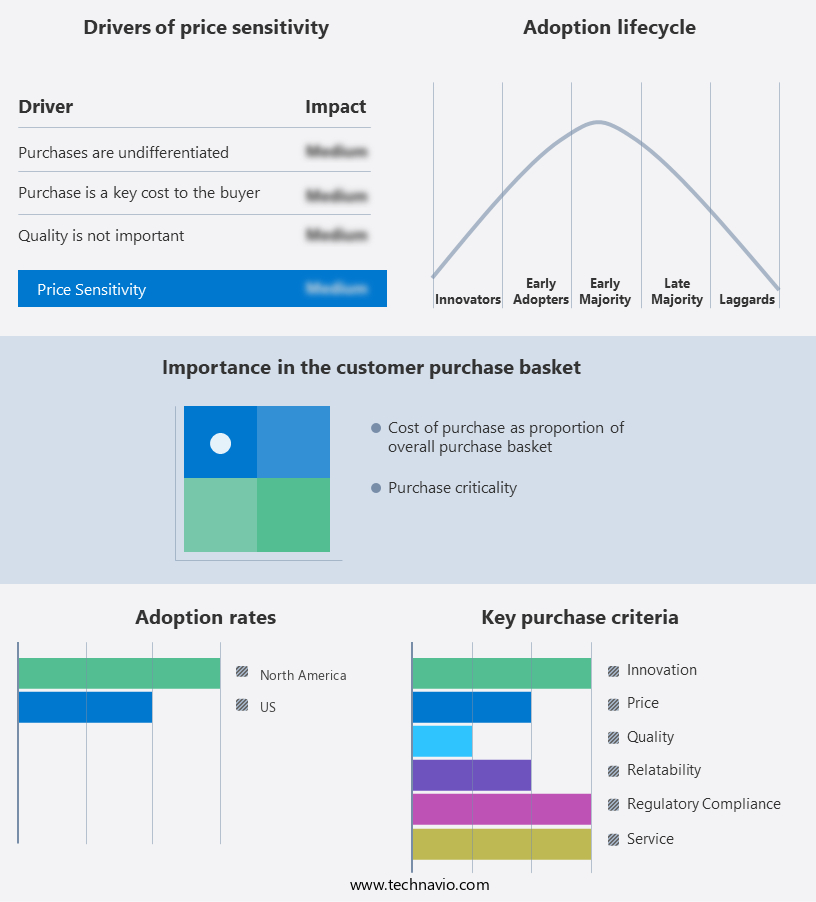
The market forecasting report includes the adoption lifecycle of the market, covering from the innovator's stage to the laggard's stage. It focuses on adoption rates in different regions based on penetration. Furthermore, the market report also includes key purchase criteria and drivers of price sensitivity to help companies evaluate and develop their market growth analysis strategies.
Customer Landscape
Key Companies & Market Insights
Companies are implementing various strategies, such as strategic alliances, market forecast, partnerships, mergers and acquisitions, geographical expansion, and product/service launches, to enhance their presence In the market.
Delta Dental Plans Association - The company offers dental clearing houses such as Renaissance Electronic Services (RES) which includes e-commerce solutions such as a web-based toolkit for claims, Remote Lite for submitting unlimited claims to all payers, R-Statements for outsourcing patient statements, and R-Attachments for sending claim attachments electronically.
The market research and growth report includes detailed analyses of the competitive landscape of the market and information about key companies, including:
- Dental Cashflow Solutions
- EDI Health Group
- Electronic Dental Services
- HENRY SCHEIN INC.
- Napa EA MEDX LLC
- Optum Inc.
- Smart Data Solutions
Qualitative and quantitative analysis of companies has been conducted to help clients understand the wider business environment as well as the strengths and weaknesses of key market players. Data is qualitatively analyzed to categorize companies as pure play, category-focused, industry-focused, and diversified; it is quantitatively analyzed to categorize companies as dominant, leading, strong, tentative, and weak.
Research Analyst Overview
The dental clearing house market plays a crucial role in facilitating the administrative exchange of information between healthcare providers and insurance payers. This market encompasses various solutions and tools designed to streamline the claims processing and reimbursement cycle, ensuring operational efficiency and profitability for dental practices. Electronic Data Interchange (EDI) is a key technology driving the dental clearing house market. EDI enables seamless and secure data exchange between dental providers and payers, reducing administrative burdens and claim denial rates. Medical billing software and claims processing systems are integral components of these clearing houses, allowing for efficient coding and billing, electronic submission, and predictive analytics.
Furthermore, advanced technologies, such as artificial intelligence (AI) and automation, are increasingly being adopted In the dental clearing house market. These technologies enable claims validation, anomaly detection, and reimbursement cycle optimization. Mobile payments and patient reminders are additional features that contribute to the market's growth, enhancing the patient experience and improving overall profitability and productivity. However, the dental clearing house market is not without challenges. Initial implementation costs and data security concerns are major factors influencing market dynamics. Compliance with regulatory requirements, such as HIPAA, is essential to maintain data security and protect sensitive patient information. Telehealth and remote services are also transforming the dental industry, necessitating technology integration and communication between various stakeholders.
In addition, the dental clearing house market is witnessing a significant digital transformation, with electronic dental services, electronic health records, and digitalization becoming increasingly prevalent. This shift towards advanced technologies is enabling more streamlined processes, reducing administrative burdens, and improving overall efficiency in dental practices. The market's growth is driven by technologies such as EDI, AI, and automation, while challenges include initial implementation costs, data security concerns, and regulatory requirements. The market's future is characterized by digitalization, telehealth, and remote services, necessitating continued innovation and integration to meet the evolving needs of dental practices.
|
Market Scope |
|
|
Report Coverage |
Details |
|
Page number |
139 |
|
Base year |
2024 |
|
Historic period |
2019-2023 |
|
Forecast period |
2025-2029 |
|
Growth momentum & CAGR |
Accelerate at a CAGR of 10.2% |
|
Market Growth 2025-2029 |
USD 351.3 million |
|
Market structure |
Concentrated |
|
YoY growth 2024-2025(%) |
9.4 |
|
Key countries |
US and North America |
|
Competitive landscape |
Leading Companies, Market Positioning of Companies, Competitive Strategies, and Industry Risks |
What are the Key Data Covered in this Market Research and Growth Report?
- CAGR of the market during the forecast period
- Detailed information on factors that will drive the market growth and forecasting between 2025 and 2029
- Precise estimation of the size of the market and its contribution of the market in focus to the parent market
- Accurate predictions about upcoming market growth and trends and changes in consumer behaviour
- Growth of the market across US
- Thorough analysis of the market's competitive landscape and detailed information about companies
- Comprehensive analysis of factors that will challenge the growth of market companies
We can help! Our analysts can customize this market research report to meet your requirements. Get in touch
 RIA -
RIA - 
